The logistic distribution
Intermediate Regression with statsmodels in Python

Maarten Van den Broeck
Content Developer at DataCamp
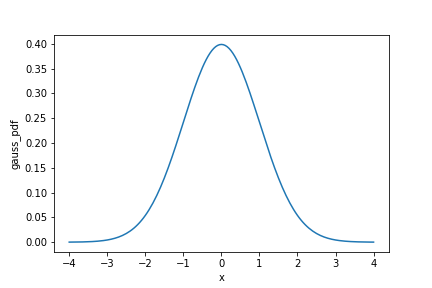
Gaussian probability density function (PDF)
from scipy.stats import norm

x = np.arange(-4, 4.05, 0.05)

gauss_dist = pd.DataFrame({
  "x": x,
  "gauss_pdf": norm.pdf(x)}
)
sns.lineplot(x="x",
             y="gauss_pdf",
             data=gauss_dist)
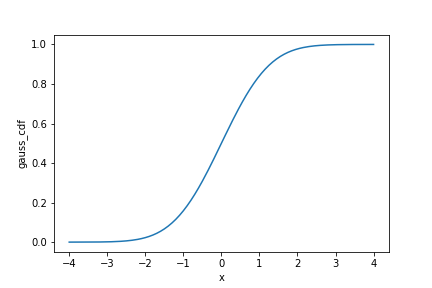
Gaussian cumulative distribution function (CDF)
x = np.arange(-4, 4.05, 0.05)

gauss_dist = pd.DataFrame({
  "x": x,
   "gauss_pdf": norm.pdf(x),
   "gauss_cdf": norm.cdf(x)}
)
sns.lineplot(x="x",
             y="gauss_cdf",
             data=gauss_dist)
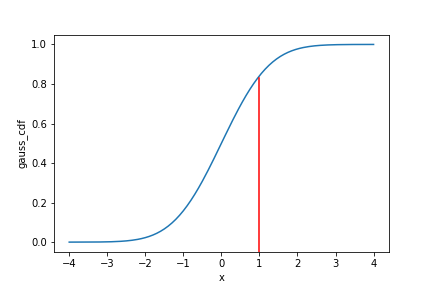
Gaussian cumulative distribution function (CDF)
x = np.arange(-4, 4.05, 0.05)

gauss_dist = pd.DataFrame({
  "x": x,
   "gauss_pdf": norm.pdf(x),
   "gauss_cdf": norm.cdf(x)}
)
sns.lineplot(x="x",
             y="gauss_cdf",
             data=gauss_dist)
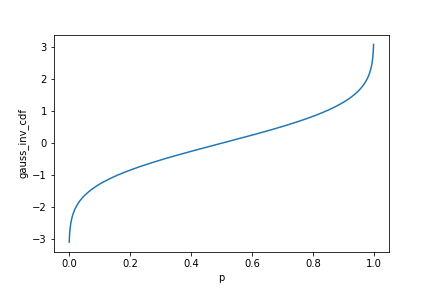
Gaussian inverse CDF
p = np.arange(0.001, 1, 0.001)

gauss_dist_inv = pd.DataFrame({
  "p": p,
  "gauss_inv_cdf": norm.ppf(p)}
)
sns.lineplot(x="p",
             y="gauss_inv_cdf",
             data=gauss_dist_inv)
Logistic PDF
from scipy.stats import logistic

x = np.arange(-4, 4.05, 0.05)

logistic_dist = pd.DataFrame({
  "x": x,
  "log_pdf": logistic.pdf(x)}
)
sns.lineplot(x="x",
             y="log_pdf",
             data=logistic_dist)
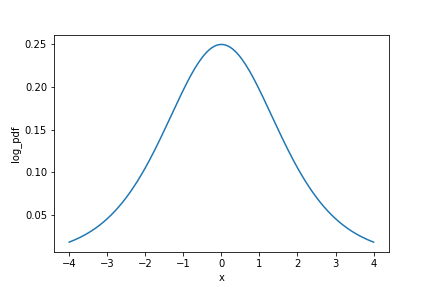
Logistic distribution
- Logistic distribution CDF is also called the logistic function.
$\text{cdf}(x) = \frac{1}{(1 + exp(-x))}$
Logistic distribution inverse CDF is also called the logit function.
- $\text{inverse\_cdf}(p) = log(\frac{p}{(1 - p)})$
Let's practice!
Intermediate Regression with statsmodels in Python

