How linear regression works
Intermediate Regression with statsmodels in Python

Maarten Van den Broeck
Content Developer at DataCamp
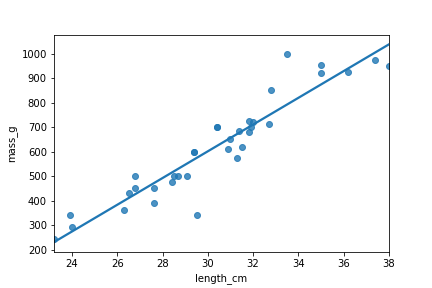
The standard simple linear regression plot

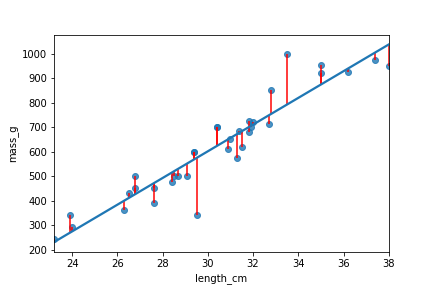
Visualizing residuals

A metric for the best fit
The simplest idea (which doesn't work)
- Take the sum of all the residuals.
- Some residuals are negative.
The next simplest idea (which does work)
- Take the square of each residual, and add up those squares.
- This is called the sum of squares.
A detour into numerical optimization
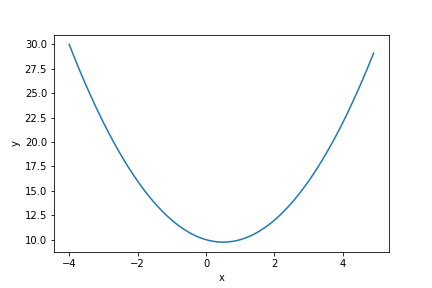
A line plot of a quadratic equation
x = np.arange(-4, 5, 0.1)
y = x ** 2 - x + 10

xy_data = pd.DataFrame({"x": x,
                        "y": y})

sns.lineplot(x="x",
             y="y",
             data=xy_data)

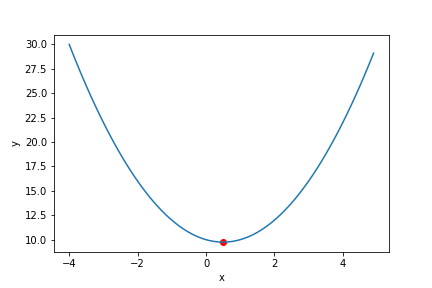
Using calculus to solve the equation
$y = x ^ 2 - x + 10$
$\frac{\partial y}{\partial x} = 2 x - 1$
$0 = 2 x - 1$
$x = 0.5$
$y = 0.5 ^ 2 - 0.5 + 10 = 9.75$
- Not all equations can be solved like this.
- You can let Python figure it out.
Don't worry if this doesn't make sense, you won't need it for the exercises.

minimize()
from scipy.optimize import minimize
def calc_quadratic(x):
  y = x ** 2 - x + 10
  return y
minimize(fun=calc_quadratic,
         x0=3)
      fun: 9.75
 hess_inv: array([[0.5]])
      jac: array([0.])
  message: 'Optimization terminated successfully.'
     nfev: 6
      nit: 2
     njev: 3
   status: 0
  success: True
        x: array([0.49999998])
A linear regression algorithm
Define a function to calculate the sum of squares metric.
Call minimize() to find coefficients that minimize this function.
def calc_sum_of_squares(coeffs):
  intercept, slope = coeffs
  # More calculation!
minimize(
  fun=calc_sum_of_squares,
  x0=0
)
Let's practice!
Intermediate Regression with statsmodels in Python

