How linear regression works
Intermediate Regression with statsmodels in Python

Maarten Van den Broeck
Content Developer at DataCamp
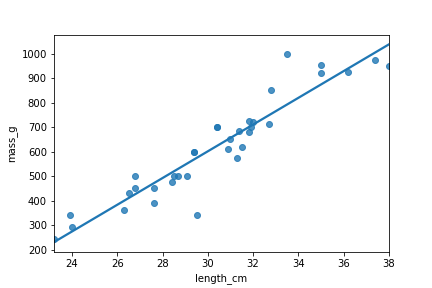
The standard simple linear regression plot
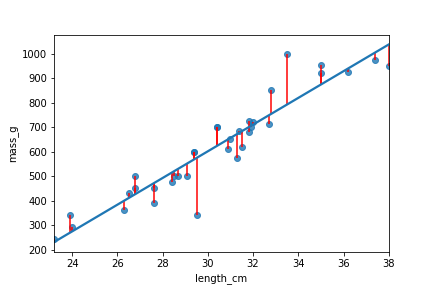
Visualizing residuals
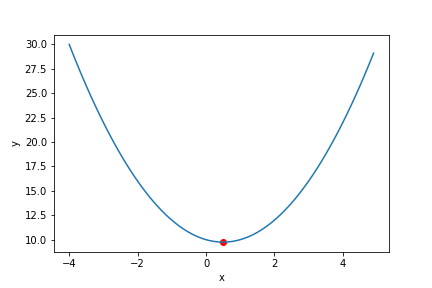
A detour into numerical optimization
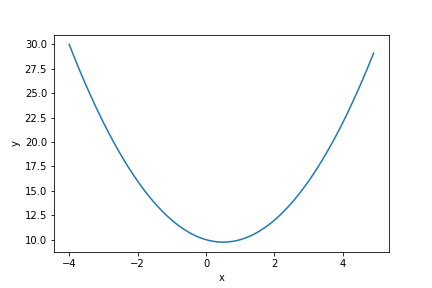
Using calculus to solve the equation