Two numeric explanatory variables
Intermediate Regression with statsmodels in Python

Maarten Van den Broeck
Content Developer at DataCamp
3D scatter plot

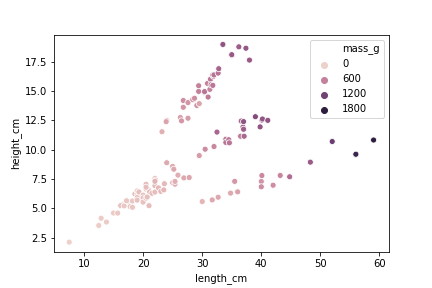
2D scatter plot, color for response
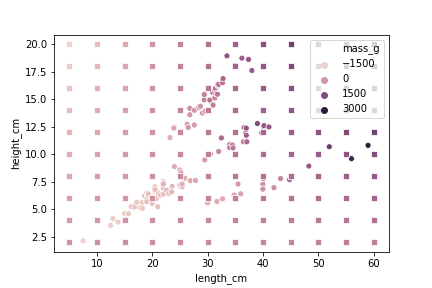
Plotting the predictions
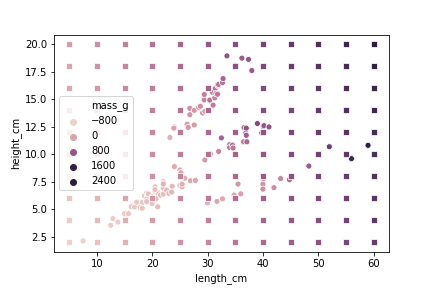
Plotting the predictions
Intermediate Regression with statsmodels in Python
Maarten Van den Broeck
Content Developer at DataCamp

