Cross-validation
Machine Learning with Tree-Based Models in R

Sandro Raabe
Data Scientist
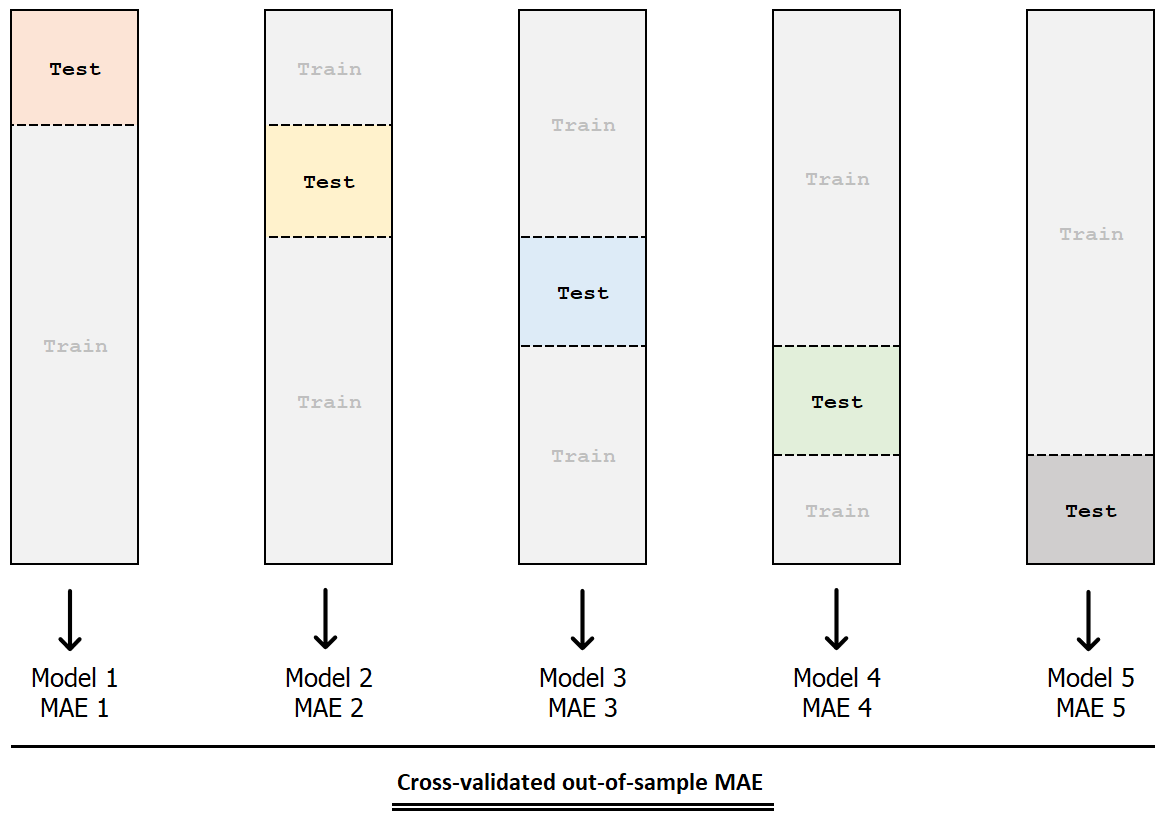
k-fold cross-validation
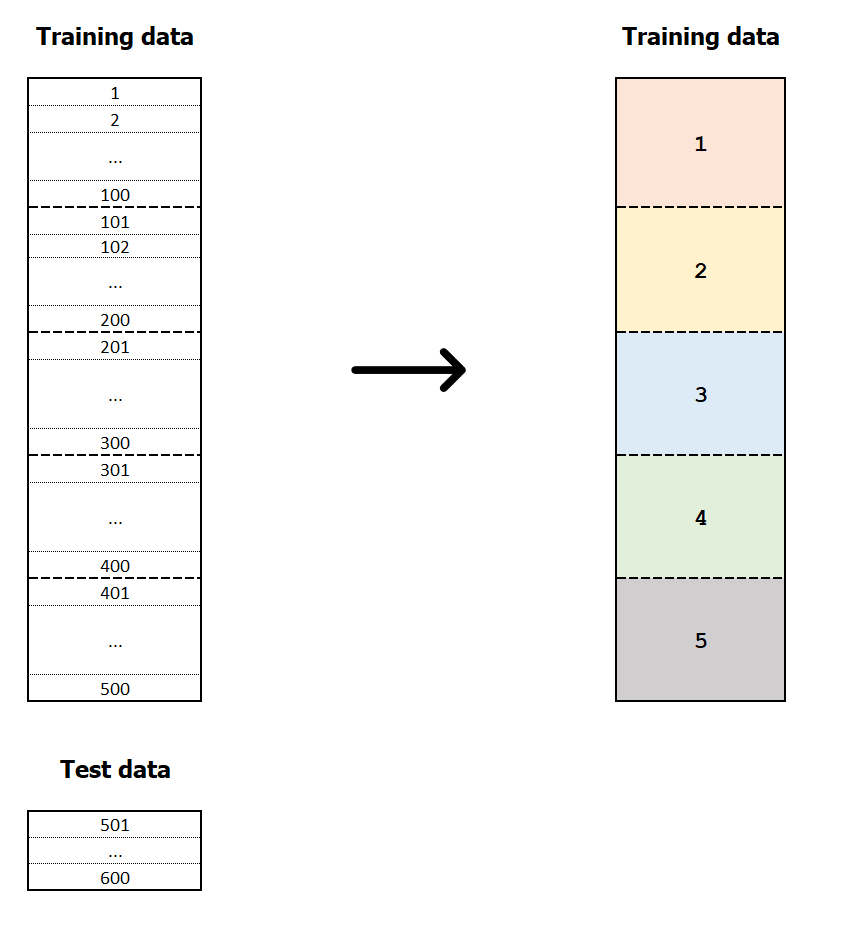
k-fold cross-validation
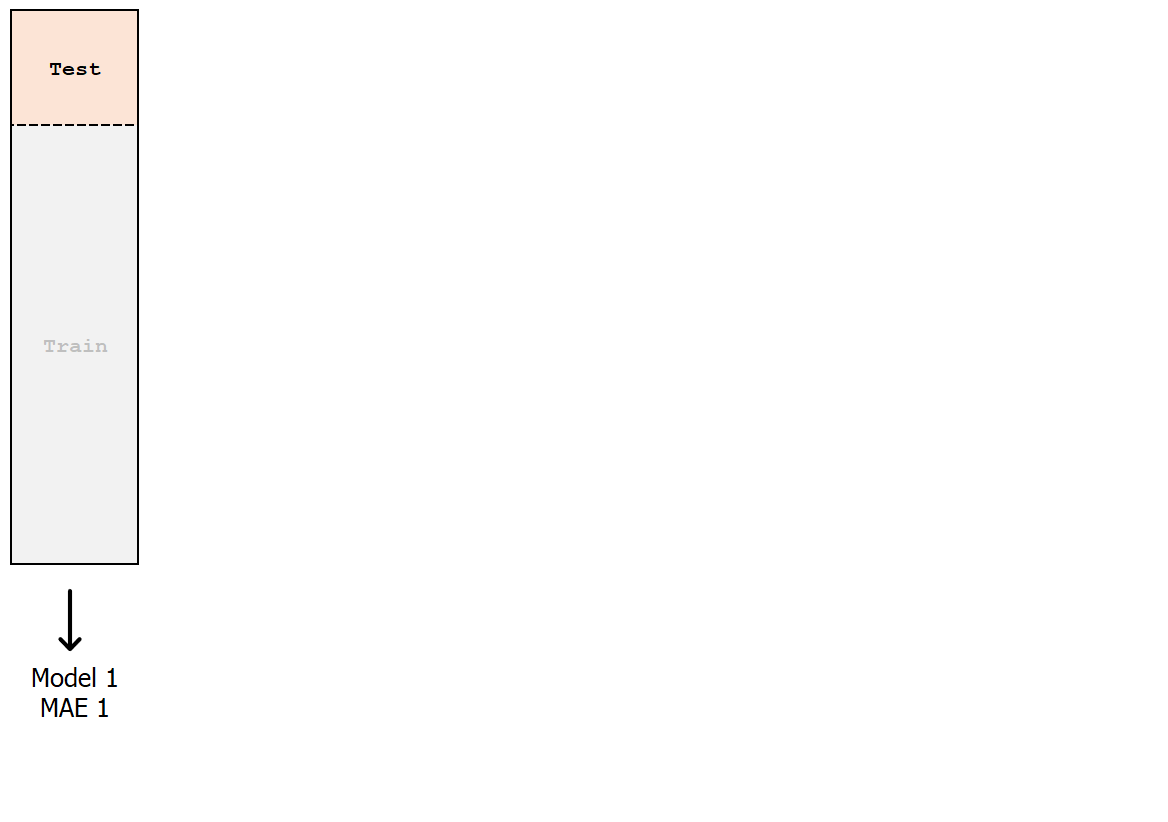
k-fold cross-validation
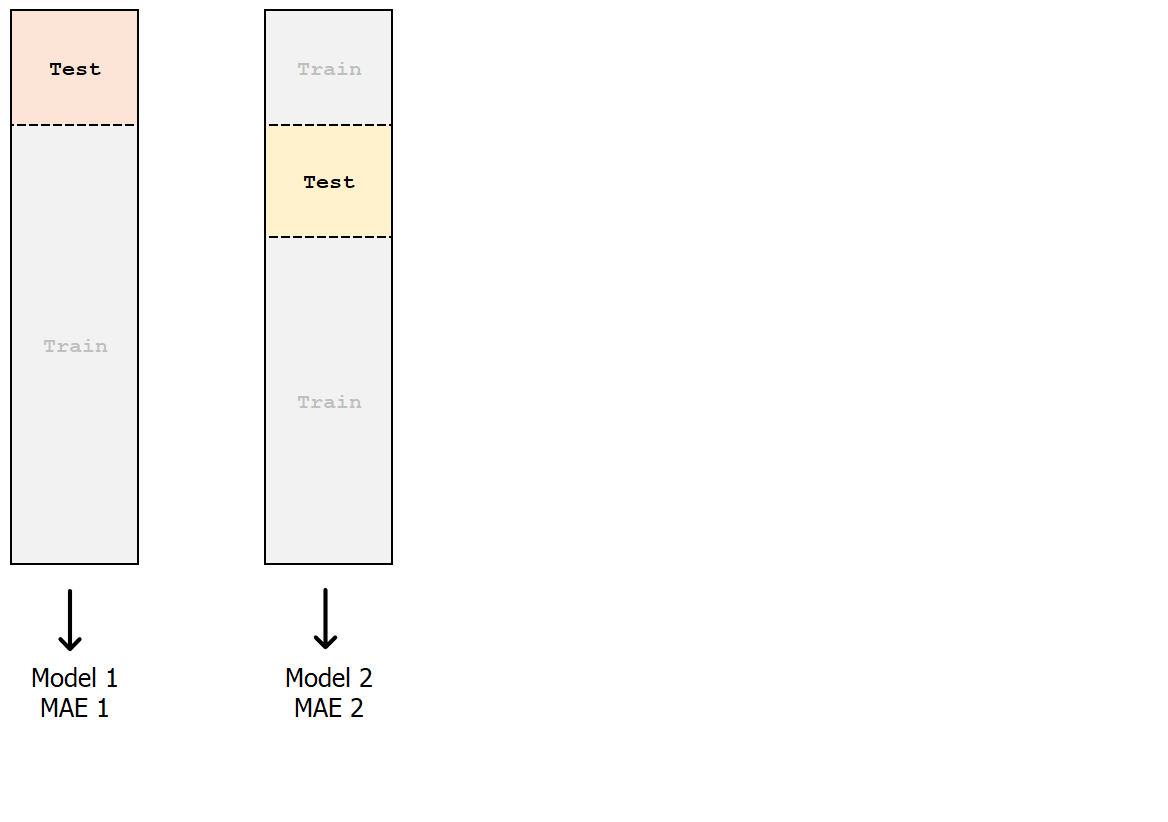
k-fold cross-validation

k-fold cross-validation
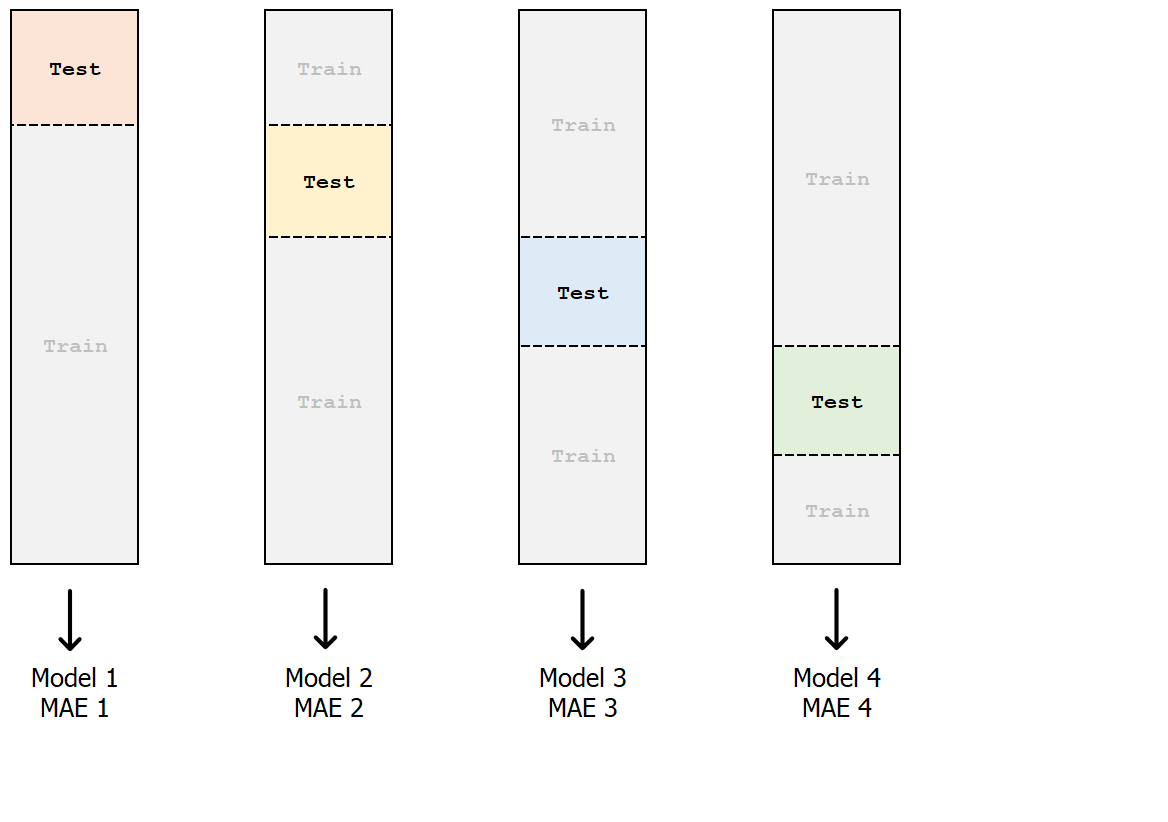
k-fold cross-validation
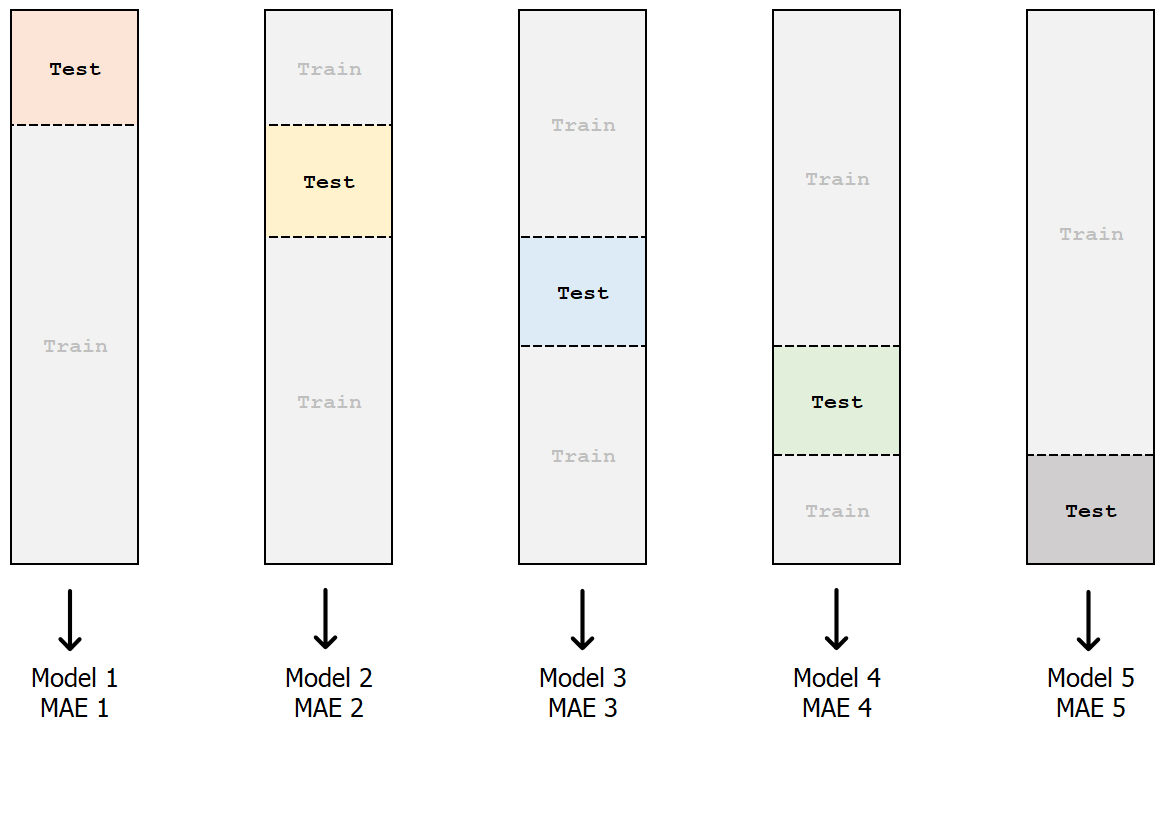
k-fold cross-validation
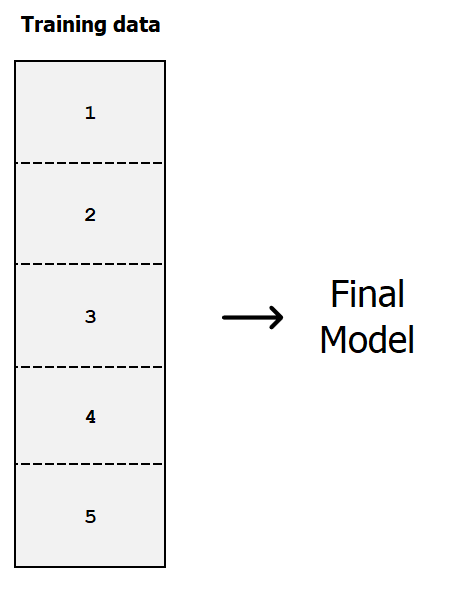
Fit final model on the full dataset
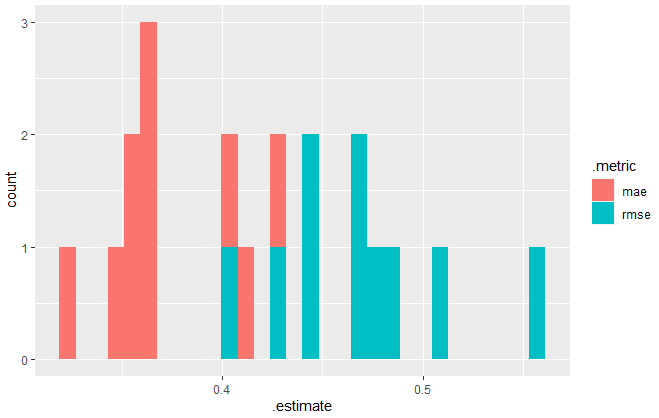
Coding - Collect all errors
library(ggplot2)
ggplot(all_errors, aes(x = .estimate,
                       fill = .metric)) +
   geom_histogram()