Performance metrics for regression trees
Machine Learning with Tree-Based Models in R

Sandro Raabe
Data Scientist
Common metrics for regression
- Mean Absolute Error (MAE)
- Root Mean Square Error (RMSE)
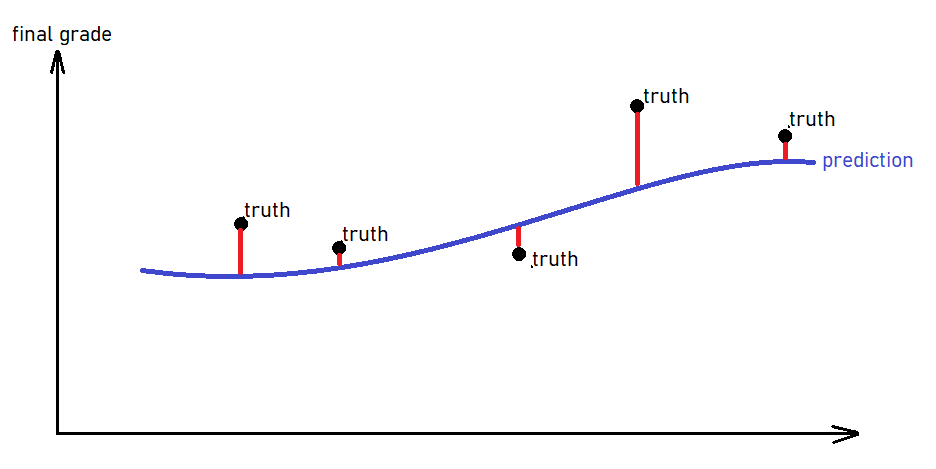
MAE intuition:
Machine Learning with Tree-Based Models in R
Sandro Raabe
Data Scientist

