More model measures

Machine Learning with Tree-Based Models in R

Sandro Raabe

Data Scientist

Limits of accuracy


  • "Naive" model always predicting no can have 98% accuracy

$\rightarrow$ Possible in imbalanced dataset with 98% of negative samples

Machine Learning with Tree-Based Models in R

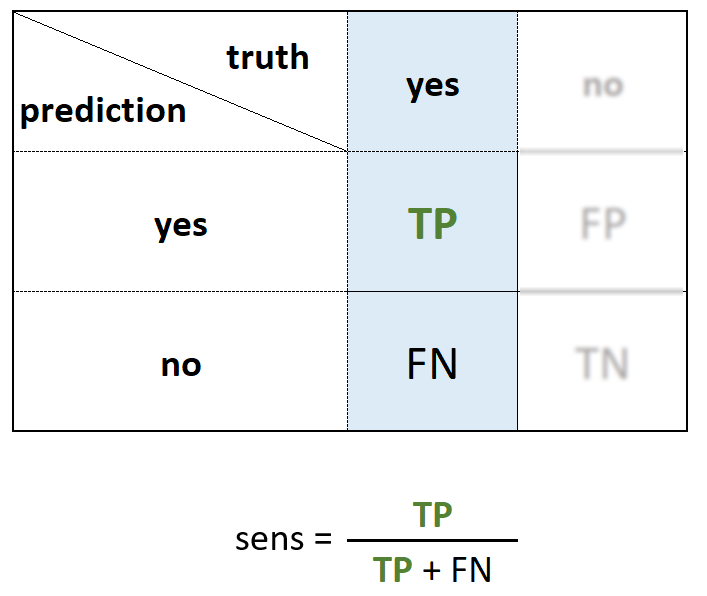
Sensitivity or true positive rate

  • Proportion of all positive outcomes that were correctly classified

confusion matrix showing sensitivity

Machine Learning with Tree-Based Models in R

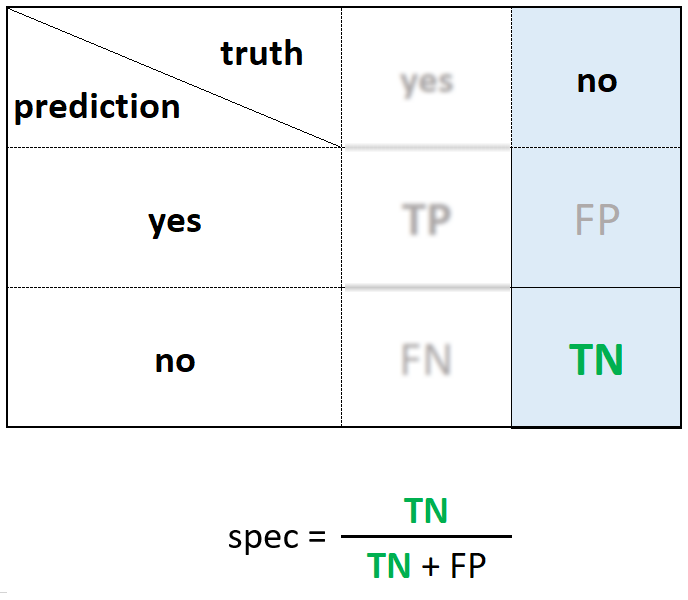
Specificity or true negative rate

  • Proportion of all negative outcomes that were correctly classified

confusion matrix showing true negative rate

Machine Learning with Tree-Based Models in R

table showing different thresholds

Machine Learning with Tree-Based Models in R

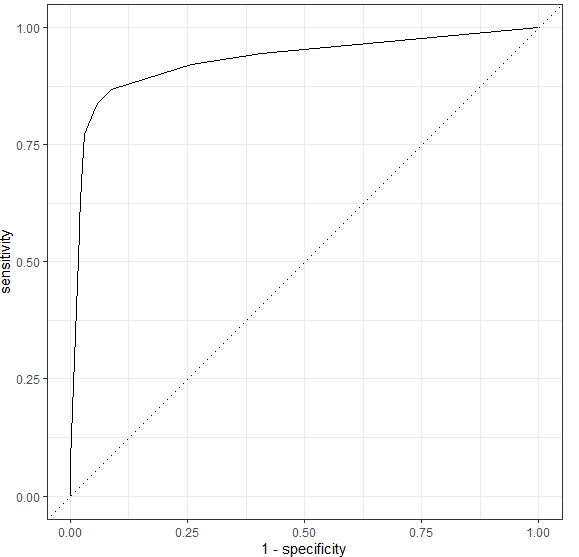
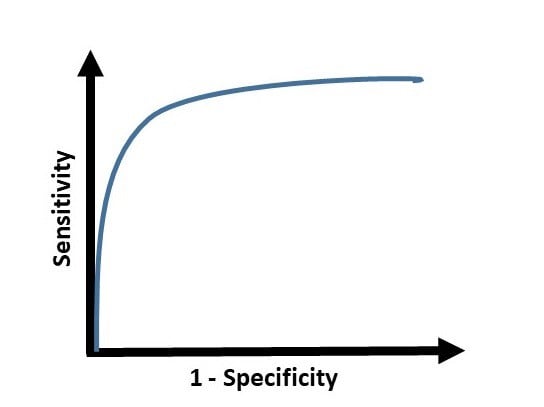
ROC (Receiver-operating-characteristic) curve

  • Visualizes the performance of a classification model across all possible thresholds

ROC curve plot

Machine Learning with Tree-Based Models in R

ROC curve and AUC

different ROC curves

Machine Learning with Tree-Based Models in R

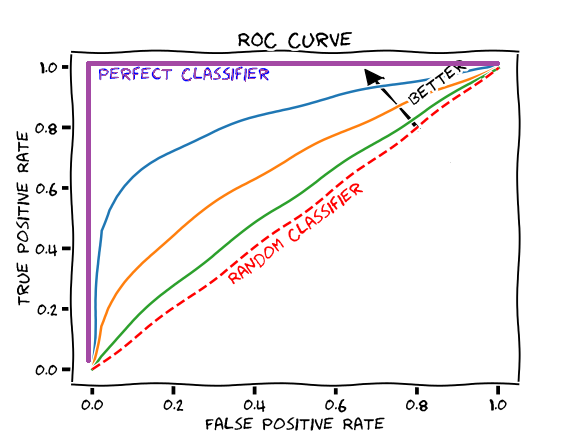
Area under the ROC curve

AUC plot

  • AUC = 0.5
  • Performance not better than random chance


  • AUC = 1
  • All examples correctly classified for every threshold $\rightarrow$ perfect model


  • AUC = 0
  • Every example incorrectly classified
Machine Learning with Tree-Based Models in R

yardstick sensitivity: sens()

predictions
# A tibble: 153 x 2
.pred_class   true_class
      <fct>        <fct>     
 1      yes           no        
 2       no           no        
 3       no          yes       
 4      yes          yes
# Calculate single-threshold sensitivity
sens(predictions, 
     estimate = .pred_class, 
     truth = true_class)
# A tibble: 1 x 2
  .metric        .estimate
  <chr>              <dbl>
1 sensitivity        0.872
  • Similar arguments as accuracy() and conf_mat()
Machine Learning with Tree-Based Models in R

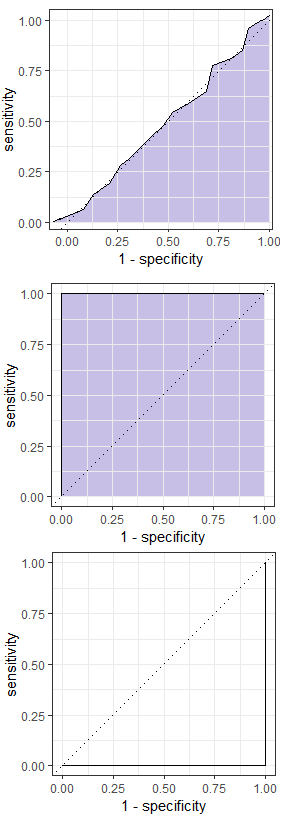
yardstick ROC: roc_curve()

# Predict probabilities on test set
predictions <- predict(model,
                       data_test,

type = "prob") %>%
bind_cols(data_test)
# A tibble: 9,116 x 13
   .pred_yes still_customer age gender    ...
       <dbl> <fct>         <int> <fct>    ...
 1    0.0557 no               45 M        ...
 2    0.0625 no               49 F        ...
 3    0.330  no               51 M        ...
 4    ...
 ...
# Calculate the ROC curve for all thresholds
roc <- roc_curve(predictions,

estimate = .pred_yes,
truth = still_customer)
# Plot the ROC curve autoplot(roc)

roc curve

Machine Learning with Tree-Based Models in R

yardstick AUC: roc_auc()

  • Same arguments: data, prediction column, truth column
# Calculate area under curve
roc_auc(predictions, 
        estimate = .pred_yes, 
        truth = still_customer)
# A tibble: 1 x 3
  .metric .estimator .estimate
  <chr>   <chr>          <dbl>
1 roc_auc binary         0.872
Machine Learning with Tree-Based Models in R

Let's measure!

Machine Learning with Tree-Based Models in R

Preparing Video For Download...