Model comparison
Machine Learning with Tree-Based Models in R

Sandro Raabe
Data Scientist
Motivation
Compare AUC
# A tibble: 4 x 3
  model            .metric   .estimate
1 decision_tree    roc_auc       <?>
2 bagged_trees     roc_auc       <?>
3 random_forest    roc_auc       <?>
4 boosted_trees    roc_auc       <?>
Compare ROC curves
Combine predictions
bind_cols(decision_tree
                                                   )
# A tibble: 1,011 x 1
   preds_tree
        <dbl>
 1      0.144
 2      0.441
 3      0.144
 4      0.776
 5      0.441
 6      0.144
 7      0.144
 8      0.441
# ... with 1,003 more rows
Combine predictions
bind_cols(decision_tree, bagged_trees
                                                   )
# A tibble: 1,011 x 2
   preds_tree preds_bagging
        <dbl>         <dbl>
 1      0.144         0.115
 2      0.441         0.326
 3      0.144         0.115
 4      0.776         0.773
 5      0.441         0.326
 6      0.144         0.115
 7      0.144         0.115
 8      0.441         0.877
# ... with 1,003 more rows
Combine predictions
bind_cols(decision_tree, bagged_trees, random_forest
                                                   )
# A tibble: 1,011 x 3
   preds_tree preds_bagging preds_forest
        <dbl>         <dbl>        <dbl>
 1      0.144         0.115        0
 2      0.441         0.326        0
 3      0.144         0.115        0
 4      0.776         0.773        0.286
 5      0.441         0.326        0.15
 6      0.144         0.115        0
 7      0.144         0.115        0
 8      0.441         0.877        0.7
# ... with 1,003 more rows
Combine predictions
bind_cols(decision_tree, bagged_trees, random_forest, boosted_trees
                                                   )
# A tibble: 1,011 x 4
   preds_tree preds_bagging preds_forest preds_boosting
        <dbl>         <dbl>        <dbl>          <dbl>
 1      0.144         0.115        0              0.136
 2      0.441         0.326        0              0.149
 3      0.144         0.115        0              0.116
 4      0.776         0.773        0.286          0.319
 5      0.441         0.326        0.15           0.199
 6      0.144         0.115        0              0.116
 7      0.144         0.115        0              0.116
 8      0.441         0.877        0.7            0.823
# ... with 1,003 more rows
Combine predictions
bind_cols(decision_tree, bagged_trees, random_forest, boosted_trees,
          customers_test %>% select(still_customer))
# A tibble: 1,011 x 5
   preds_tree preds_bagging preds_forest preds_boosting still_customer
        <dbl>         <dbl>        <dbl>          <dbl>          <fct>
 1      0.144         0.115        0              0.136             no
 2      0.441         0.326        0              0.149             no
 3      0.144         0.115        0              0.116             no
 4      0.776         0.773        0.286          0.319            yes
 5      0.441         0.326        0.15           0.199             no
 6      0.144         0.115        0              0.116             no
 7      0.144         0.115        0              0.116             no
 8      0.441         0.877        0.7            0.823            yes
# ... with 1,003 more rows
Calculate decision tree AUC
# Calculate the AUC measure
roc_auc(preds_combined, truth = still_customer, estimate = preds_tree)
# A tibble: 1 x 2
  .metric   .estimate
  <chr>         <dbl>
1 roc_auc       0.911
Calculate bagged tree AUC
# Calculate the AUC measure
roc_auc(preds_combined, truth = still_customer, estimate = preds_bagging)
# A tibble: 1 x 2
  .metric   .estimate
  <chr>         <dbl>
1 roc_auc       0.936
Calculate random forest AUC
# Calculate the AUC measure
roc_auc(preds_combined, truth = still_customer, estimate = preds_forest)
# A tibble: 1 x 2
  .metric   .estimate
  <chr>         <dbl>
1 roc_auc       0.974
Calculate boosted AUC
# Calculate the AUC measure
roc_auc(preds_combined, truth = still_customer, estimate = preds_boosting)
# A tibble: 1 x 2
  .metric   .estimate
  <chr>         <dbl>
1 roc_auc       0.984
Combine all AUCs
# Combine AUCs
bind_rows(roc_auc(preds_combined, truth = still_customer, estimate = preds_tree),
          roc_auc(preds_combined, truth = still_customer, estimate = preds_bagging),
          roc_auc(preds_combined, truth = still_customer, estimate = preds_forest),
          roc_auc(preds_combined, truth = still_customer, estimate = preds_boosting))
# A tibble: 4 x 2
  .metric .estimate
  <chr>       <dbl>
1 roc_auc     0.911
2 roc_auc     0.936
3 roc_auc     0.974
4 roc_auc     0.984
Combine all AUCs
# Combine AUCs
bind_rows(decision_tree = roc_auc(preds_combined, truth = still_customer, preds_tree),
          bagged_trees  = roc_auc(preds_combined, truth = still_customer, preds_bagging),
          random_forest = roc_auc(preds_combined, truth = still_customer, preds_forest),
          boosted_trees = roc_auc(preds_combined, truth = still_customer, preds_boosting),
          .id = "model")
# A tibble: 4 x 3
  model            .metric   .estimate
  <chr>            <chr>         <dbl>
1 decision_tree    roc_auc       0.911
2 bagged_trees     roc_auc       0.936
3 random_forest    roc_auc       0.974
4 boosted_trees    roc_auc       0.984
Reformat the results
# Reshape the predictions into long format predictions_long <- tidyr::pivot_longer(preds_combined,cols = starts_with("preds_"),names_to = "model",values_to = "predictions")
# A tibble: 4,044 x 3
   still_customer   model          predictions
   <fct>            <chr>                <dbl>
 1 no               preds_tree          0.144
 2 no               preds_bagging       0.102
 3 no               preds_forest        0.0333
 4 no               preds_boosting      0.169
 5 yes              preds_tree          0.441
 6 no               preds_bagging       0.285
 7 no               preds_forest        0.36
 8 no               preds_boosting      0.184
# ... with 4,036 more rows
Calculate cutoff values
# Group by model cutoffs <- predictions_long %>% group_by(model) %>%# Calculate values for every cutoff roc_curve(truth = still_customer, estimate = predictions)
# A tibble: 668 x 4
# Groups:   model [4]
model         .threshold specificity sensitivity
   <chr>              <dbl>       <dbl>       <dbl>
 1 preds_bagging       -Inf       0           1
 2 preds_bagging     0.0157       0           1
 3 preds_bagging     0.0202       0.536       0.975
 4 preds_bagging     0.0254       0.537       0.975
 5 preds_bagging     0.0271       0.665       0.938
 6 preds_bagging     0.0315       0.681       0.938
 # ... with 662 more rows
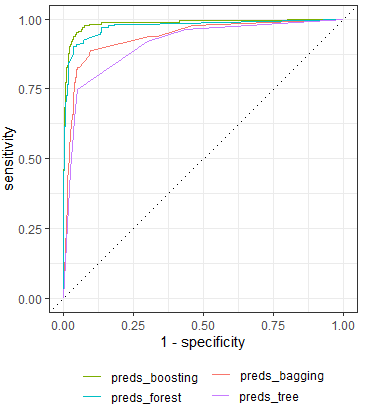
Plot ROC curves
# Convert to plot
autoplot(cutoffs)
Let's compare!
Machine Learning with Tree-Based Models in R

