Box plots and distribution characteristics
Statistical Techniques in Tableau

Maarten Van den Broeck
Content Developer at DataCamp
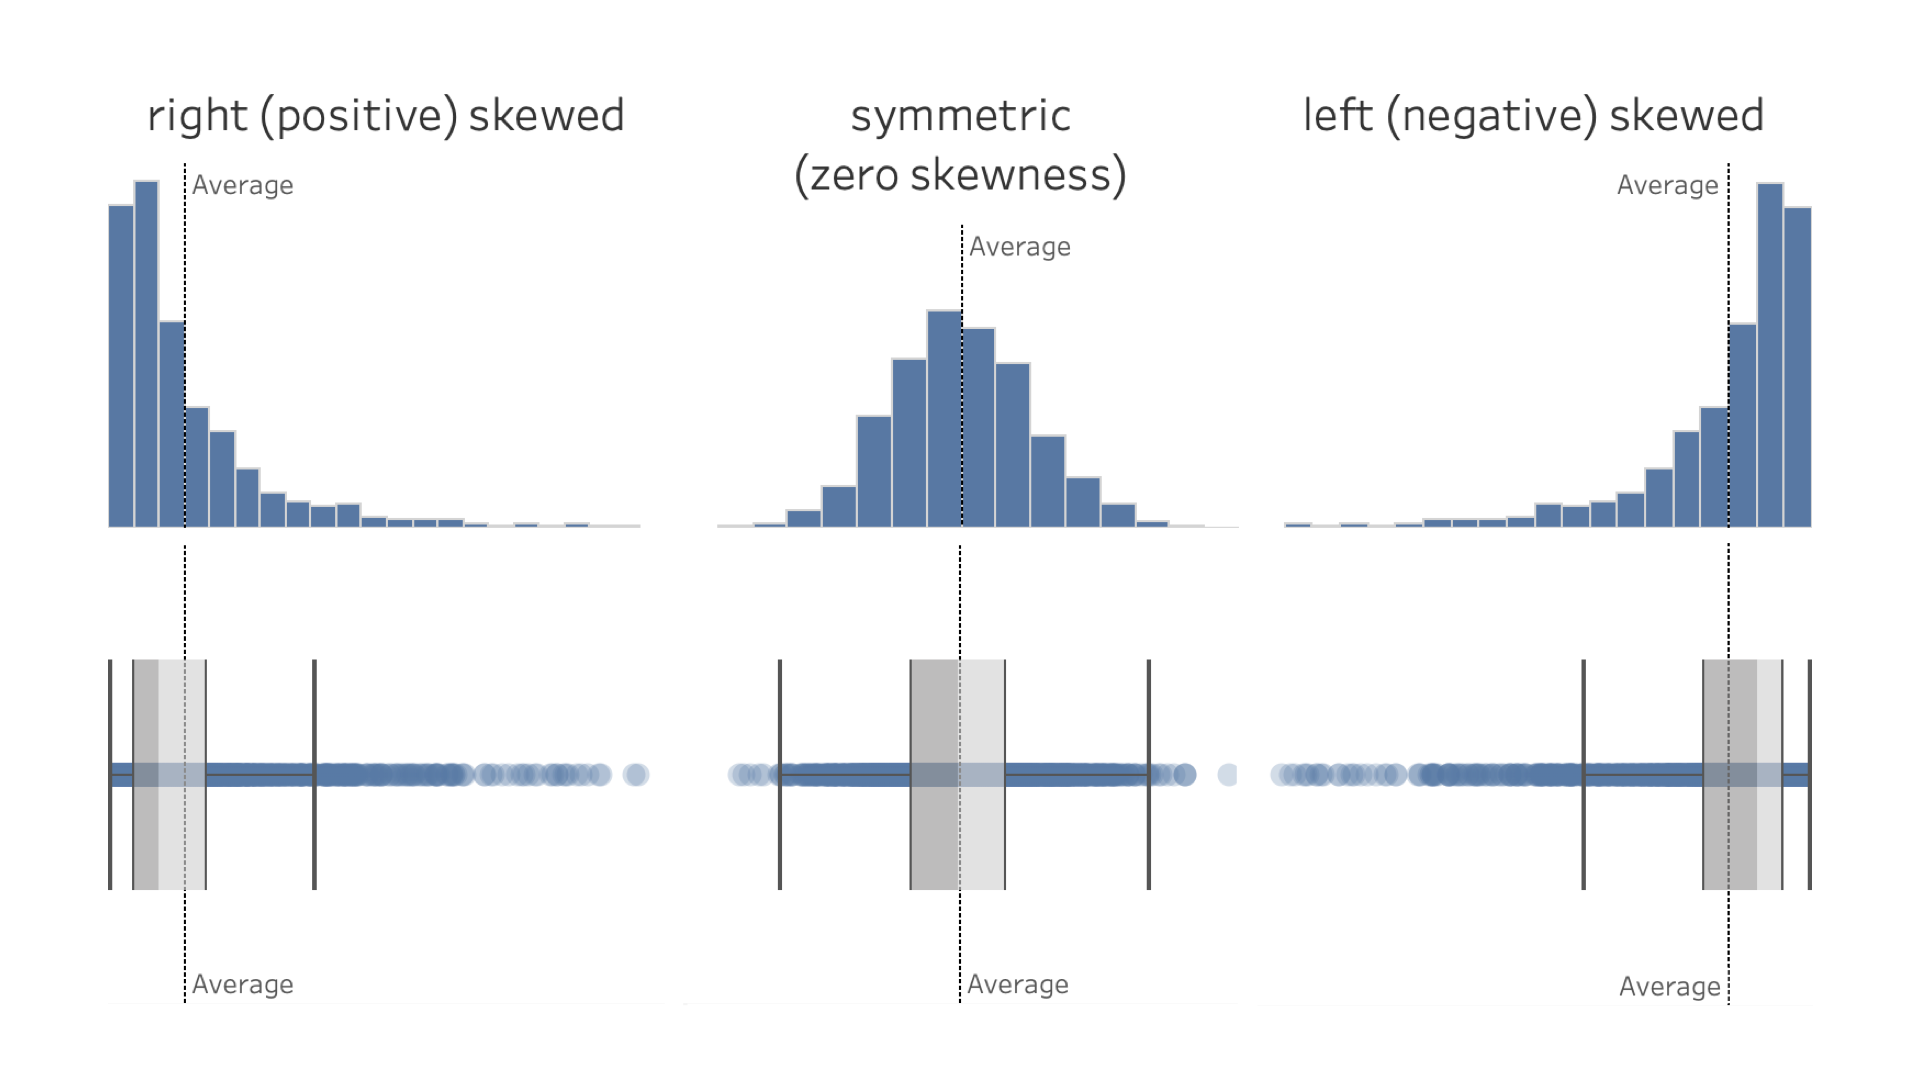
Box plots
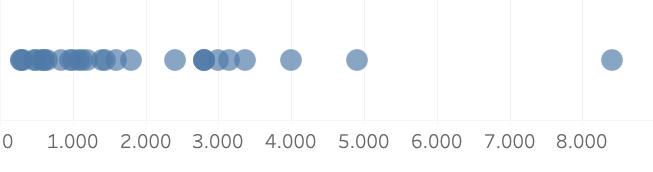
Visualize the distribution of a single, continuous variable
Box plots
Visualize the distribution of a single, continuous variable
Box plots
Visualize the distribution of a single, continuous variable
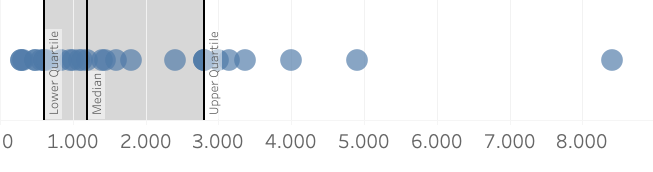
- Distance between lower quartile and upper quartile is the interquartile range (IQR)
Box plots
Visualize the distribution of a single, continuous variable
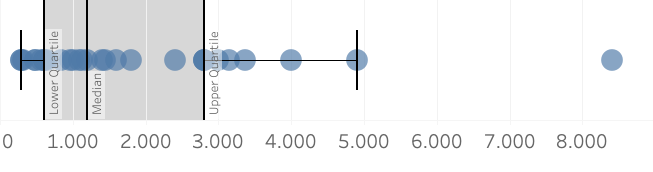
- Distance between lower quartile and upper quartile is the interquartile range (IQR)
- Whiskers: length of 1.5 x IQR
- Outlier: extreme value outside whiskers
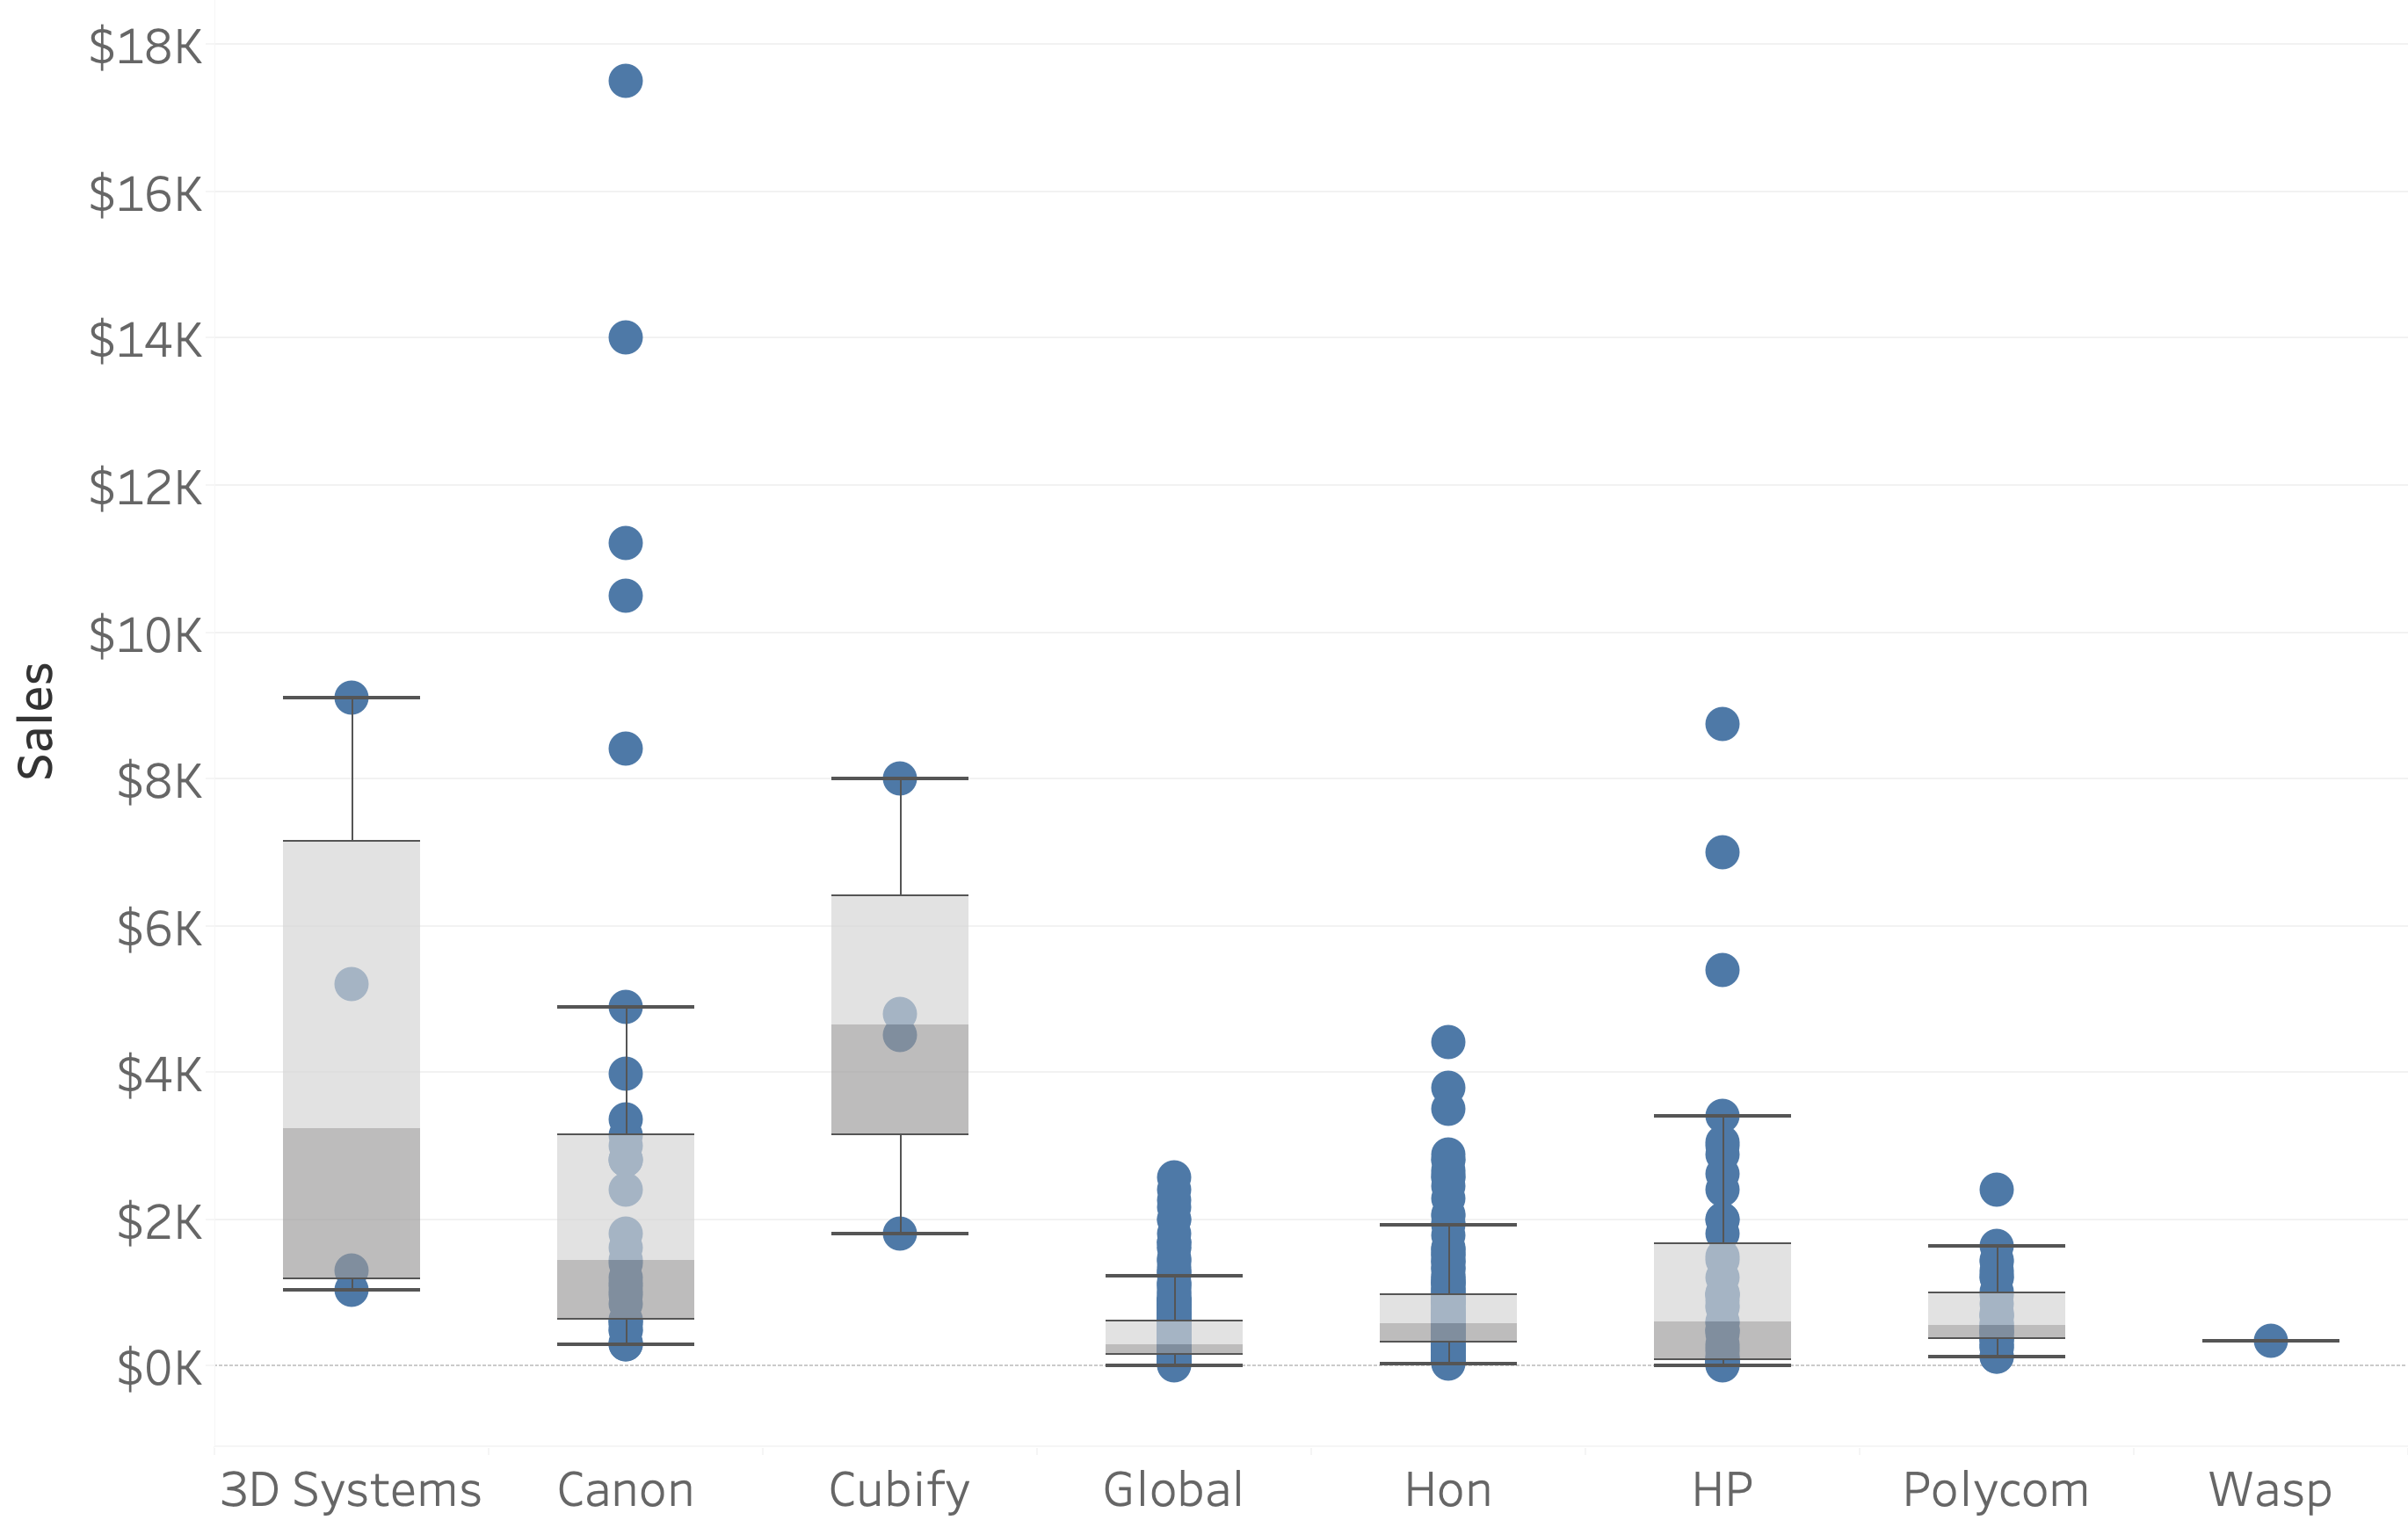
When to use a box plot
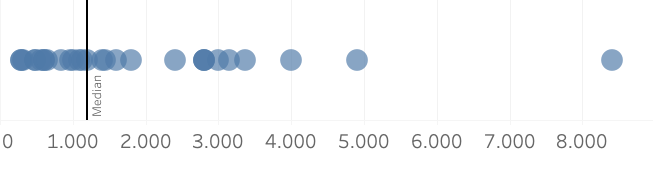
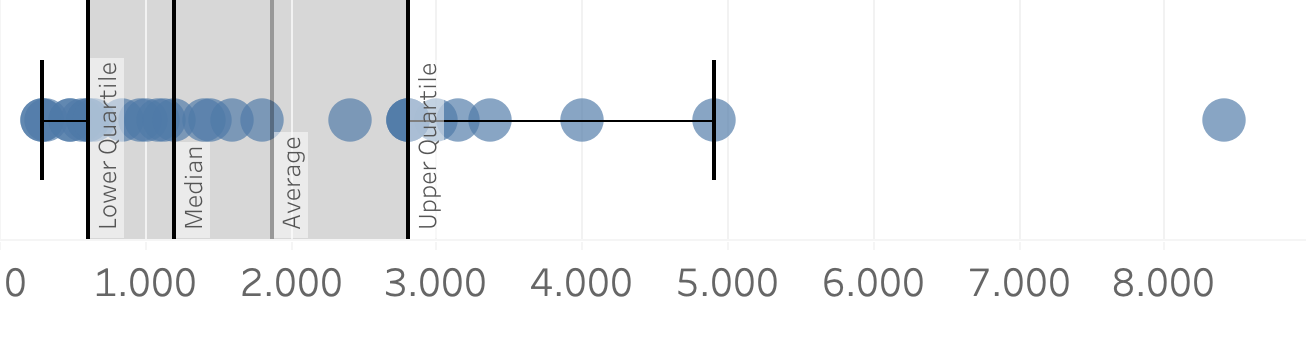
What about the mean?
- Average = arithmetic mean
- $\frac{a_1+a_2+a_3+...+a_n}{n}$
- Average and mean are often used interchangeably
Skewness
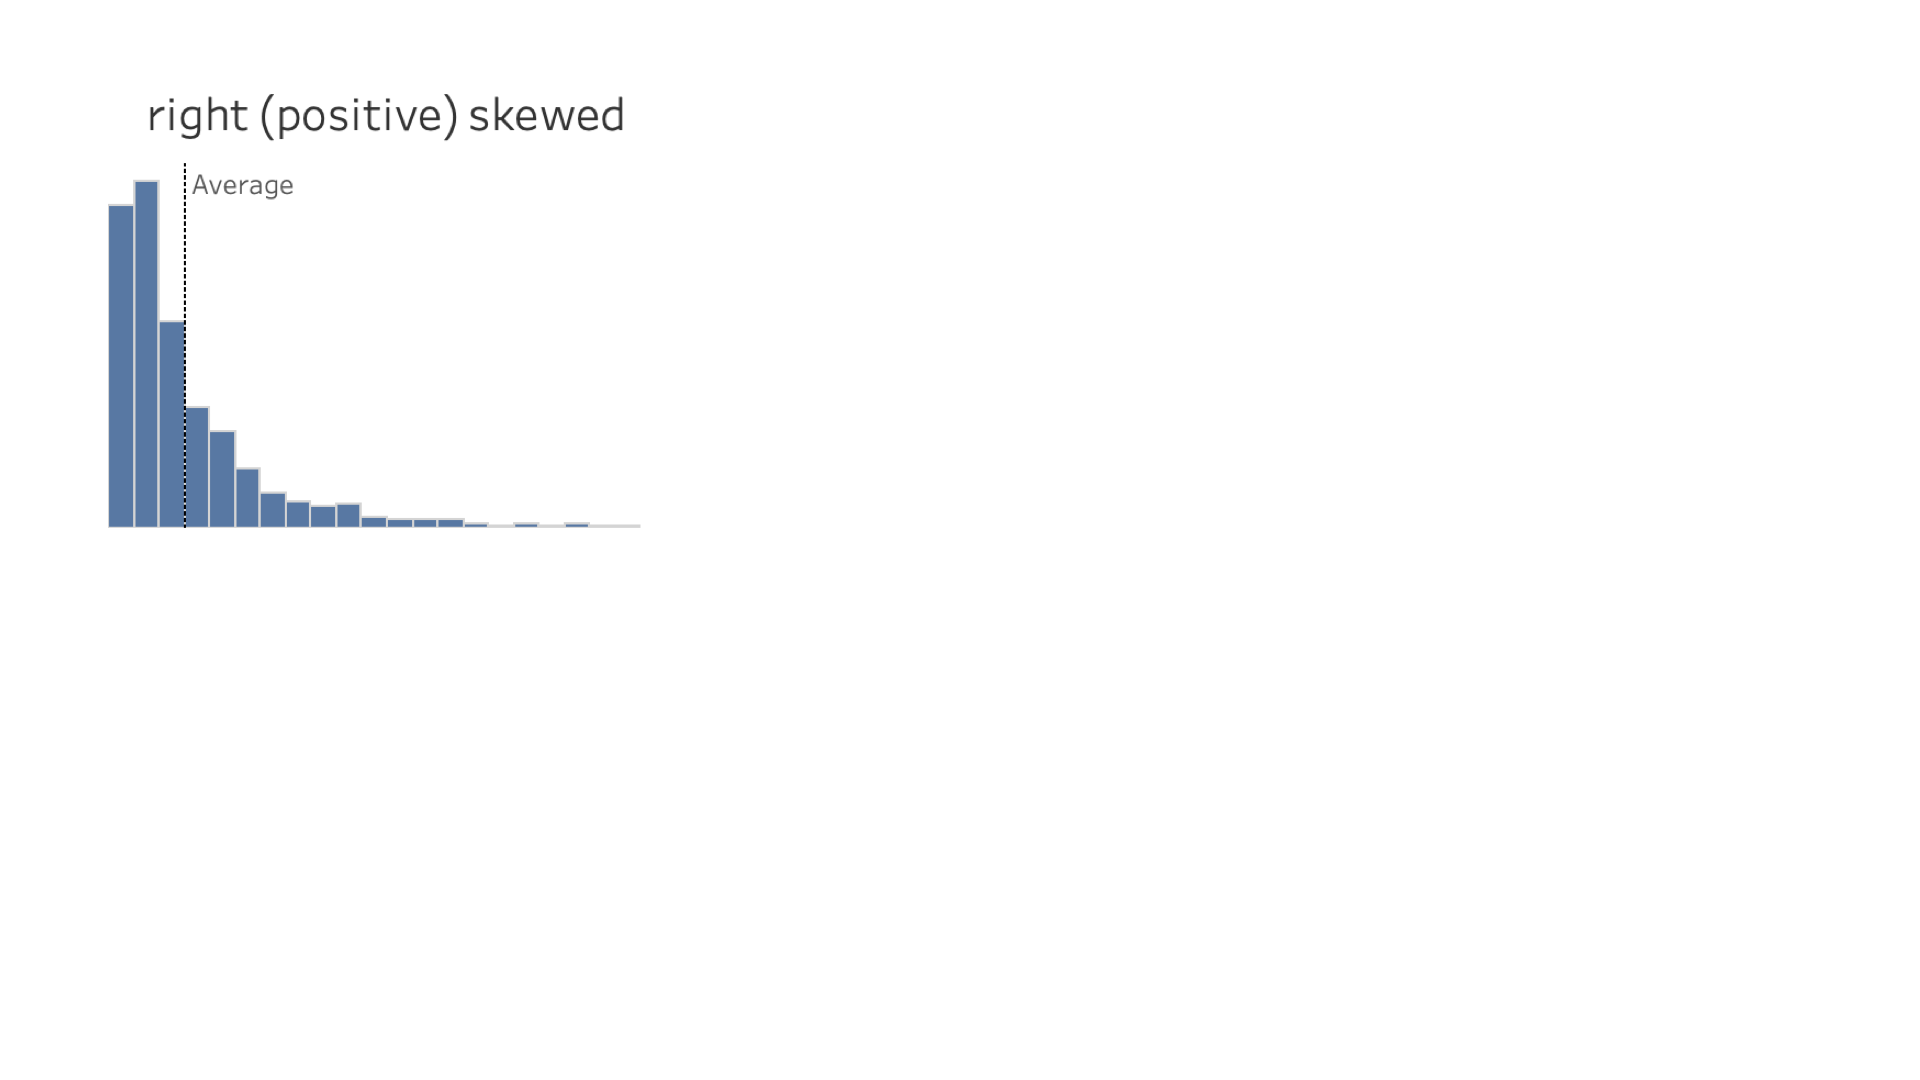
Skewness
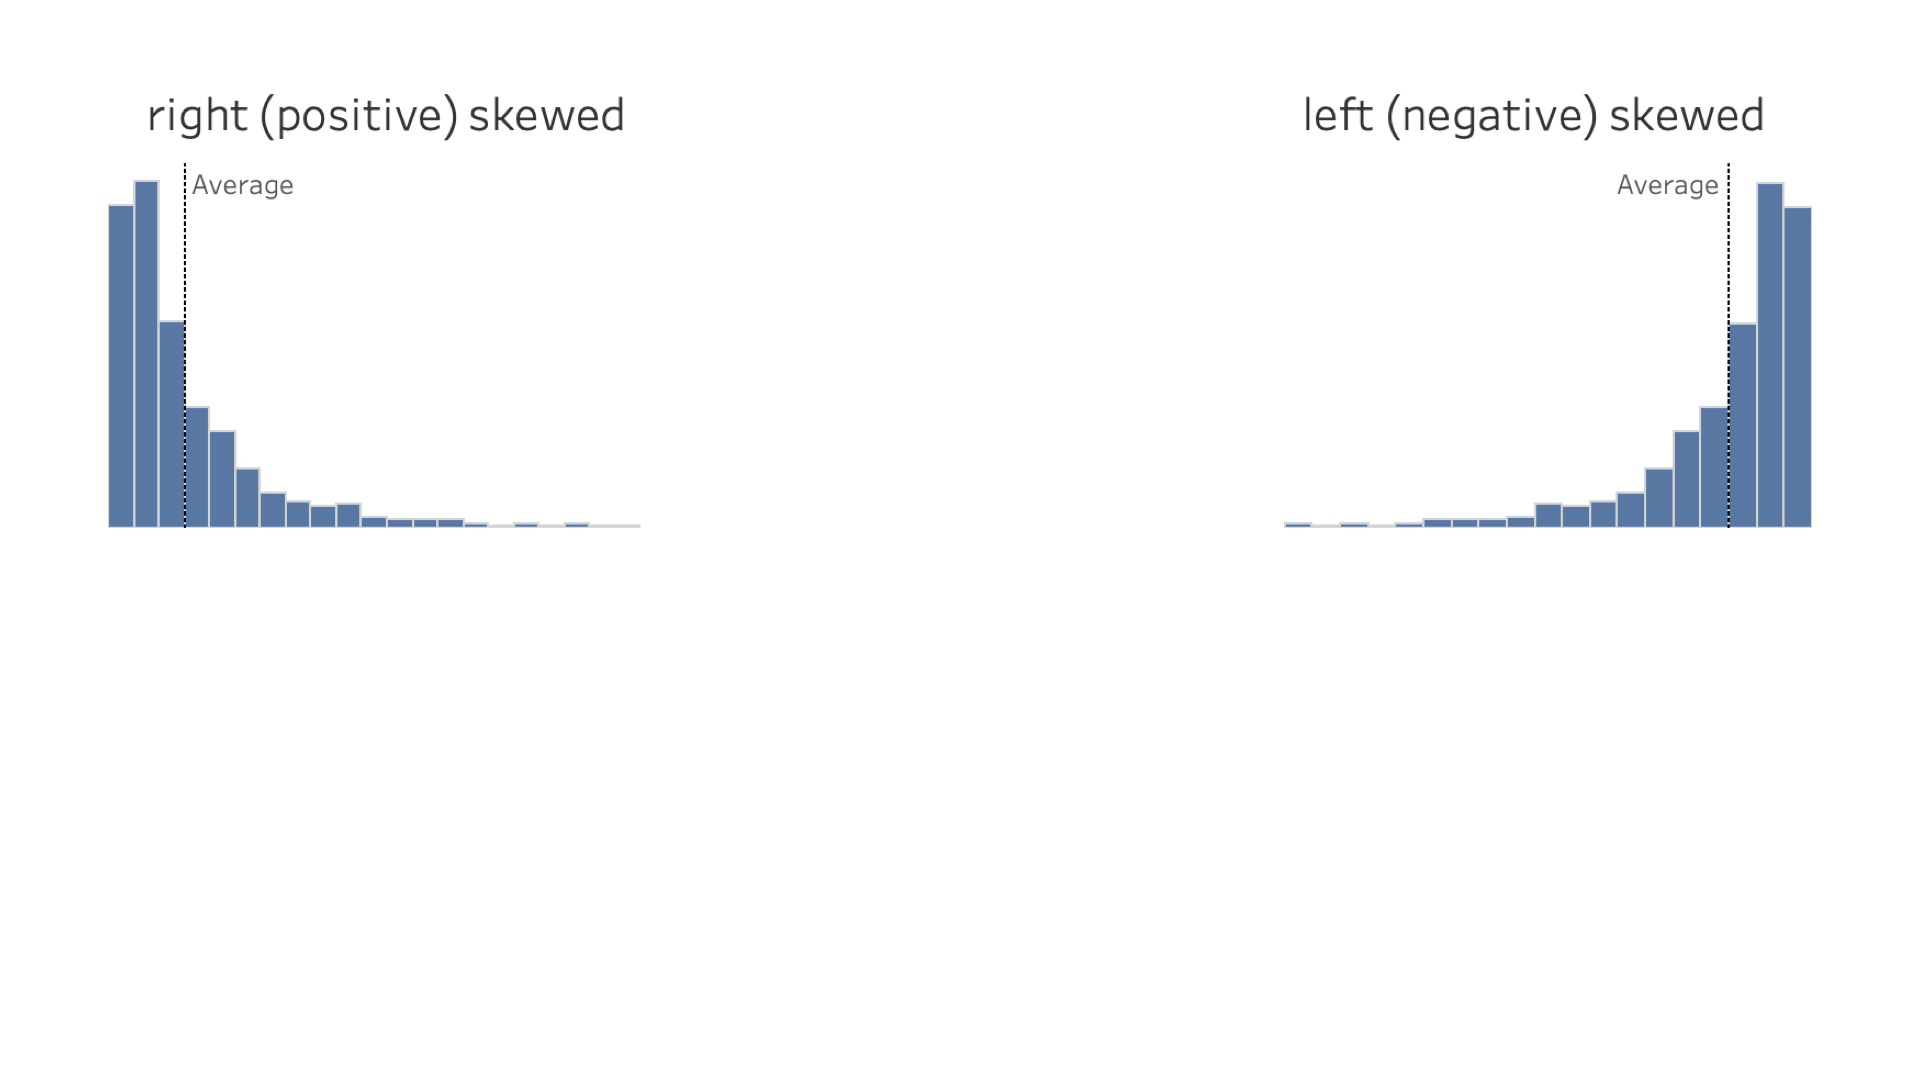
Skewness
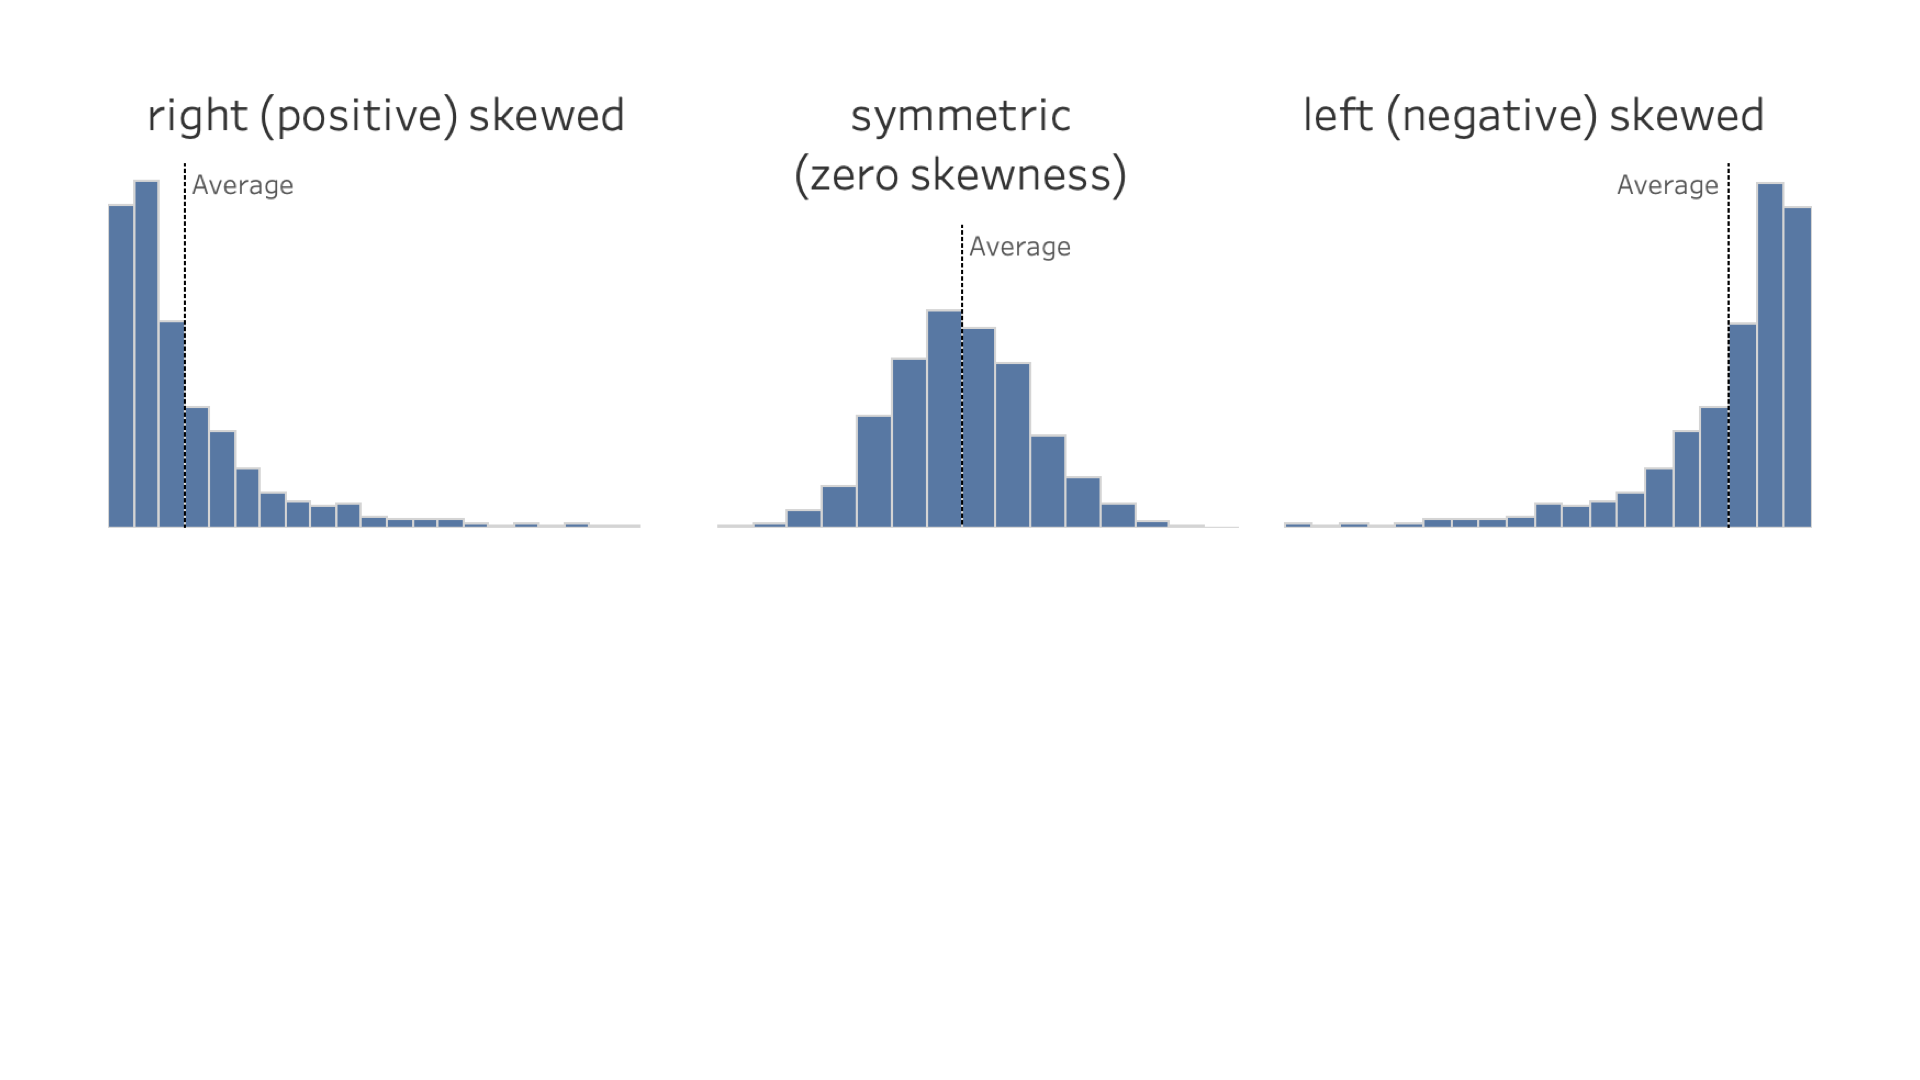
Skewness
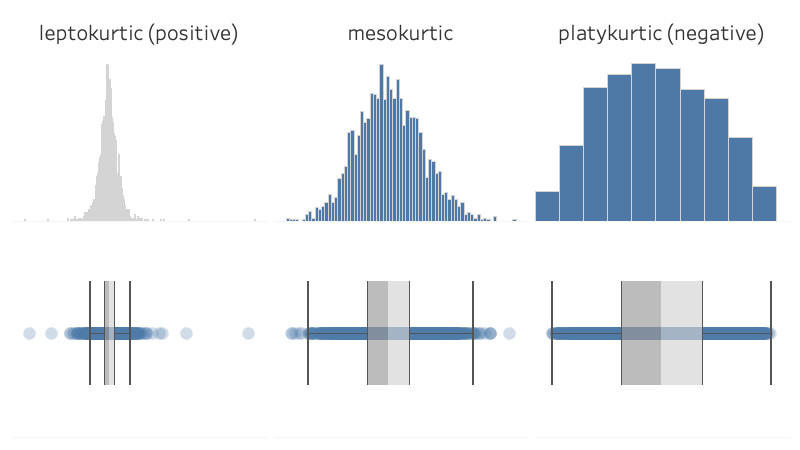
Excess kurtosis