Welcome to the course!
Statistical Techniques in Tableau

Maarten Van den Broeck
Content Developer at DataCamp
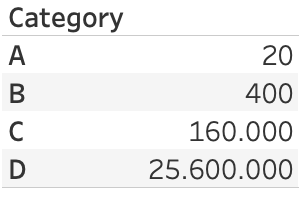
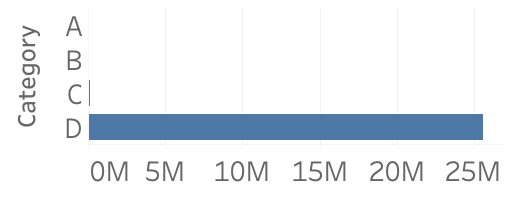
Tables & bar plots
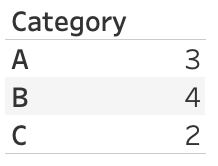
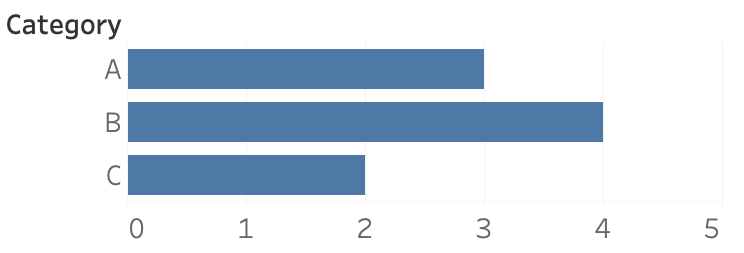
When to use a table vs. a plot
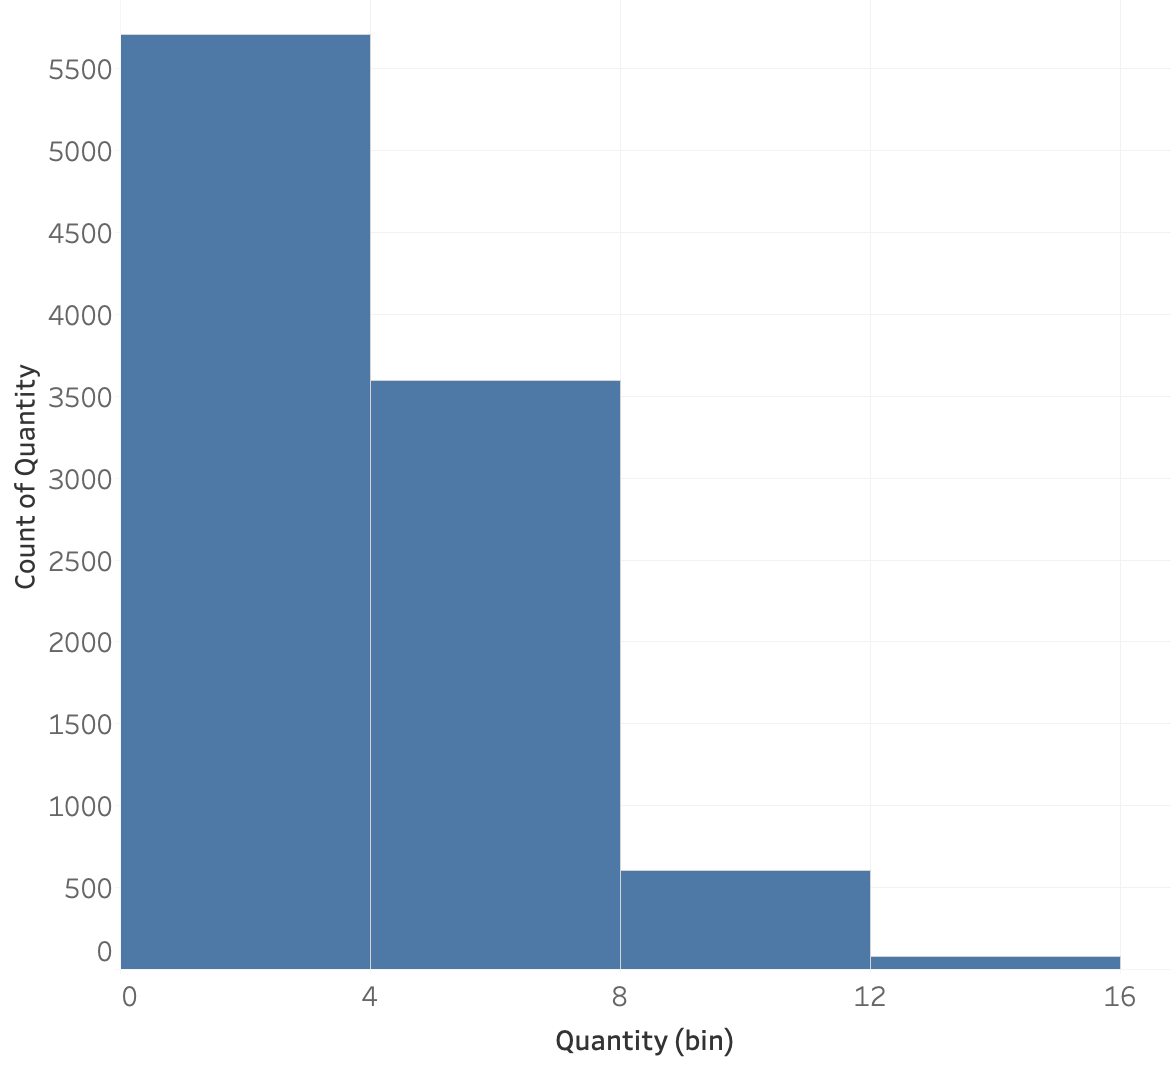
Histograms
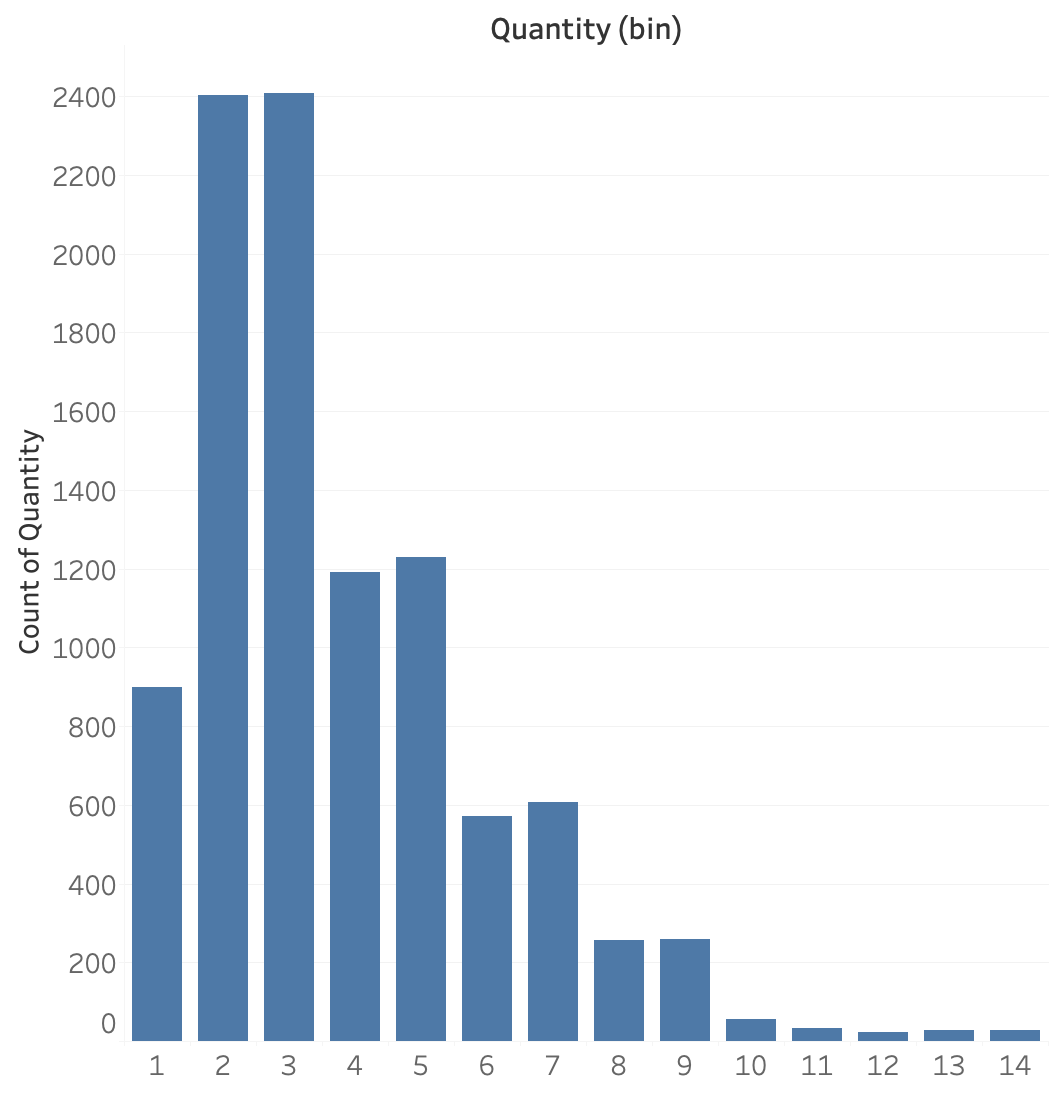
Size of bins
Binwidth = 1.5
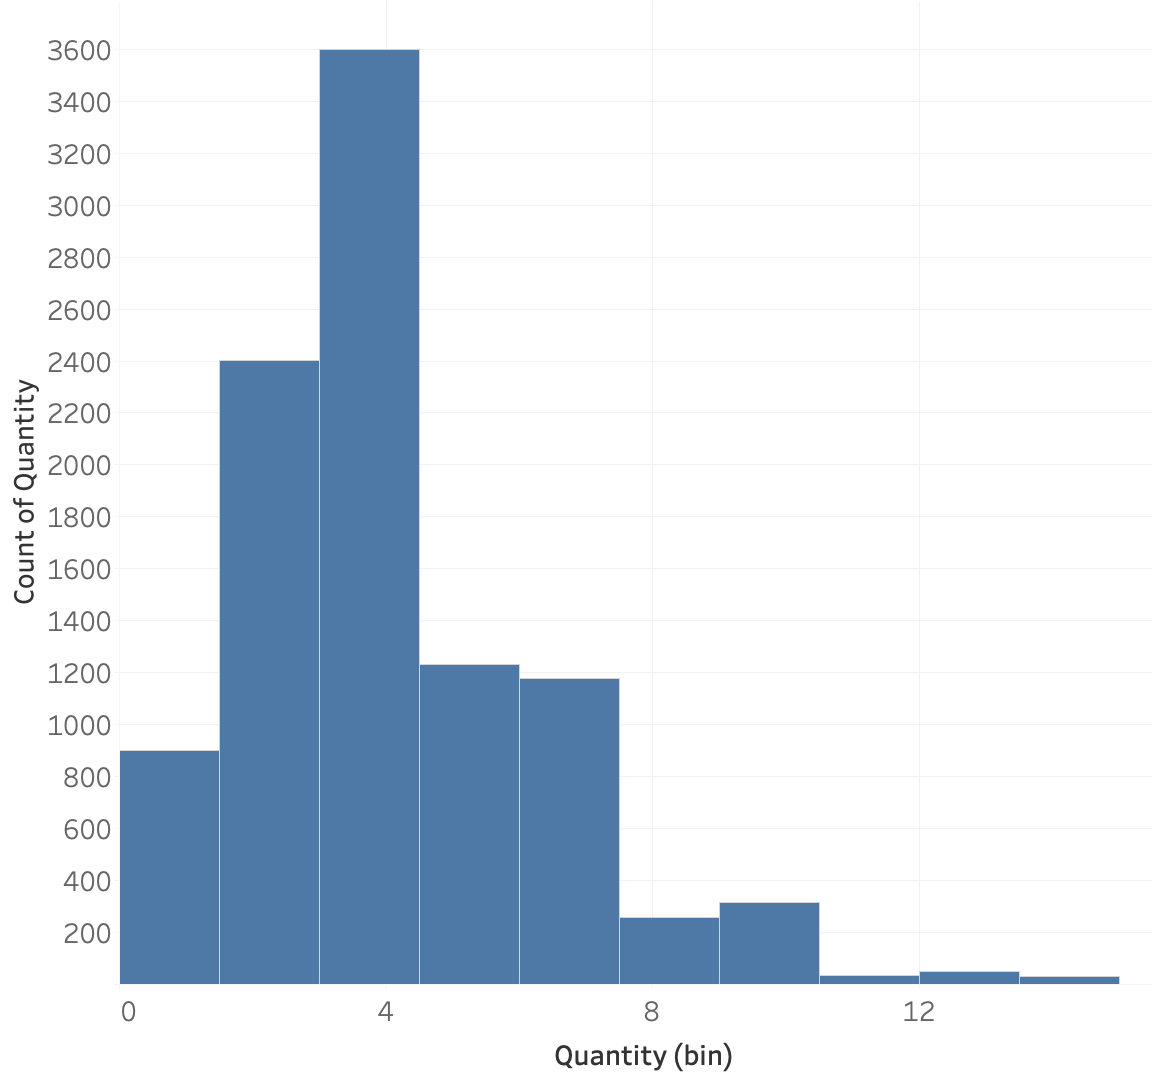
Binwidth = 4
Modality
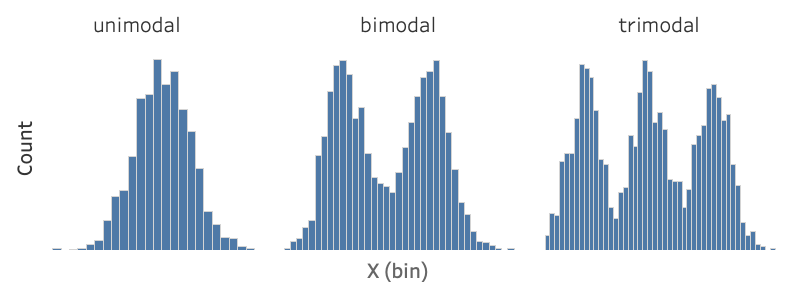
Mode: most occurring value

