Forecasting
Statistical Techniques in Tableau

Maarten Van den Broeck
Content Developer at DataCamp
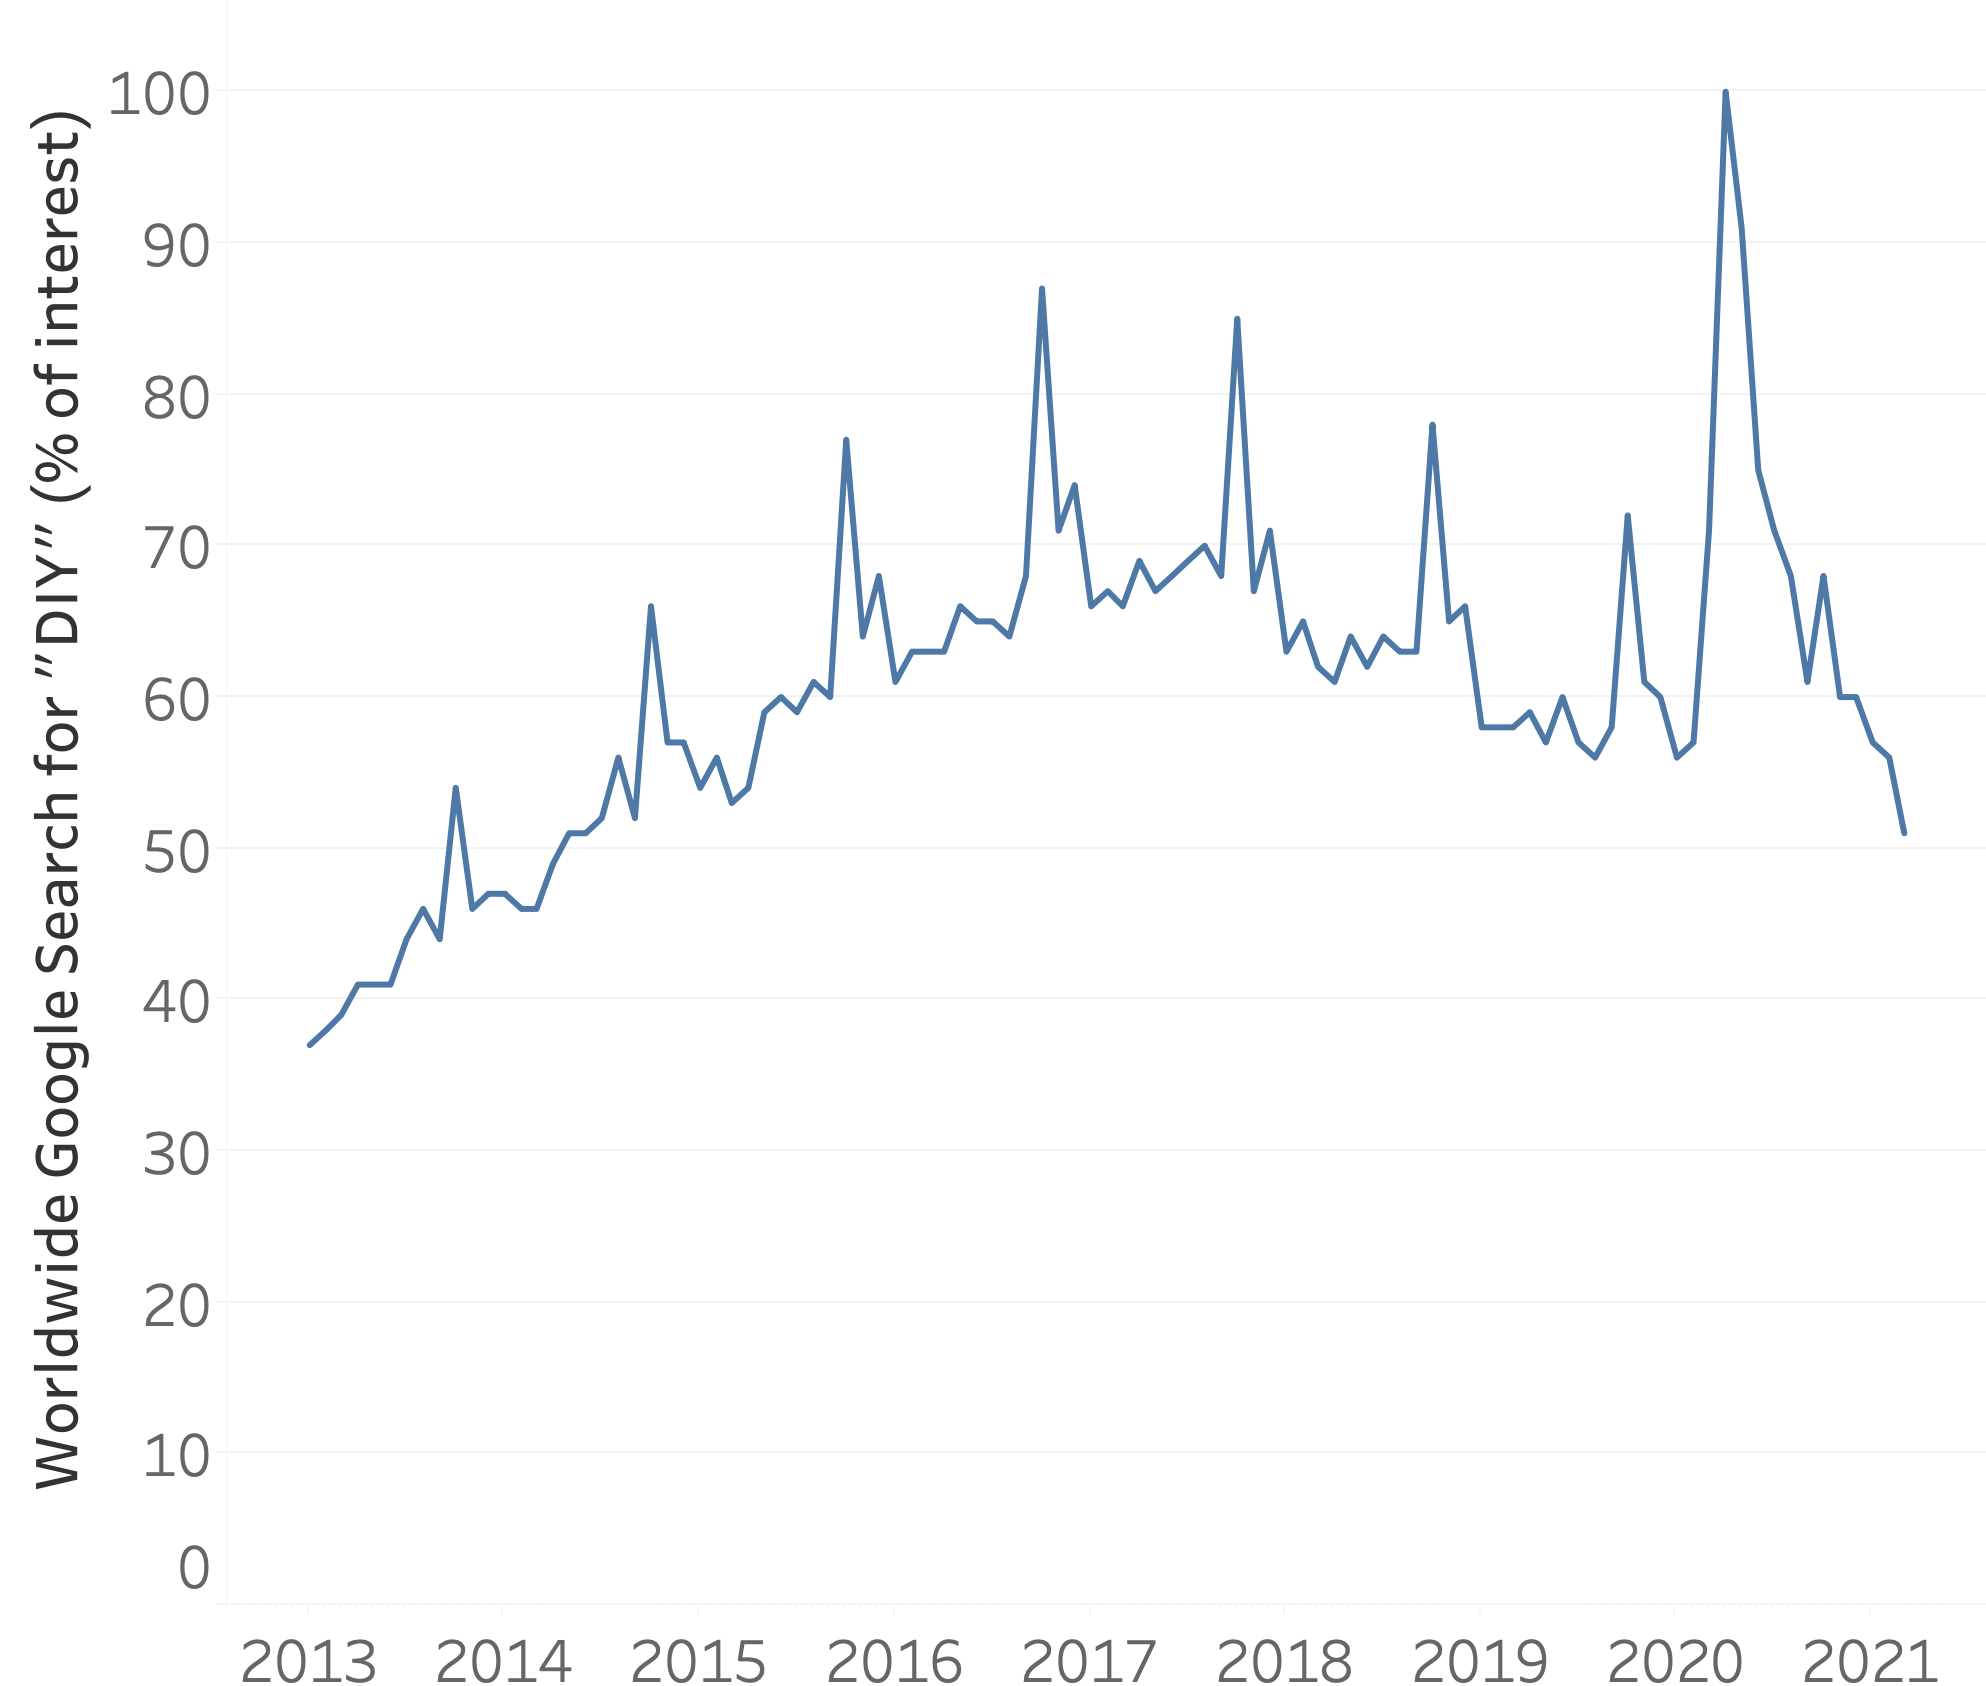
Correlation vs. autocorrelation
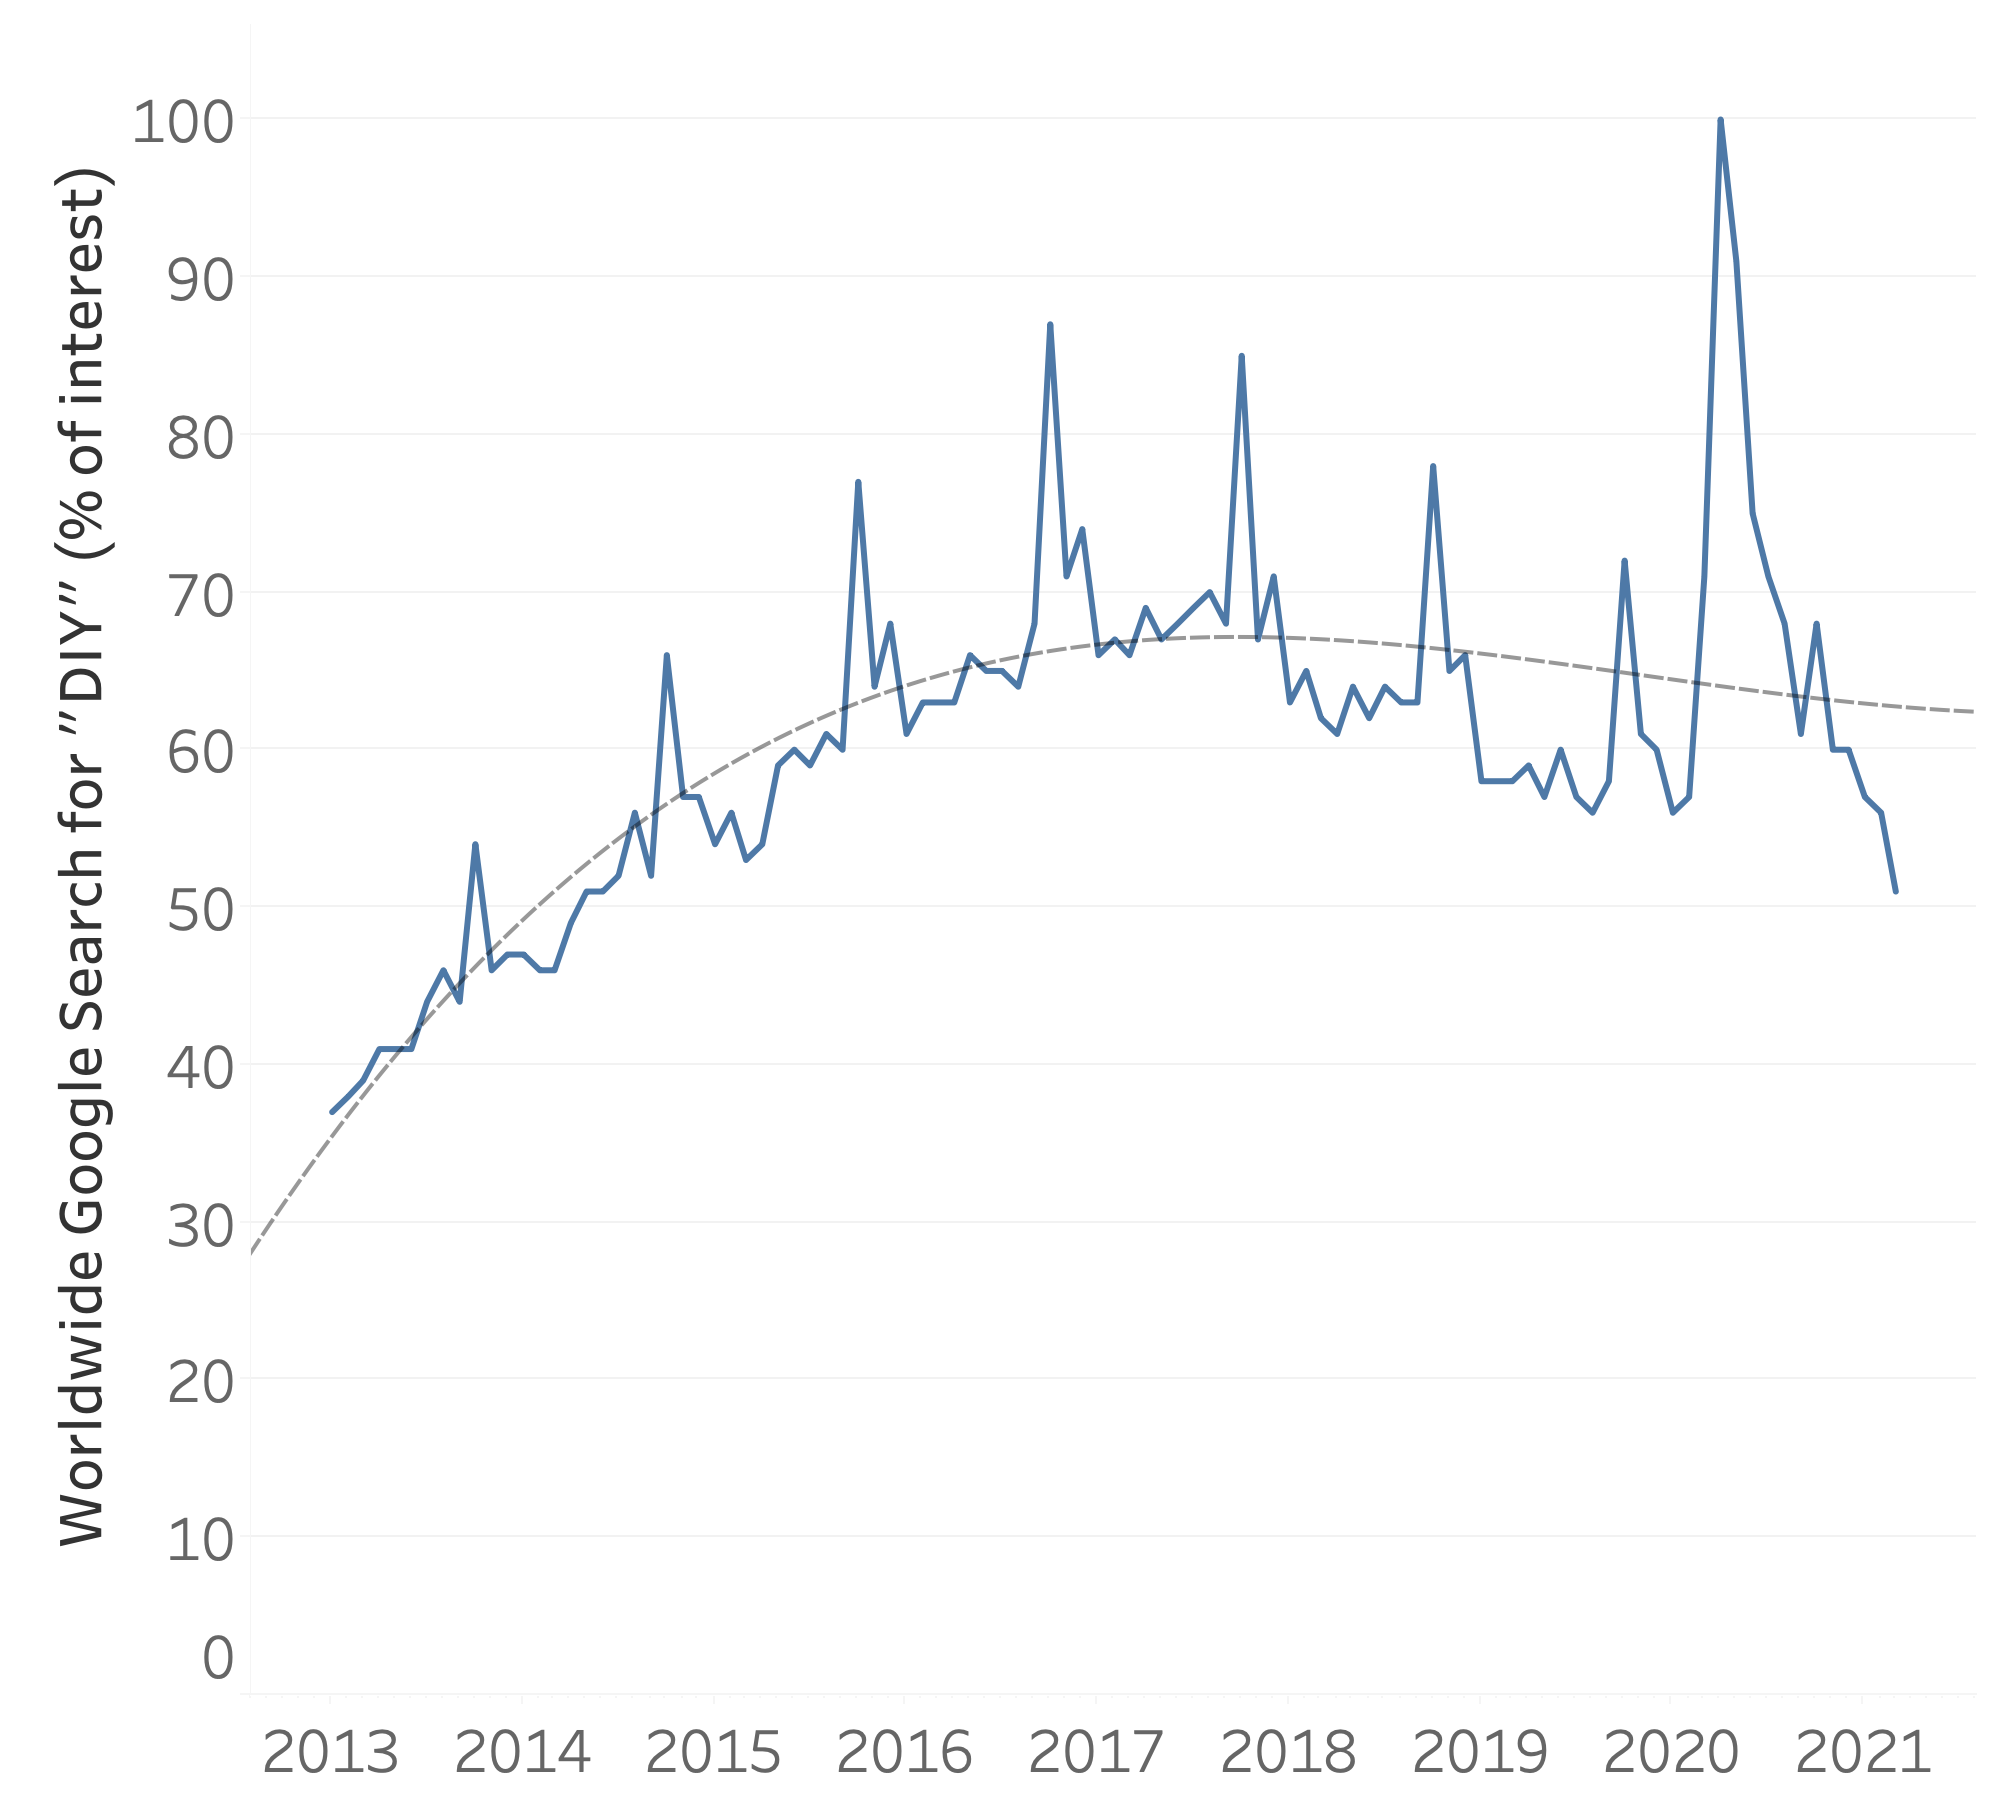
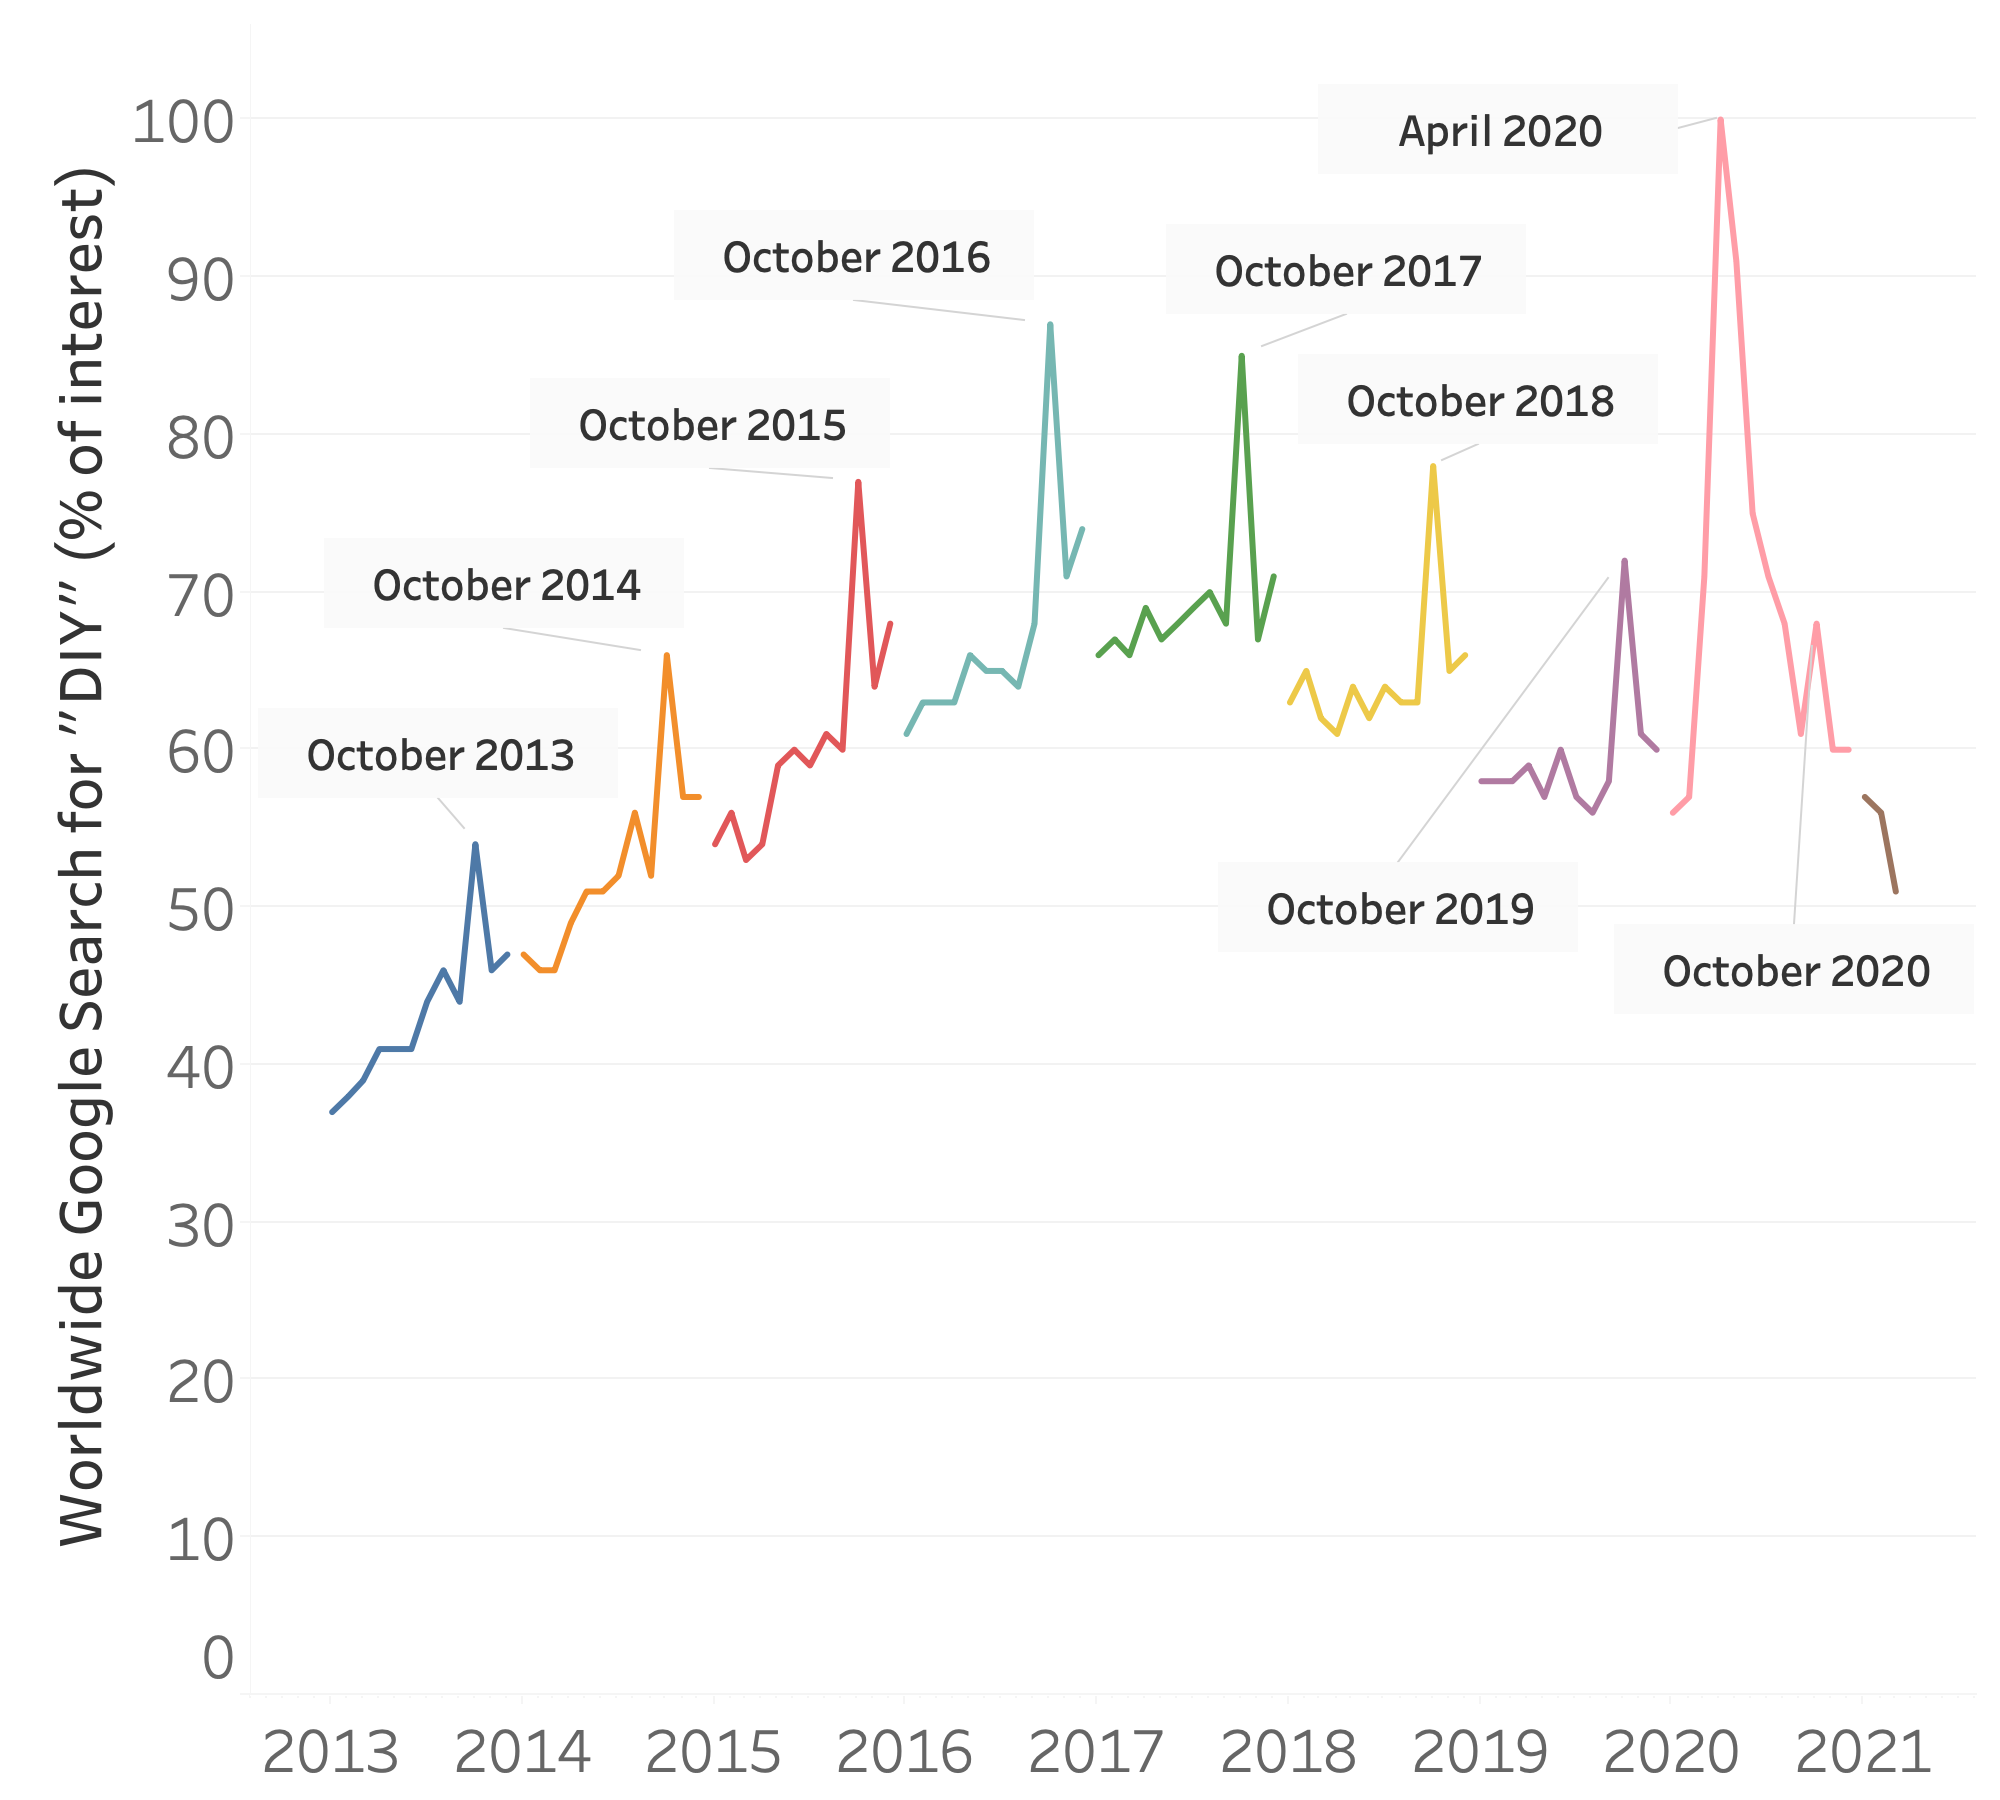
Correlation vs. autocorrelation
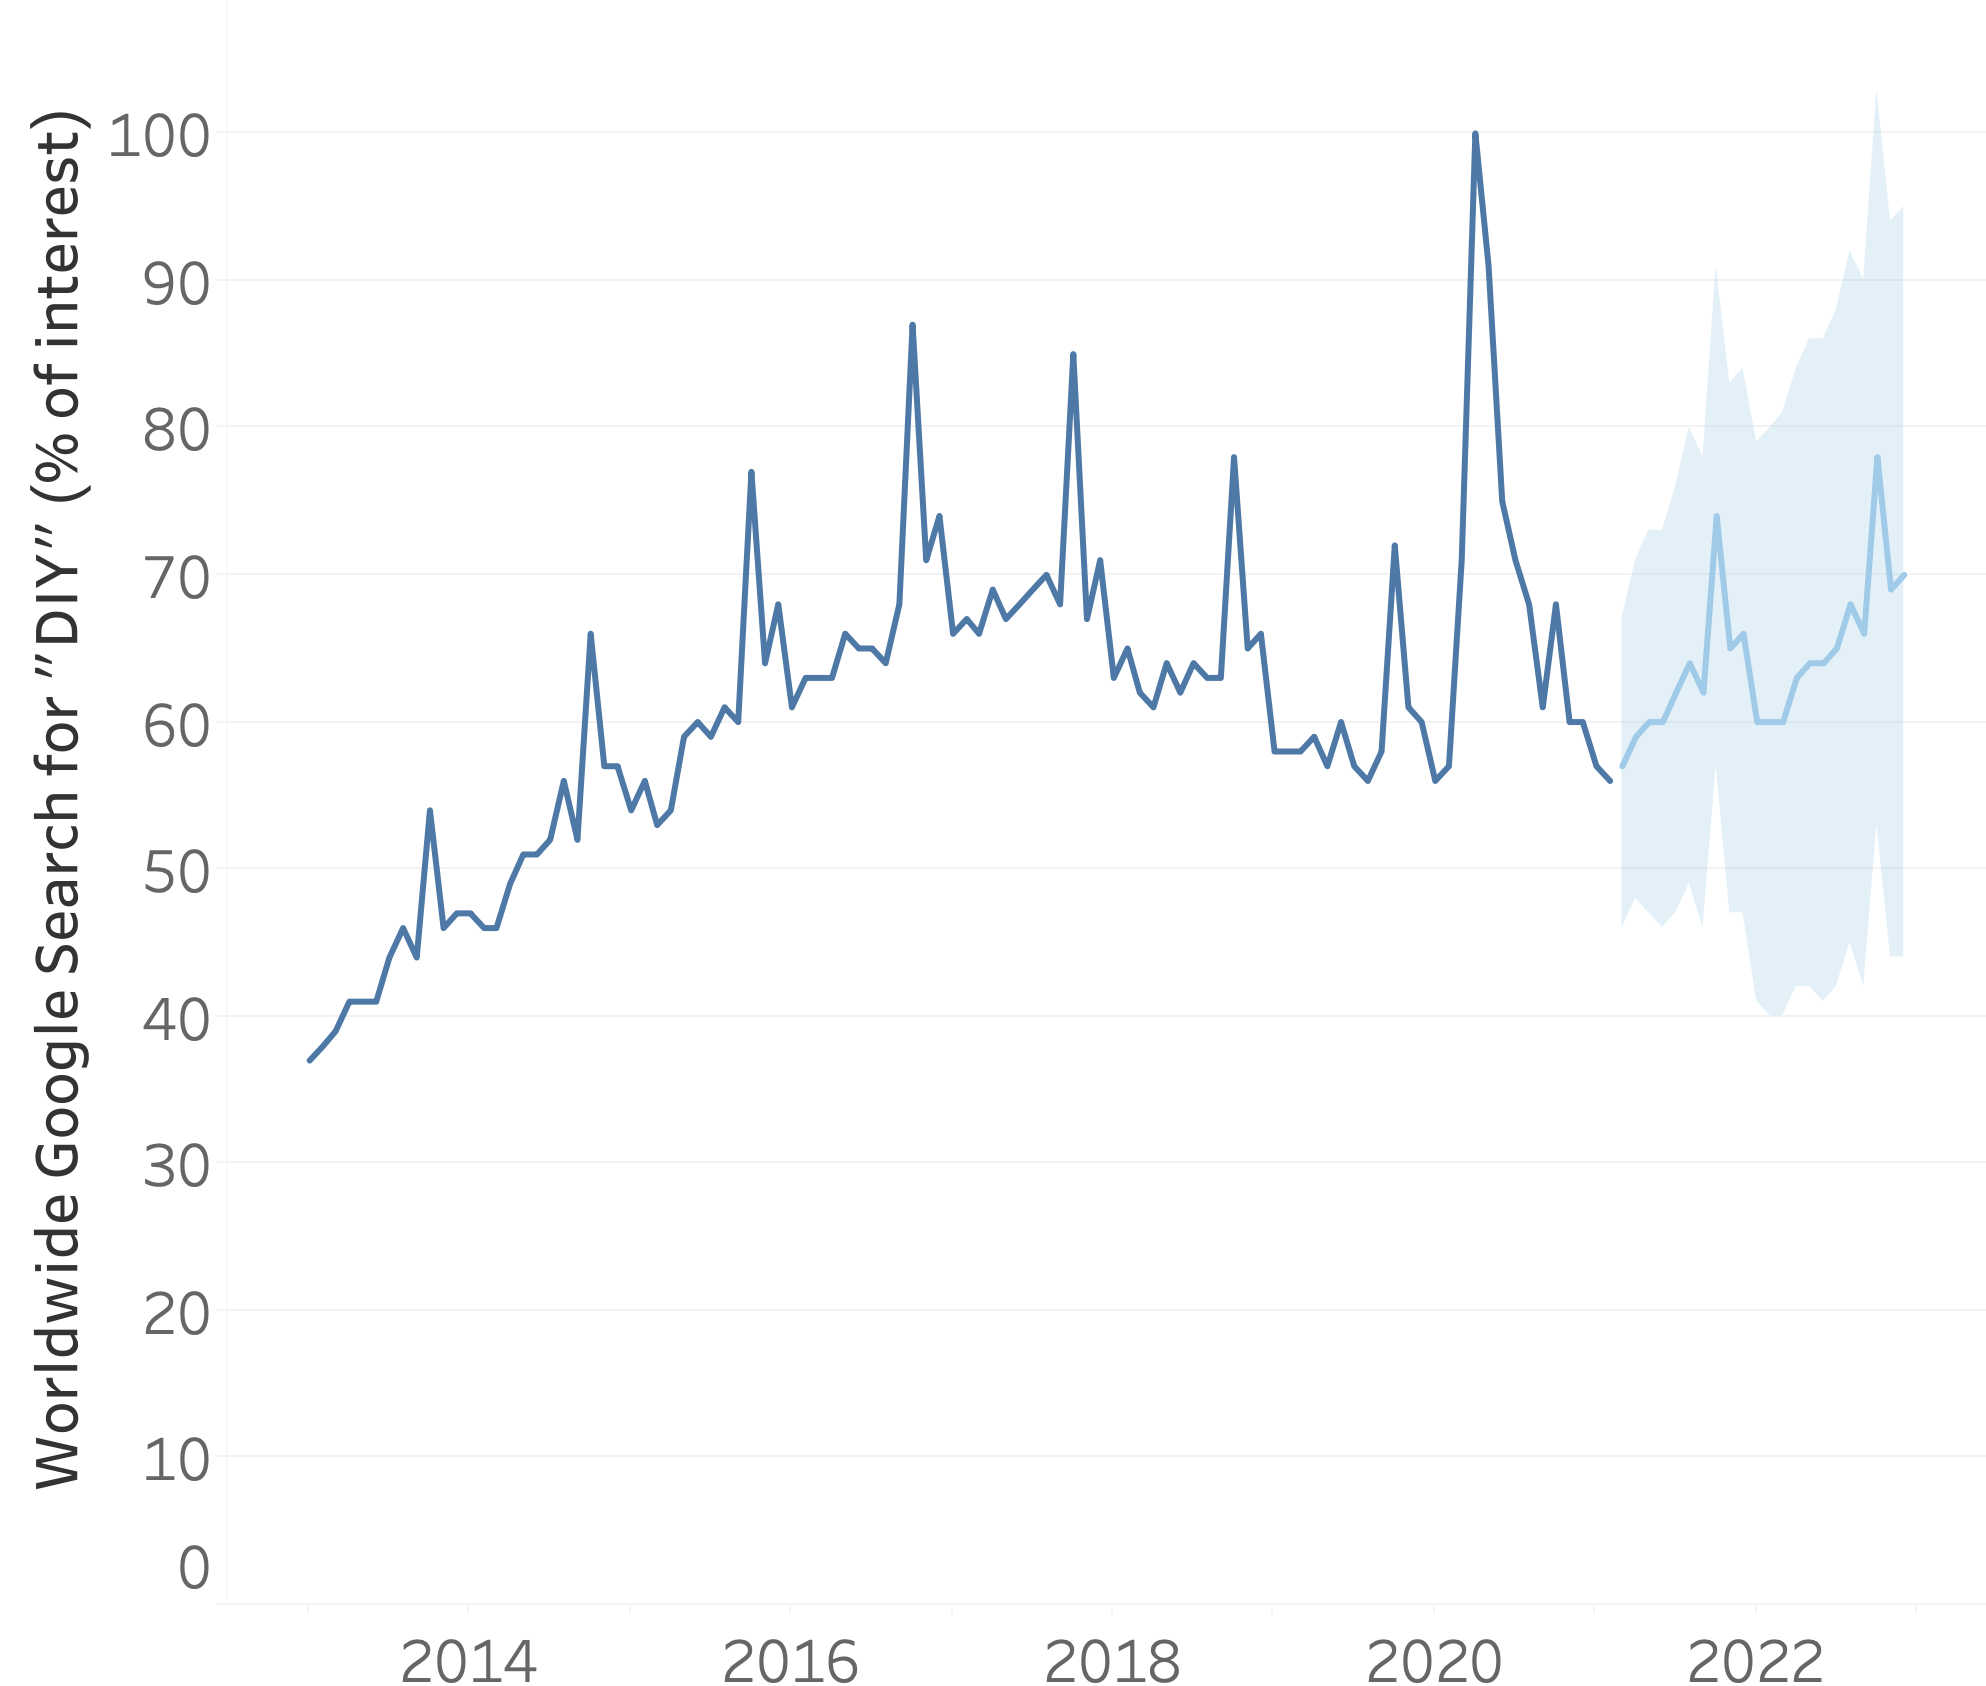
Forecasting
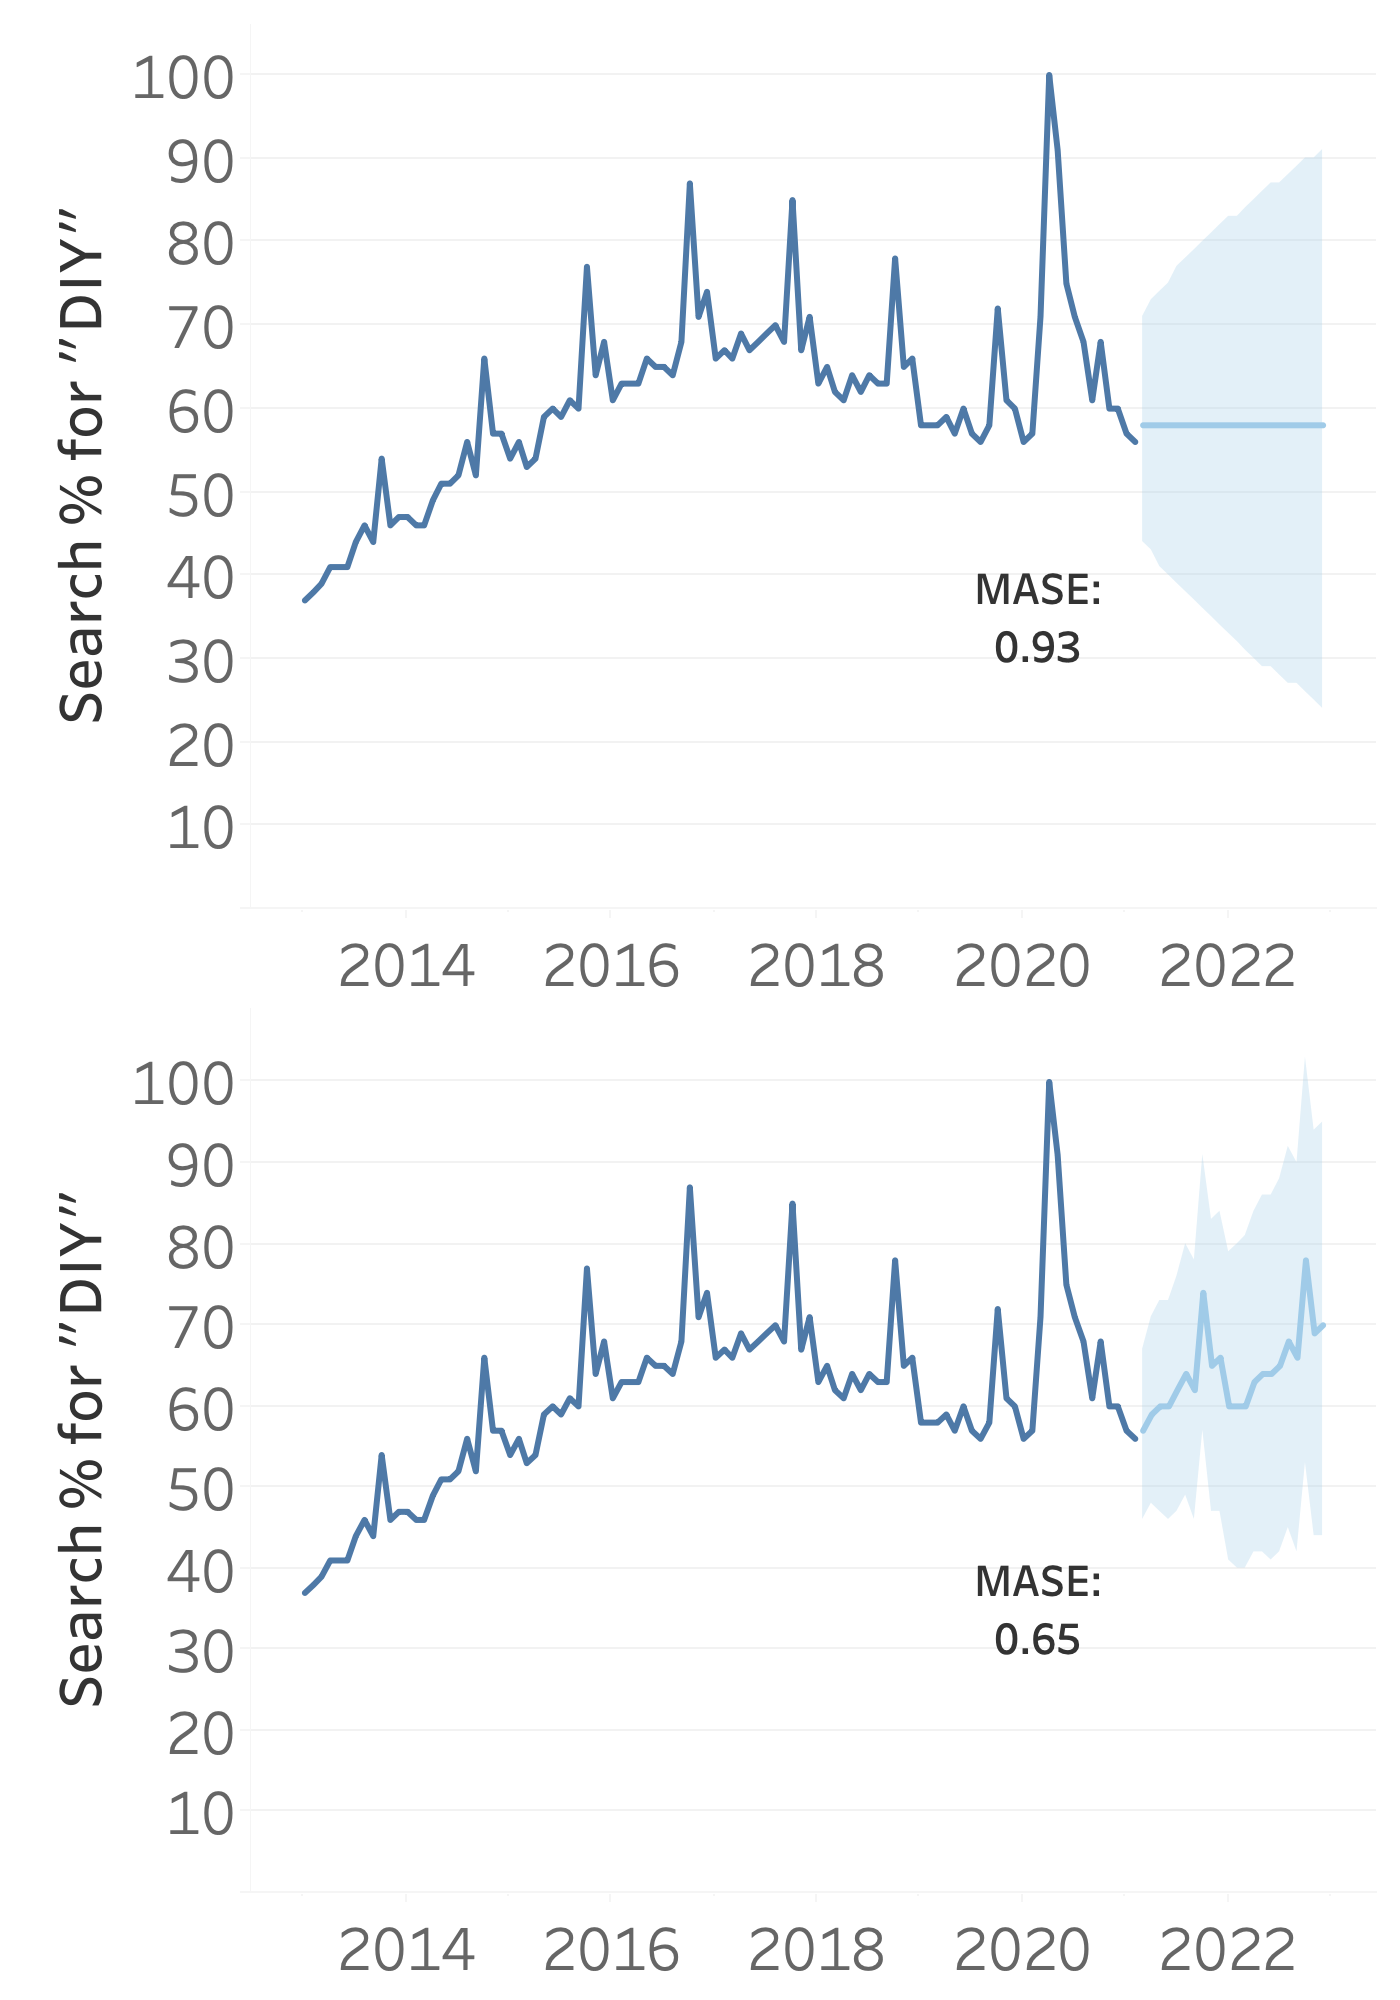
Naive forecast
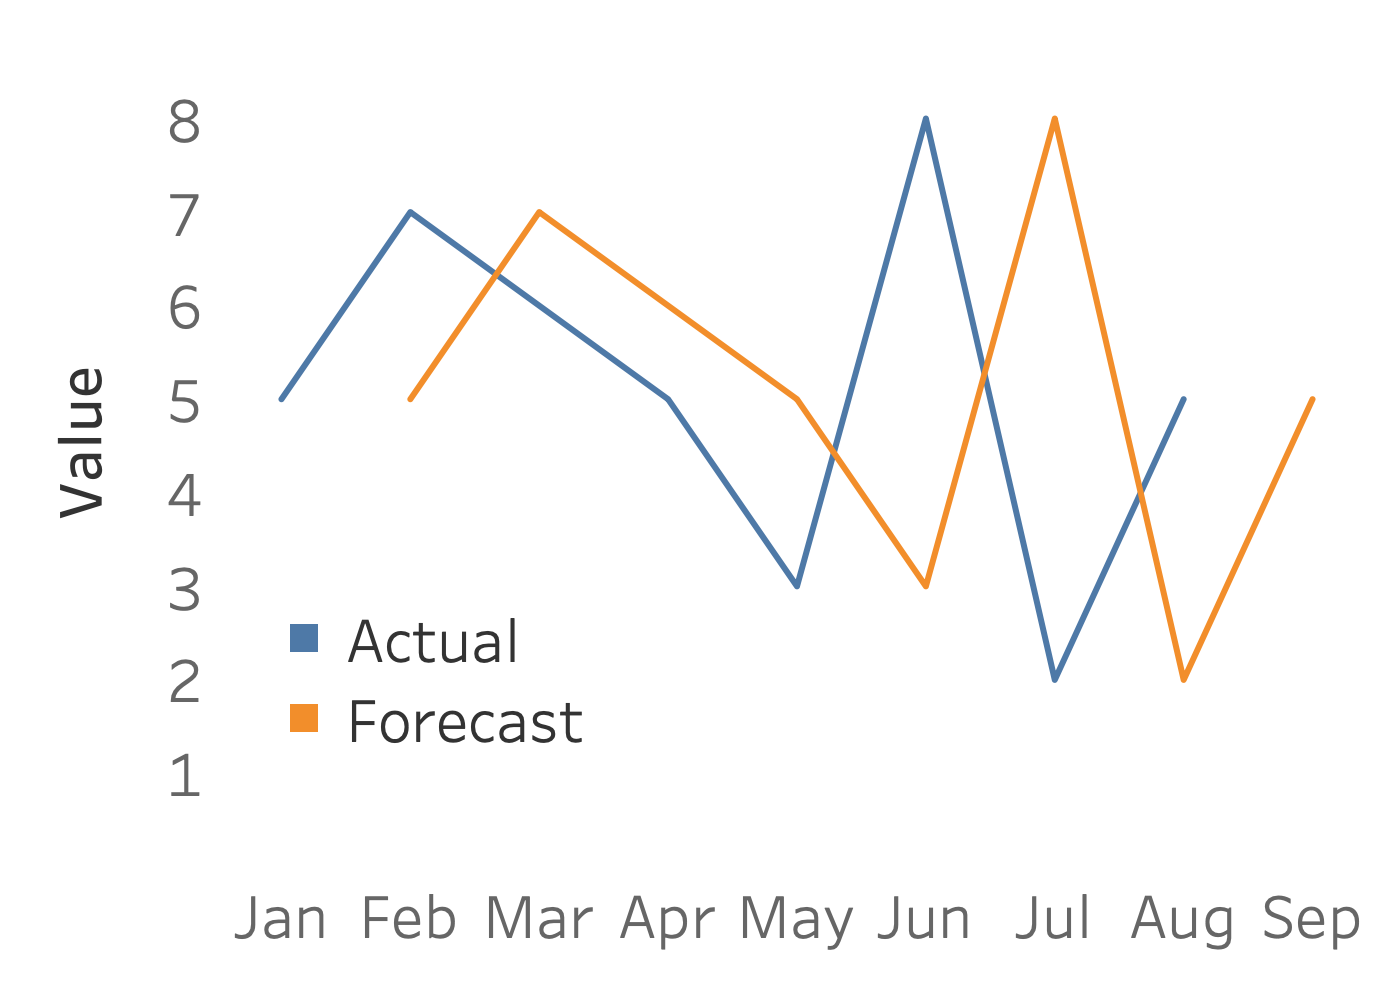
- Useful for benchmarking
Exponential smoothing
- Predictions will be influenced more by recent value changes than the past
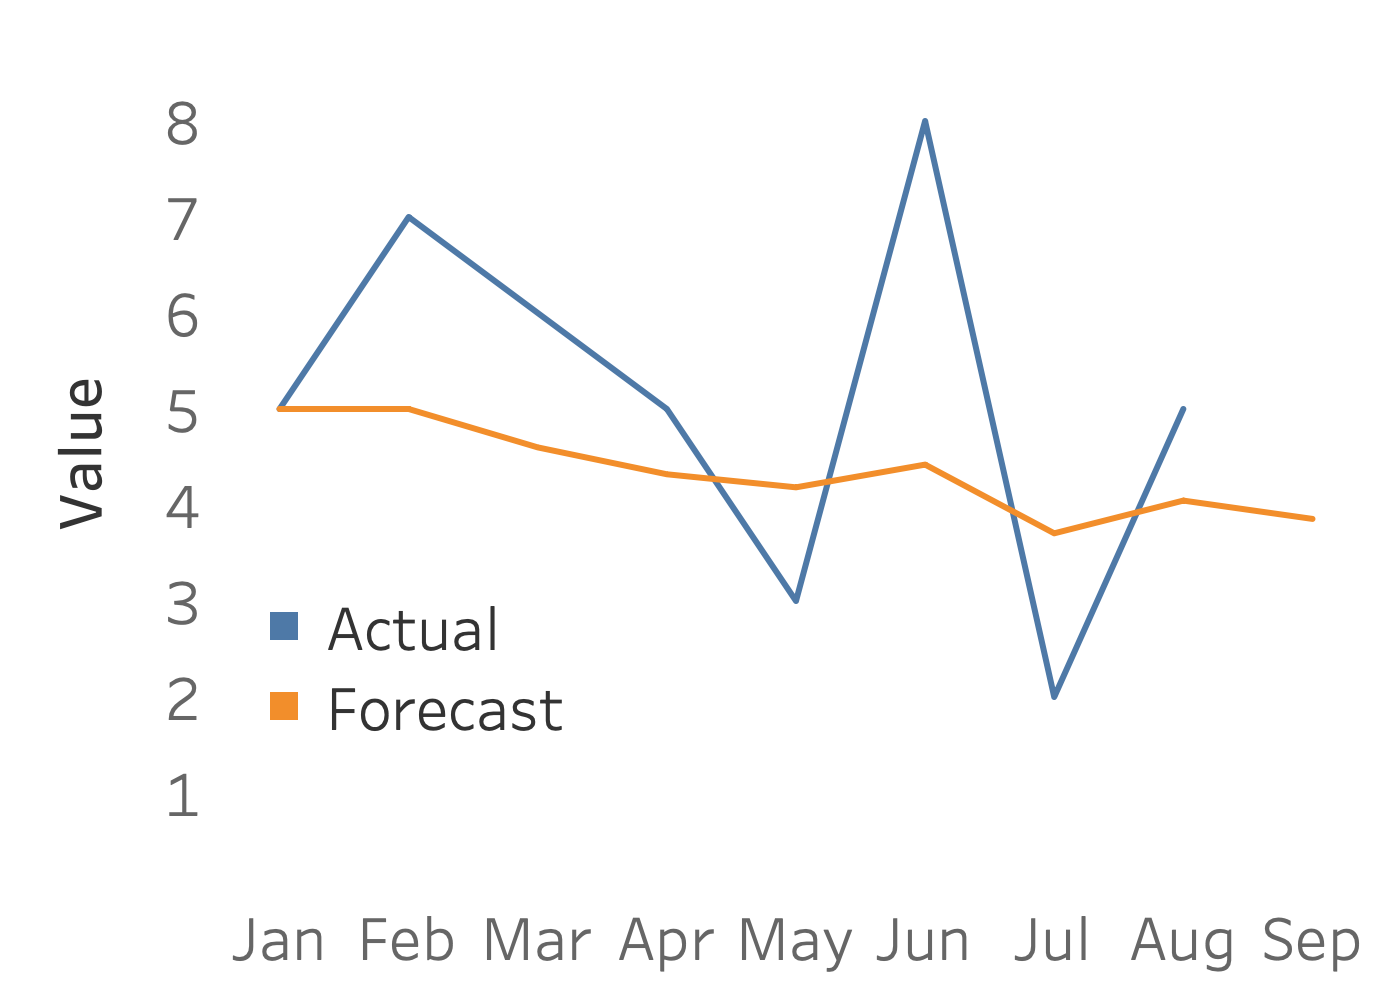
- Tableau will run many models and select the best one
Mean absolute scaled error (MASE)