Assessing a trend line
Statistical Techniques in Tableau

Maarten Van den Broeck
Content Developer at DataCamp
Linear and logarithmic models
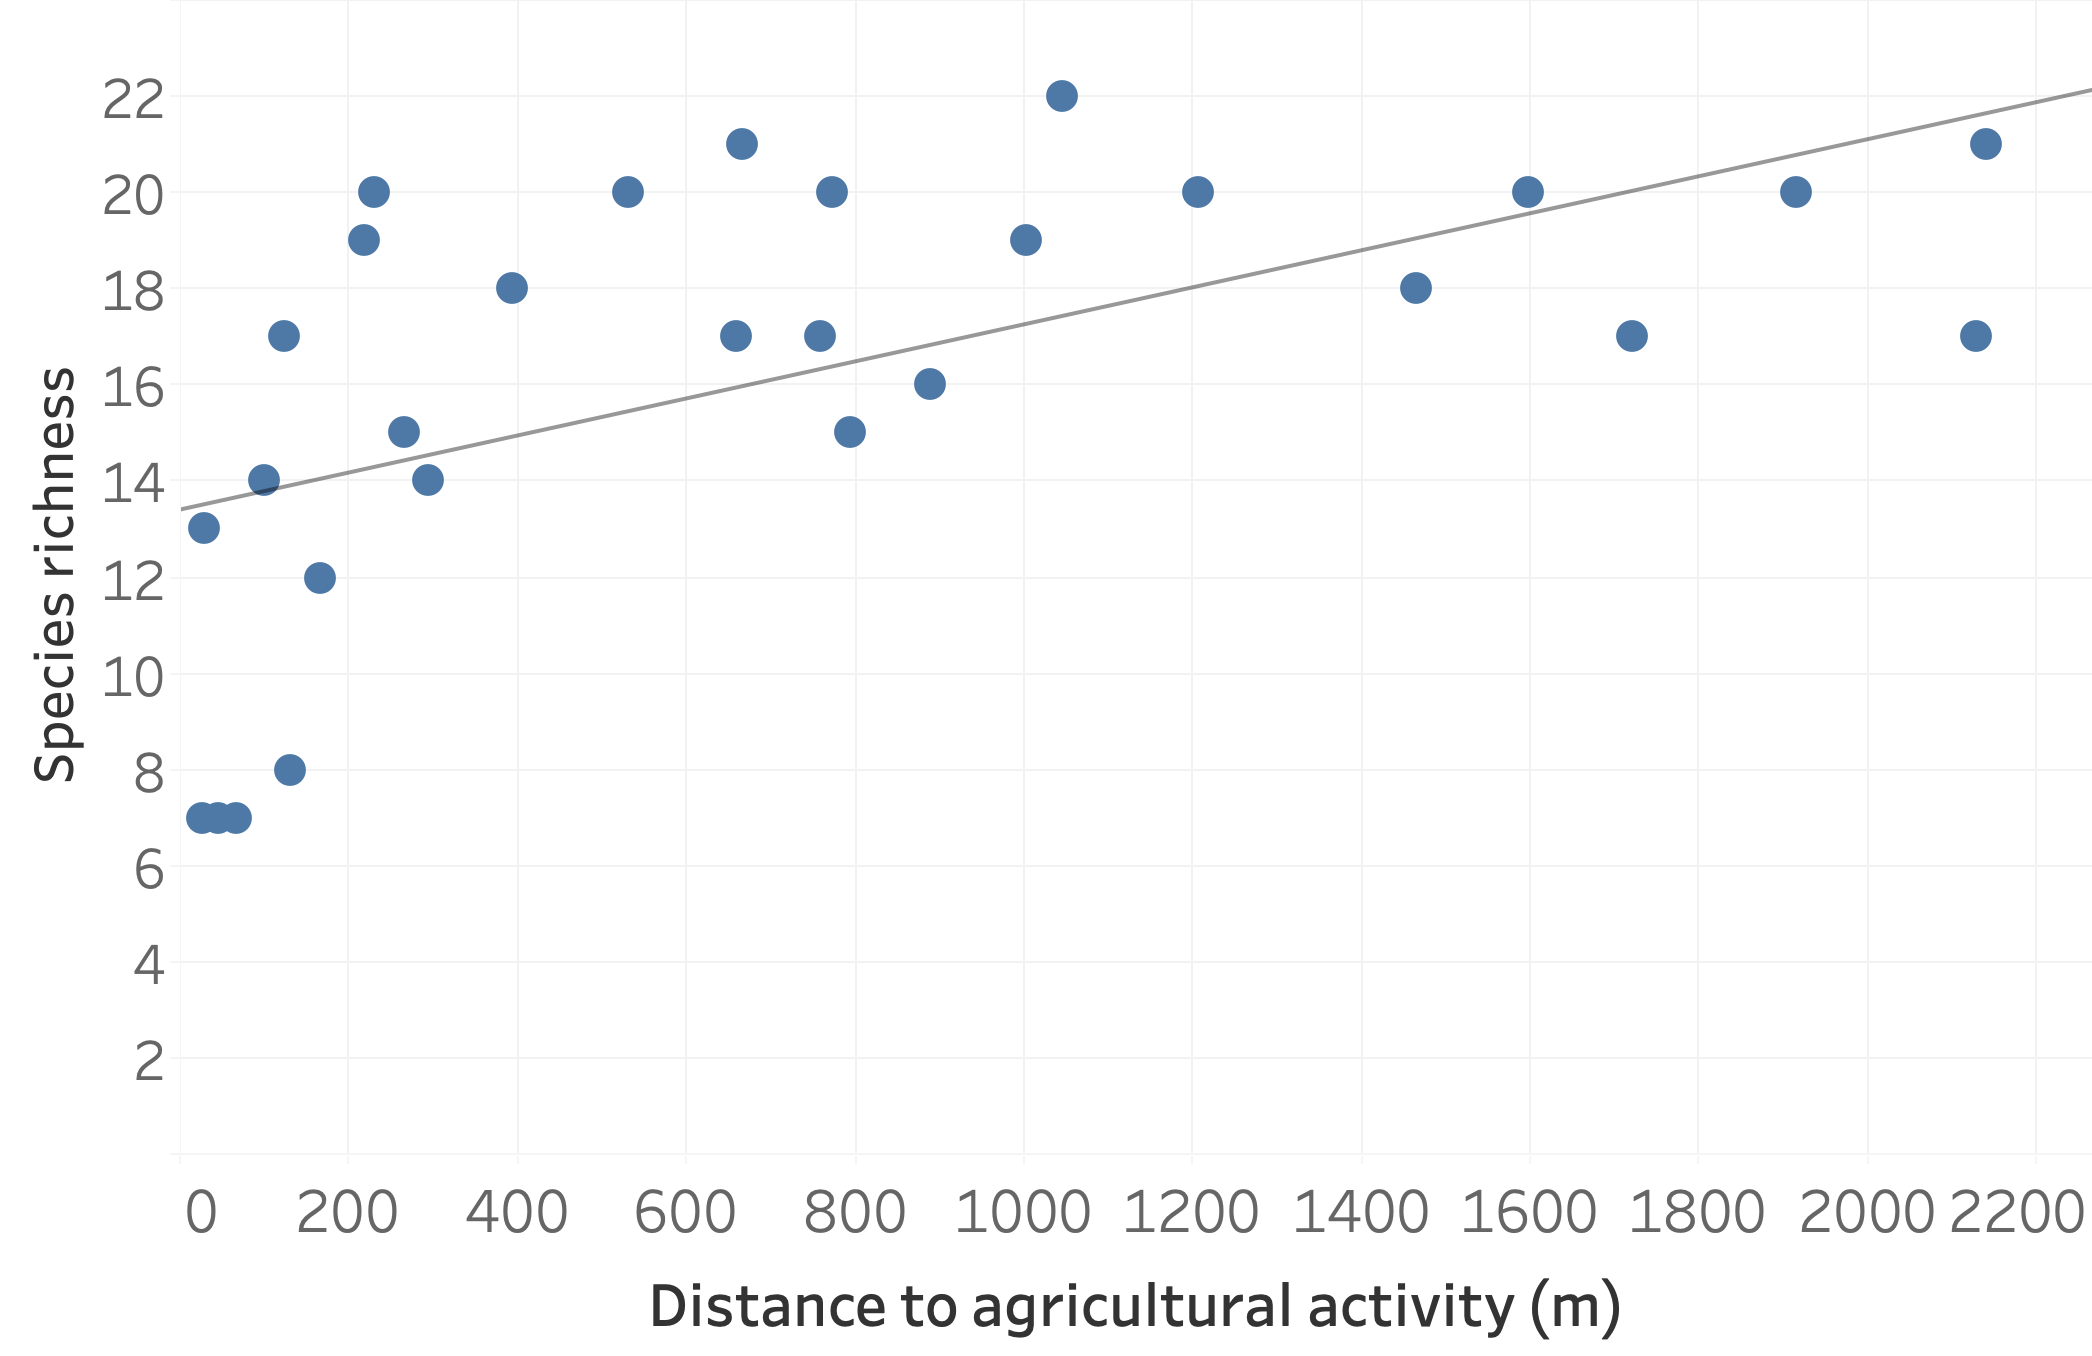
Linear
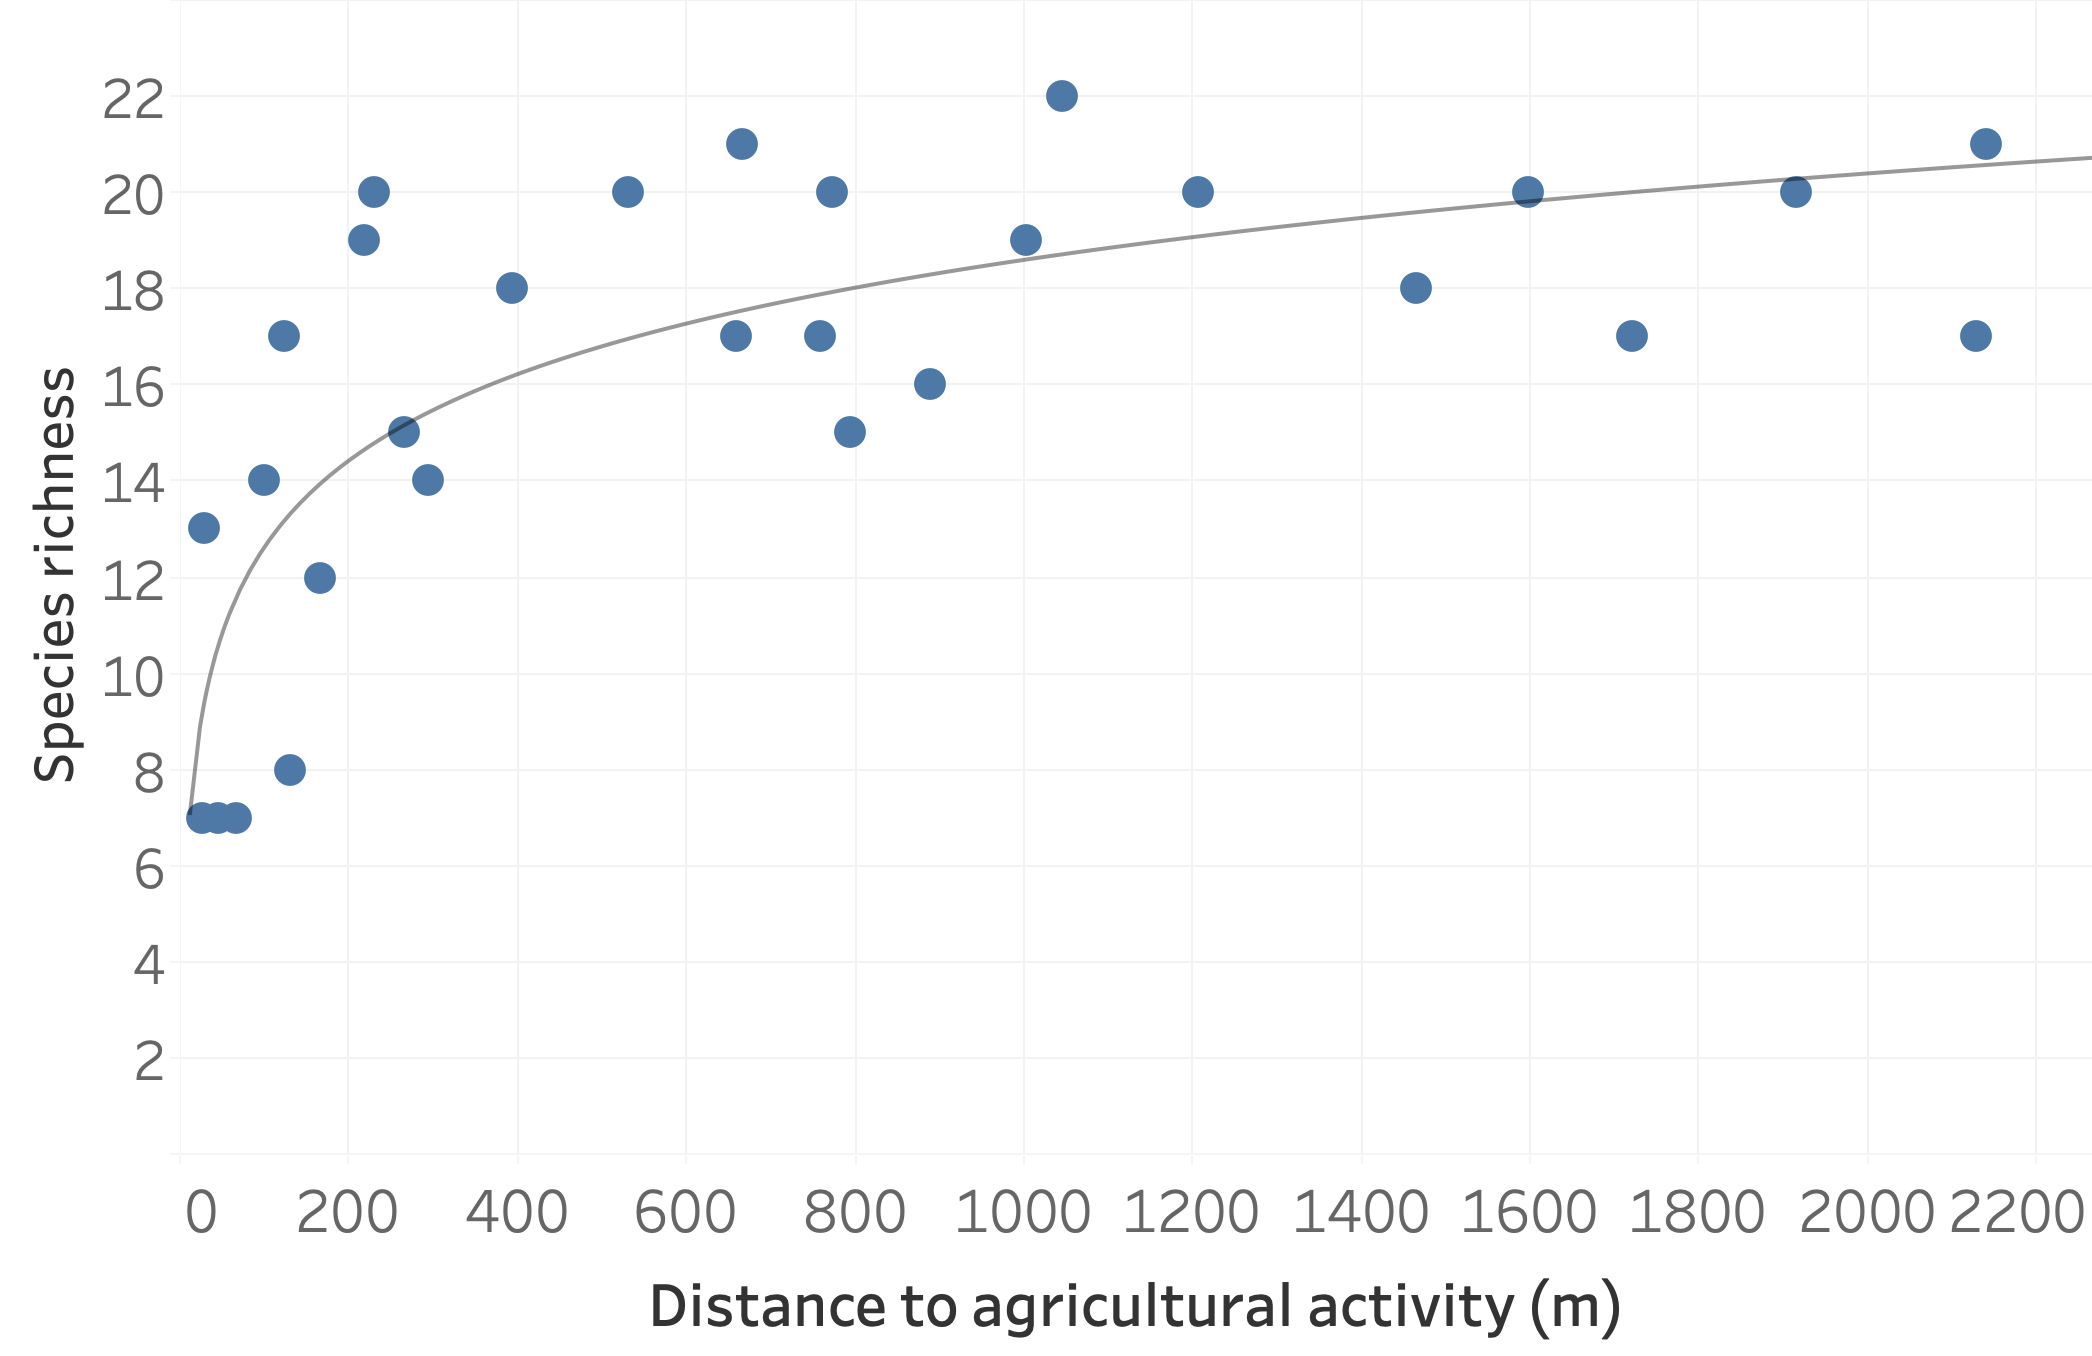
Logarithmic
Linear model
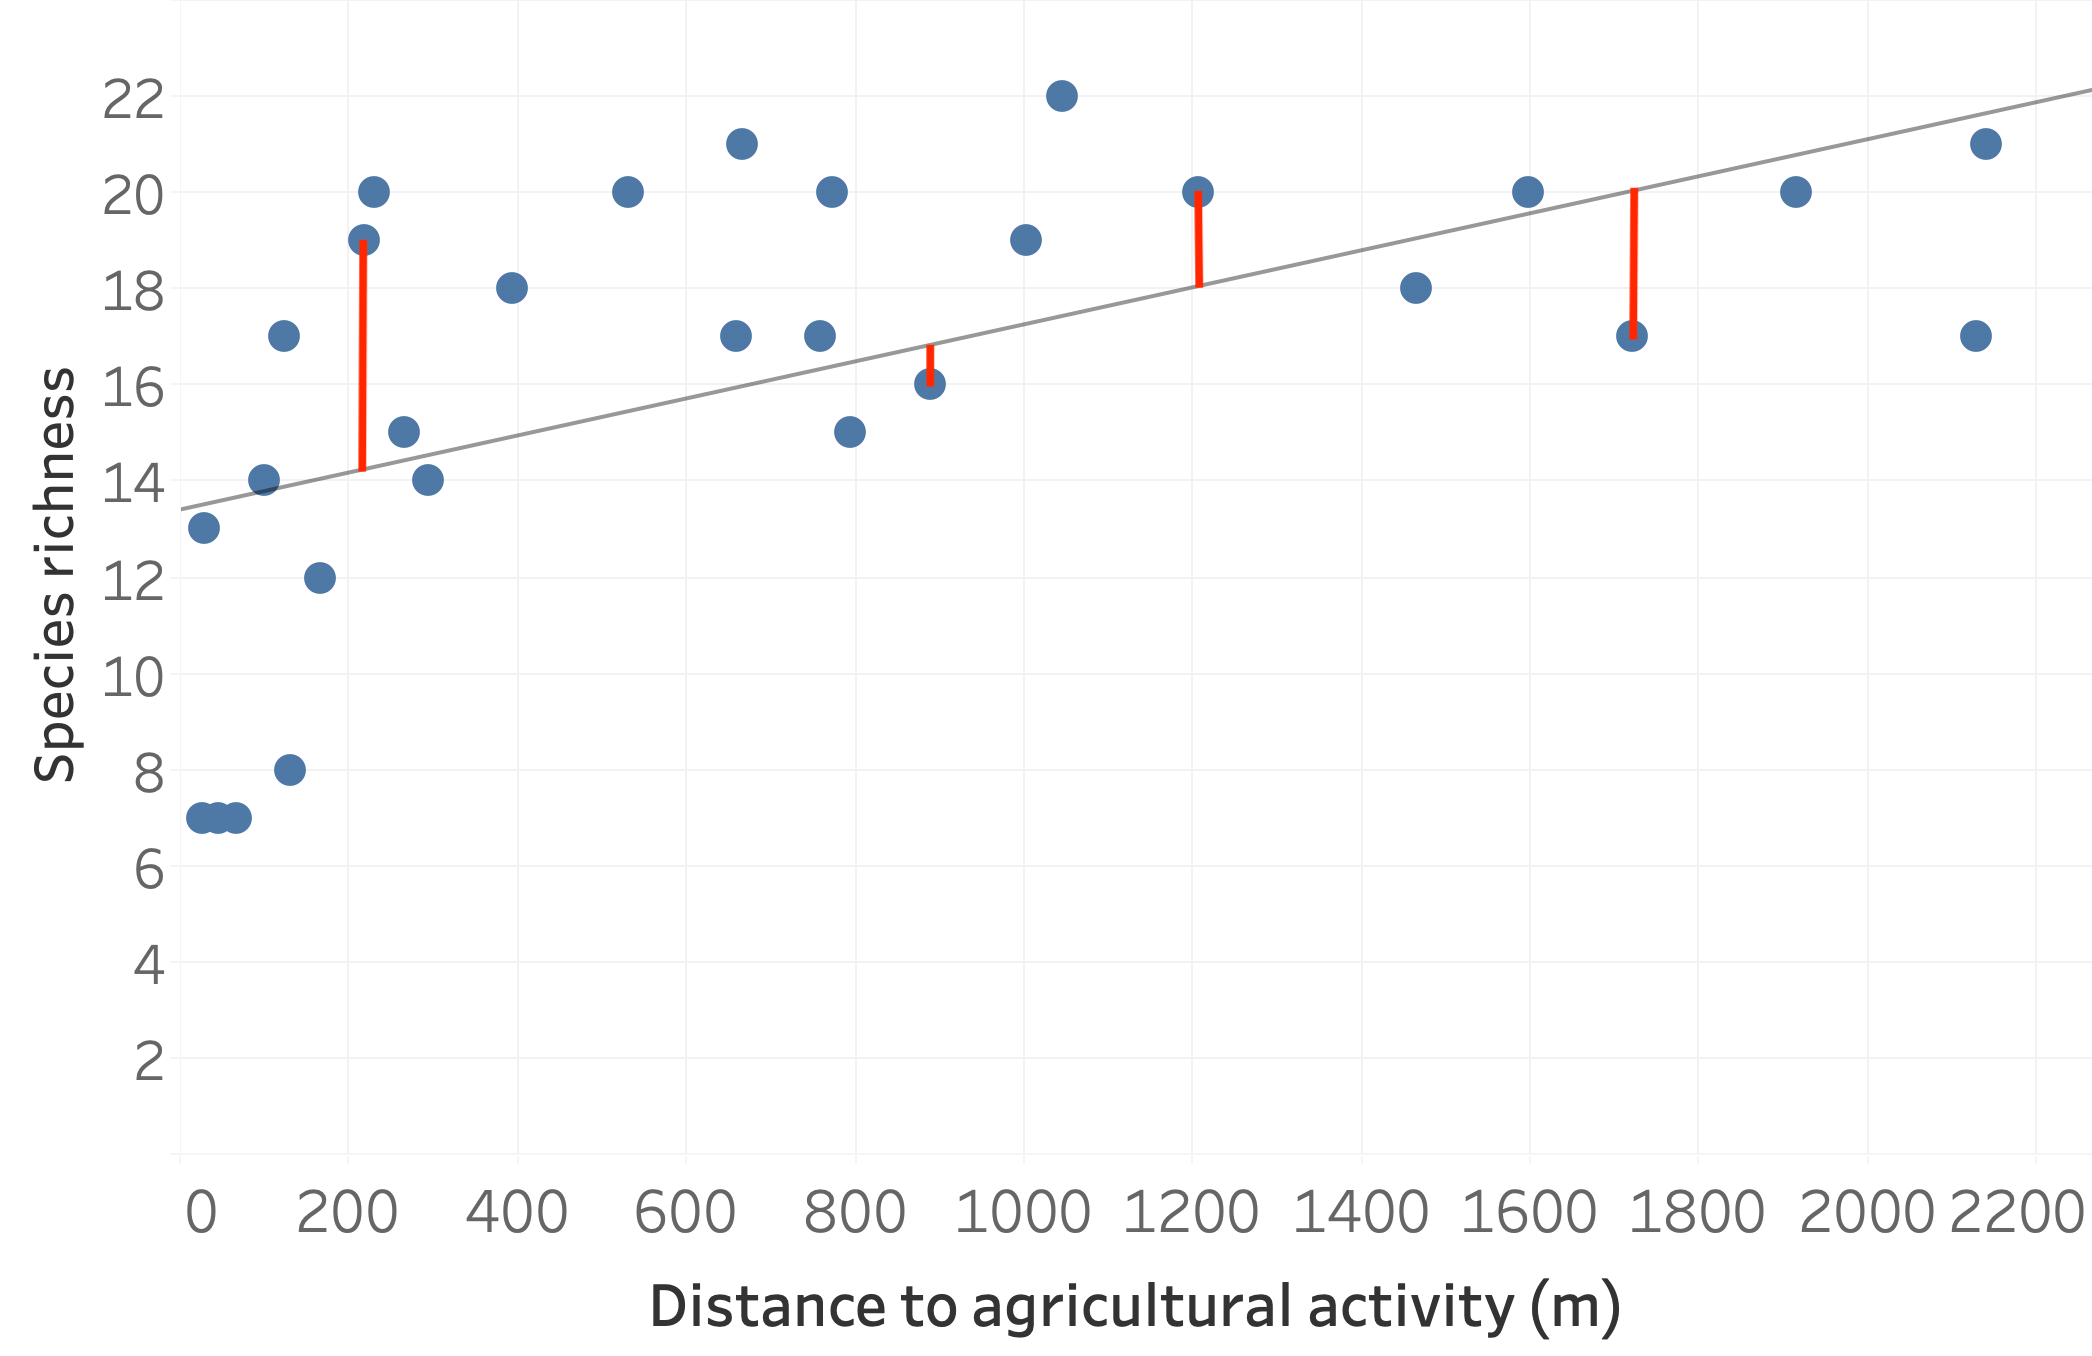
Residuals and $R^2$ of linear model
$R^2$ of logarithmic model
Residual standard error (RSE)
- Average difference between observed values and trend line
- Linear model: RSE = 3.69
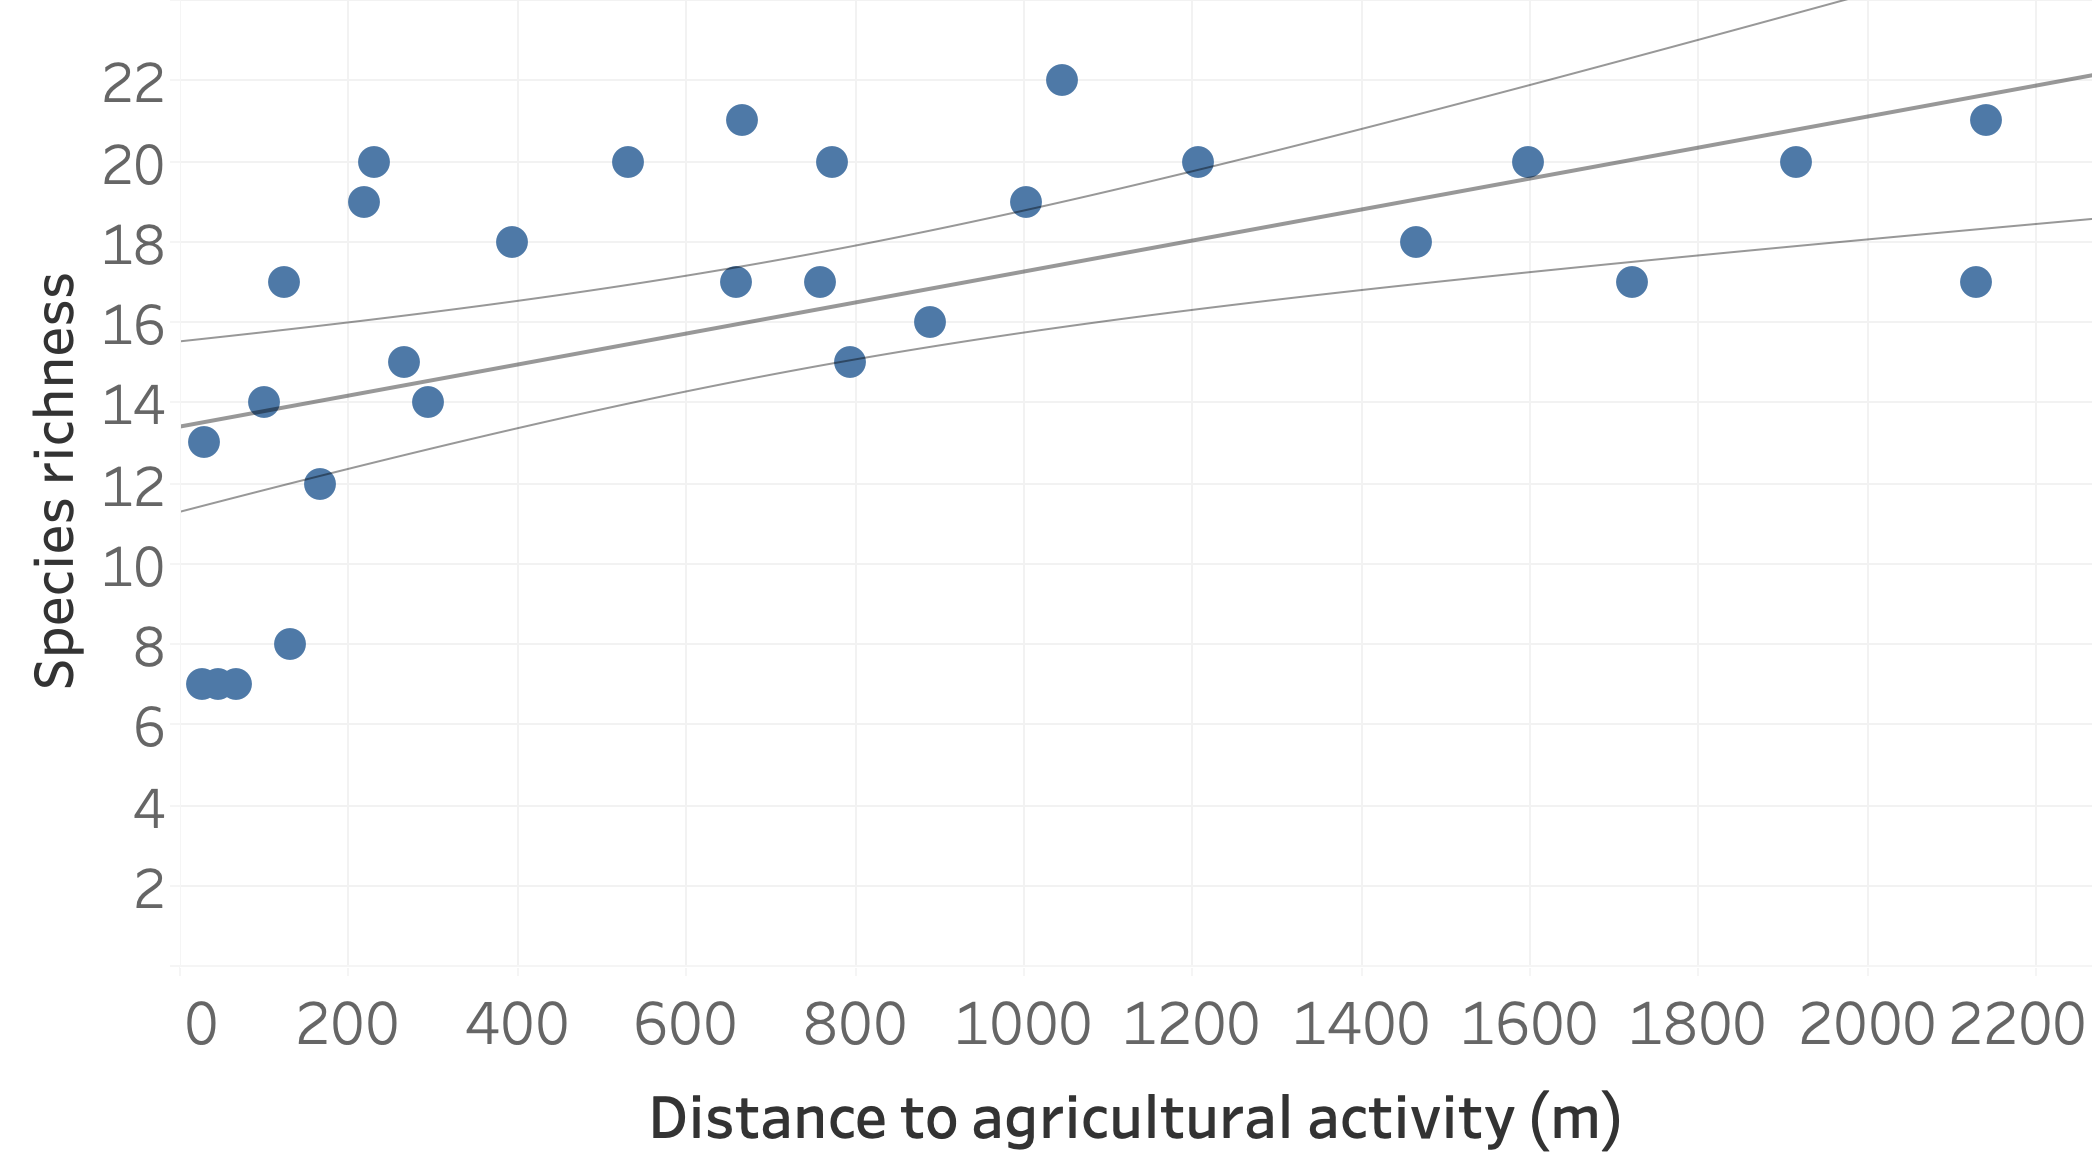
- Confidence interval is wider at low and high distances
- Same unit as unit on y axis
- Logarithmic model: RSE = 2.91
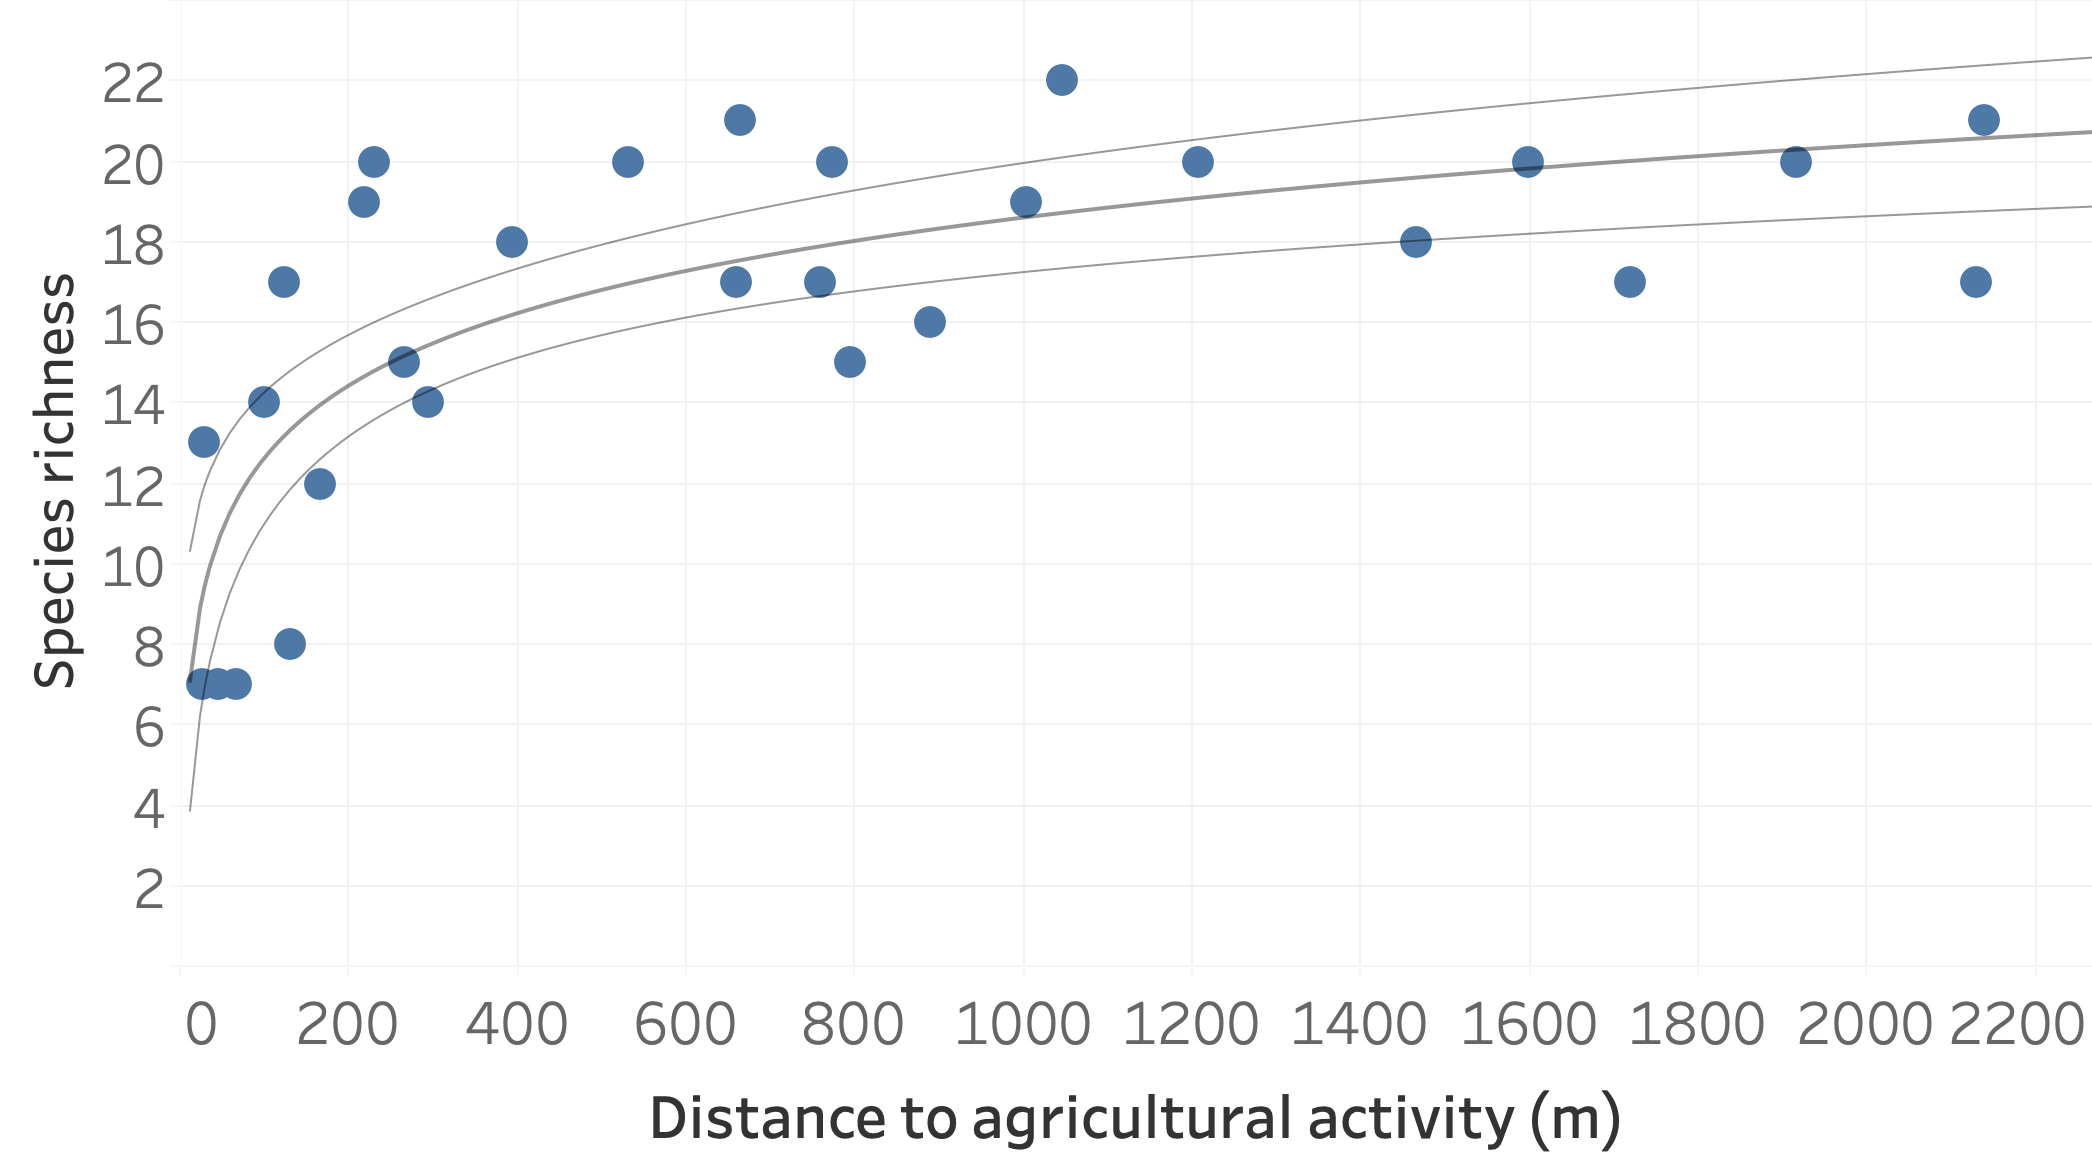
- Confidence interval is only wider at very high distances
p-value
Linear model
- p-value = 0.001
- Chance of $\frac{1}{1000}$ there is no correlation
- p-value < 0.05: model is statistically significant, fits data well
Logarithmic model
- p-value = 0.0001
- Chance of $\frac{1}{10000}$ there is no correlation
- The lower the p-value, the better, but p-value isn't everything!

