Measures of spread
Statistical Techniques in Tableau

Maarten Van den Broeck
Content Developer at DataCamp
Statistics for describing a variable
| Statistic | Description |
|---|---|
| Count | number of observations |
| Median | midpoint of your observations |
| Average | mean value of your observations |
| Min/Max | lowest and highest value |
| Quartile/IQR | 25th and 75th percentile / spread of the 50% of your middlemost observations |
| Modality/Mode | number of modes / most occurring value |
| Skewness | (a)symmetry of the distribution |
| Kurtosis | distribution of extreme values |
Measures of spread

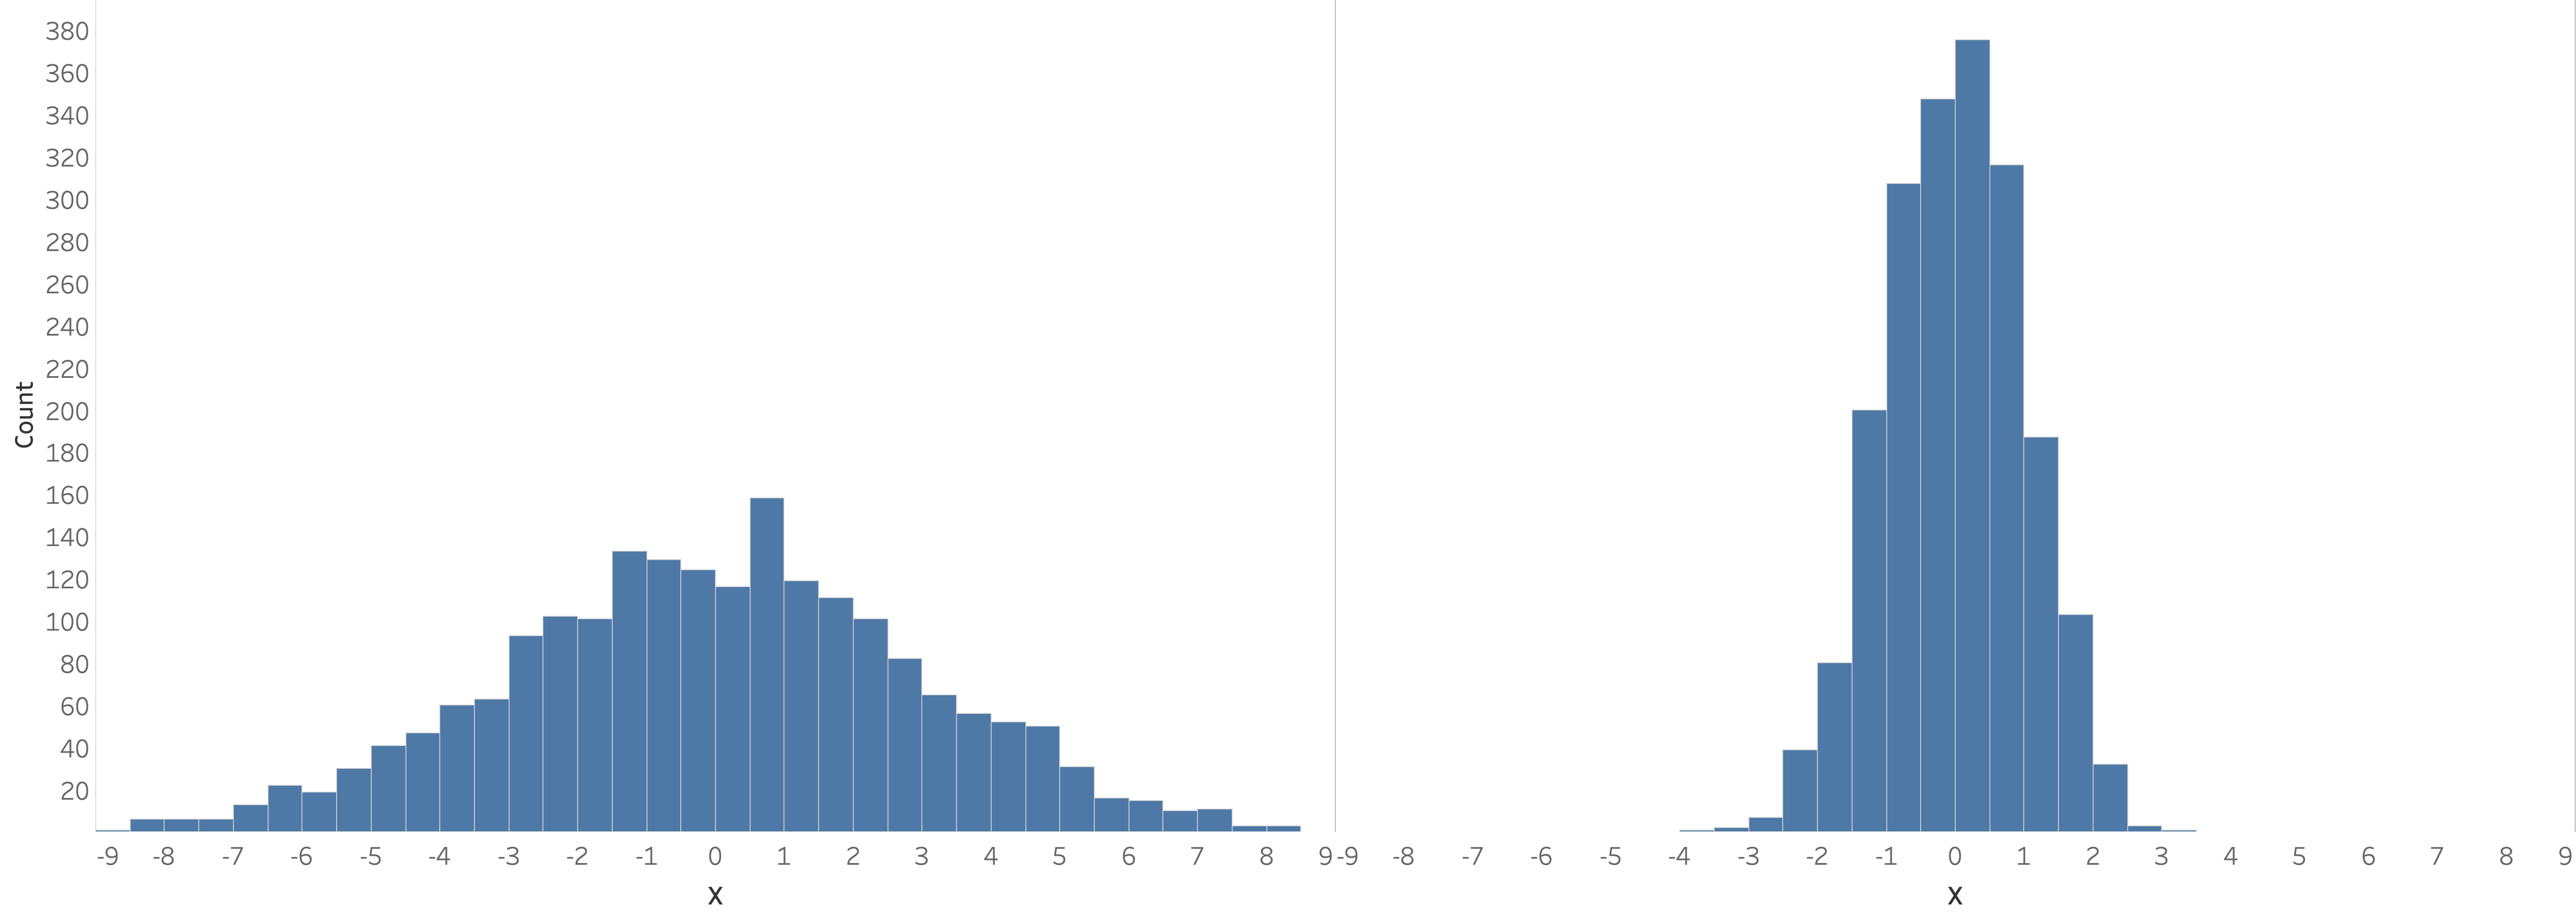
- Spread is affected by kurtosis (outliers) and skewness (asymmetry)
- Typically, spread around the mean is only useful for normal distributions
Variance
$x_{i} - \overline{x}$
$(x_{i} - \overline{x})^2$
$\sum(x_{i} - \overline{x})^2$
$\frac{\sum(x_{i} - \overline{x})^2}{n - 1}$
- Variance is the average of the squared differences from the mean
- Higher variance means higher spread of the data
- Unit of variance is squared
$x_i$ = individual data point, $\overline{x}$ = sample mean
$n$ = number of observations
Standard deviation (SD or $s$)
$s = \sqrt{\frac{\sum(x_{i} - \overline{x})^2}{n - 1}}$ or $s = \sqrt{variance}$
- Unit of standard deviation is same as the variable
- How far on average lie the data points from the mean
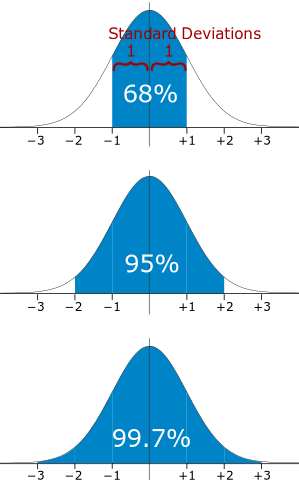
- 68% of the observations lies within $[-1s, 1s]$ range if data is normally distributed
- Number of standard deviations can be used as a threshold to pinpoint unusual values

Population vs. sample

Population vs. sample

Population vs. sample

Calculating spread in sample vs. population
Sample variance $s^2$
$s^2 = \frac{\sum(x_{i} - \overline{x})^2}{n - 1}$
data per country (sample) generalize for Europe (population)
Sample standard deviation $s$
$s = \sqrt{\frac{\sum(x_{i} - \overline{x})^2}{n - 1}}$ $\overline{x}$ = sample mean
$n$ = sample size
Population variance $\sigma$
$\sigma^2 = \frac{\sum(x_{i} - \mu)^2}{N}$
data of your university (population) no need for generalizing
Population standard deviation $\sigma^2$
$\sigma = \sqrt{\frac{\sum(x_{i} - \mu)^2}{N}}$ $\mu$ = population mean
$N$ = population size
Calculating spread in sample vs. population
Sample variance $s^2$
$s^2 = \frac{\sum(x_{i} - \overline{x})^2}{\textbf{n - 1}}$
data per country (sample) generalize for Europe (population)
Sample standard deviation $s$
$s = \sqrt{\frac{\sum(x_{i} - \overline{x})^2}{\textbf{n - 1}}}$ $\overline{x}$ = sample mean
$n$ = sample size
Population variance $\sigma^2$
$\sigma^2 = \frac{\sum(x_{i} - \mu)^2}{\textbf{N}}$
data of your university (population) no need for generalizing
Population standard deviation $\sigma$
$\sigma = \sqrt{\frac{\sum(x_{i} - \mu)^2}{\textbf{N}}}$ $\mu$ = population mean
$N$ = population size
Let's practice!
Statistical Techniques in Tableau

