Measures of spread
Statistical Techniques in Tableau

Maarten Van den Broeck
Content Developer at DataCamp
Measures of spread
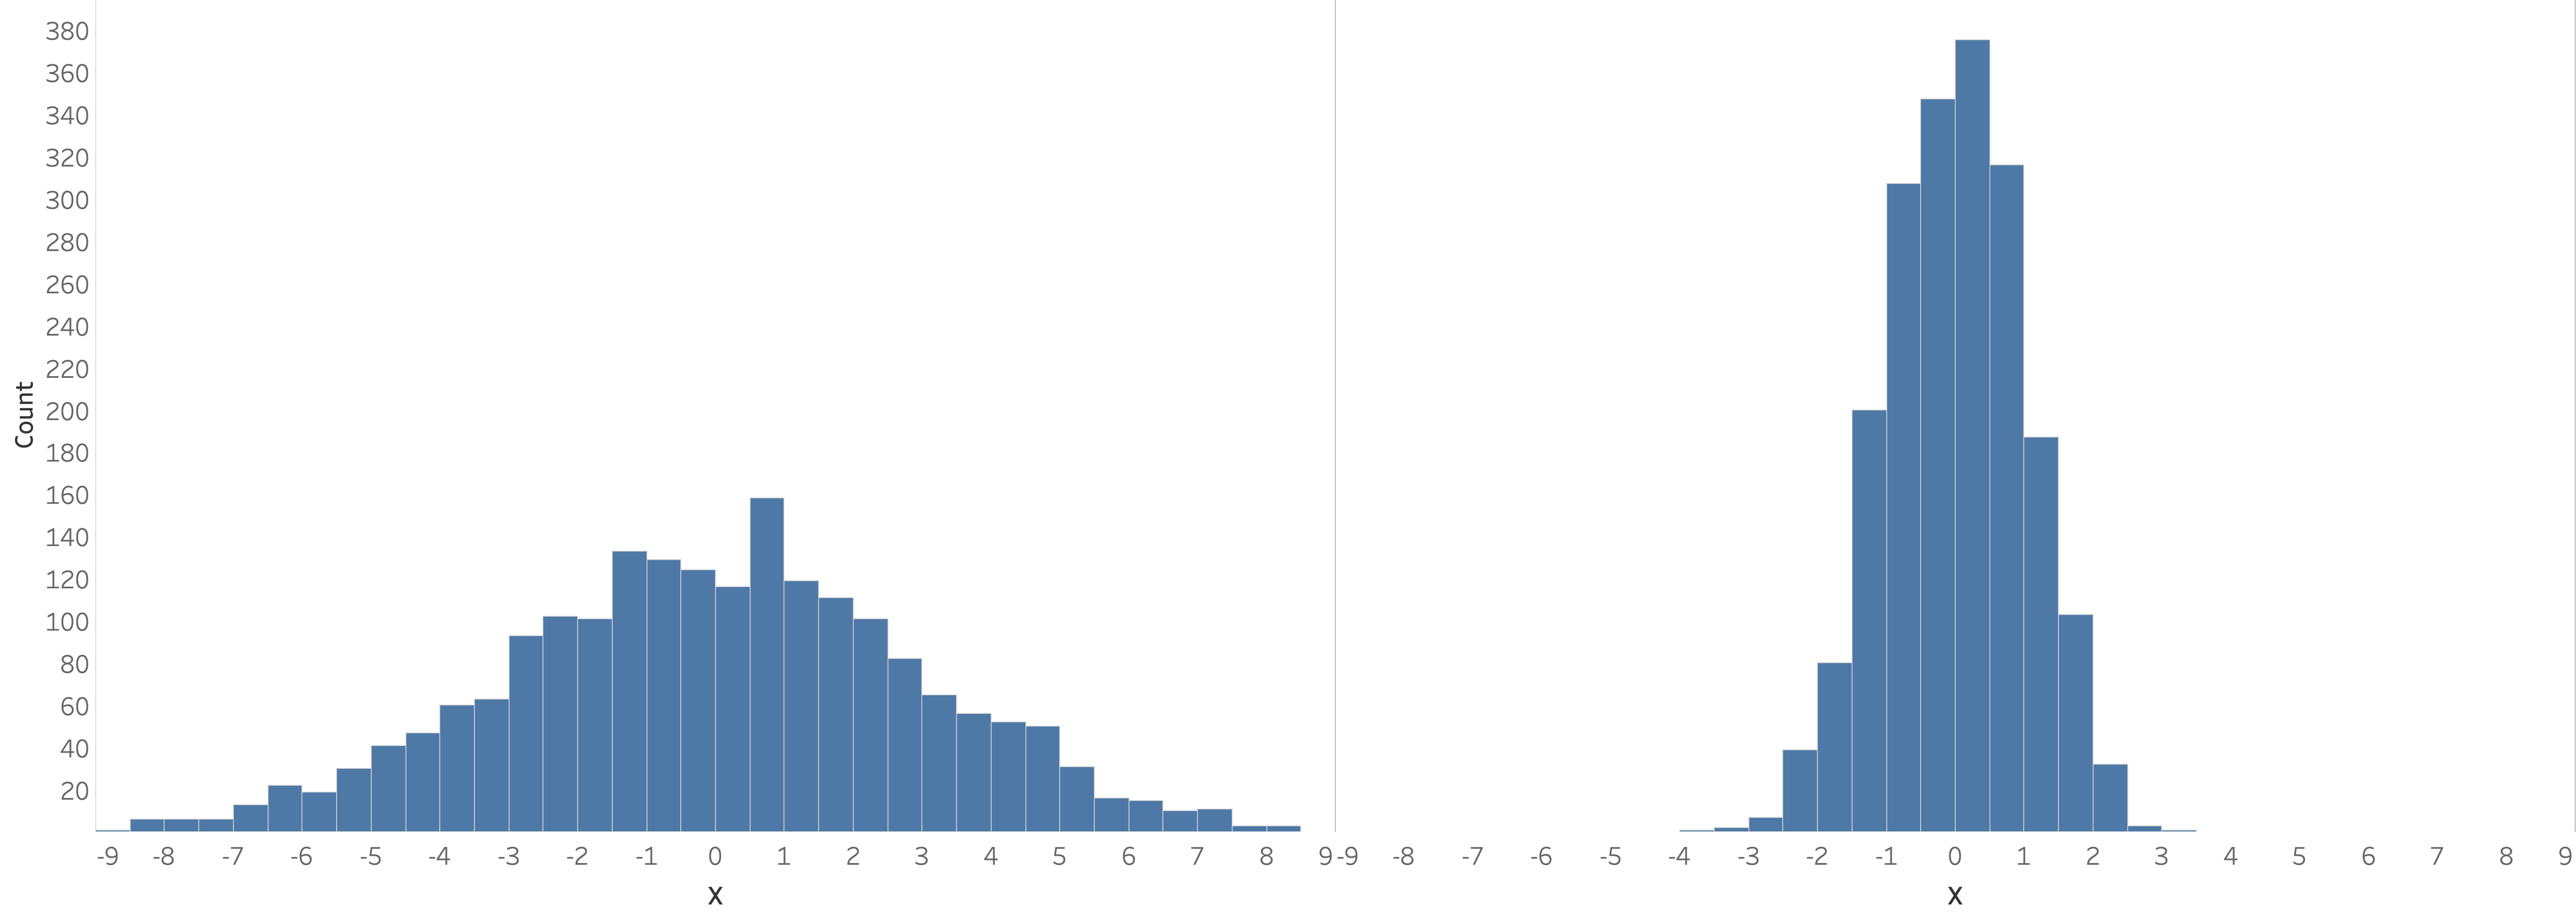
- Spread is affected by kurtosis (outliers) and skewness (asymmetry)
- Typically, spread around the mean is only useful for normal distributions
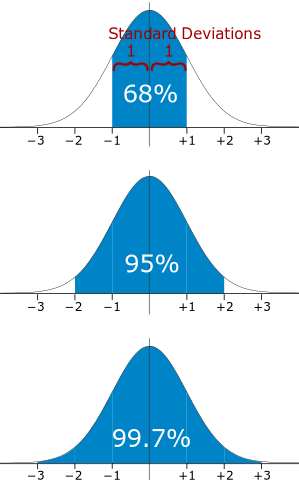
Standard deviation (SD or $s$)
Population vs. sample

Population vs. sample

Population vs. sample


