Clustering
Statistical Techniques in Tableau

Maarten Van den Broeck
Content Developer at DataCamp
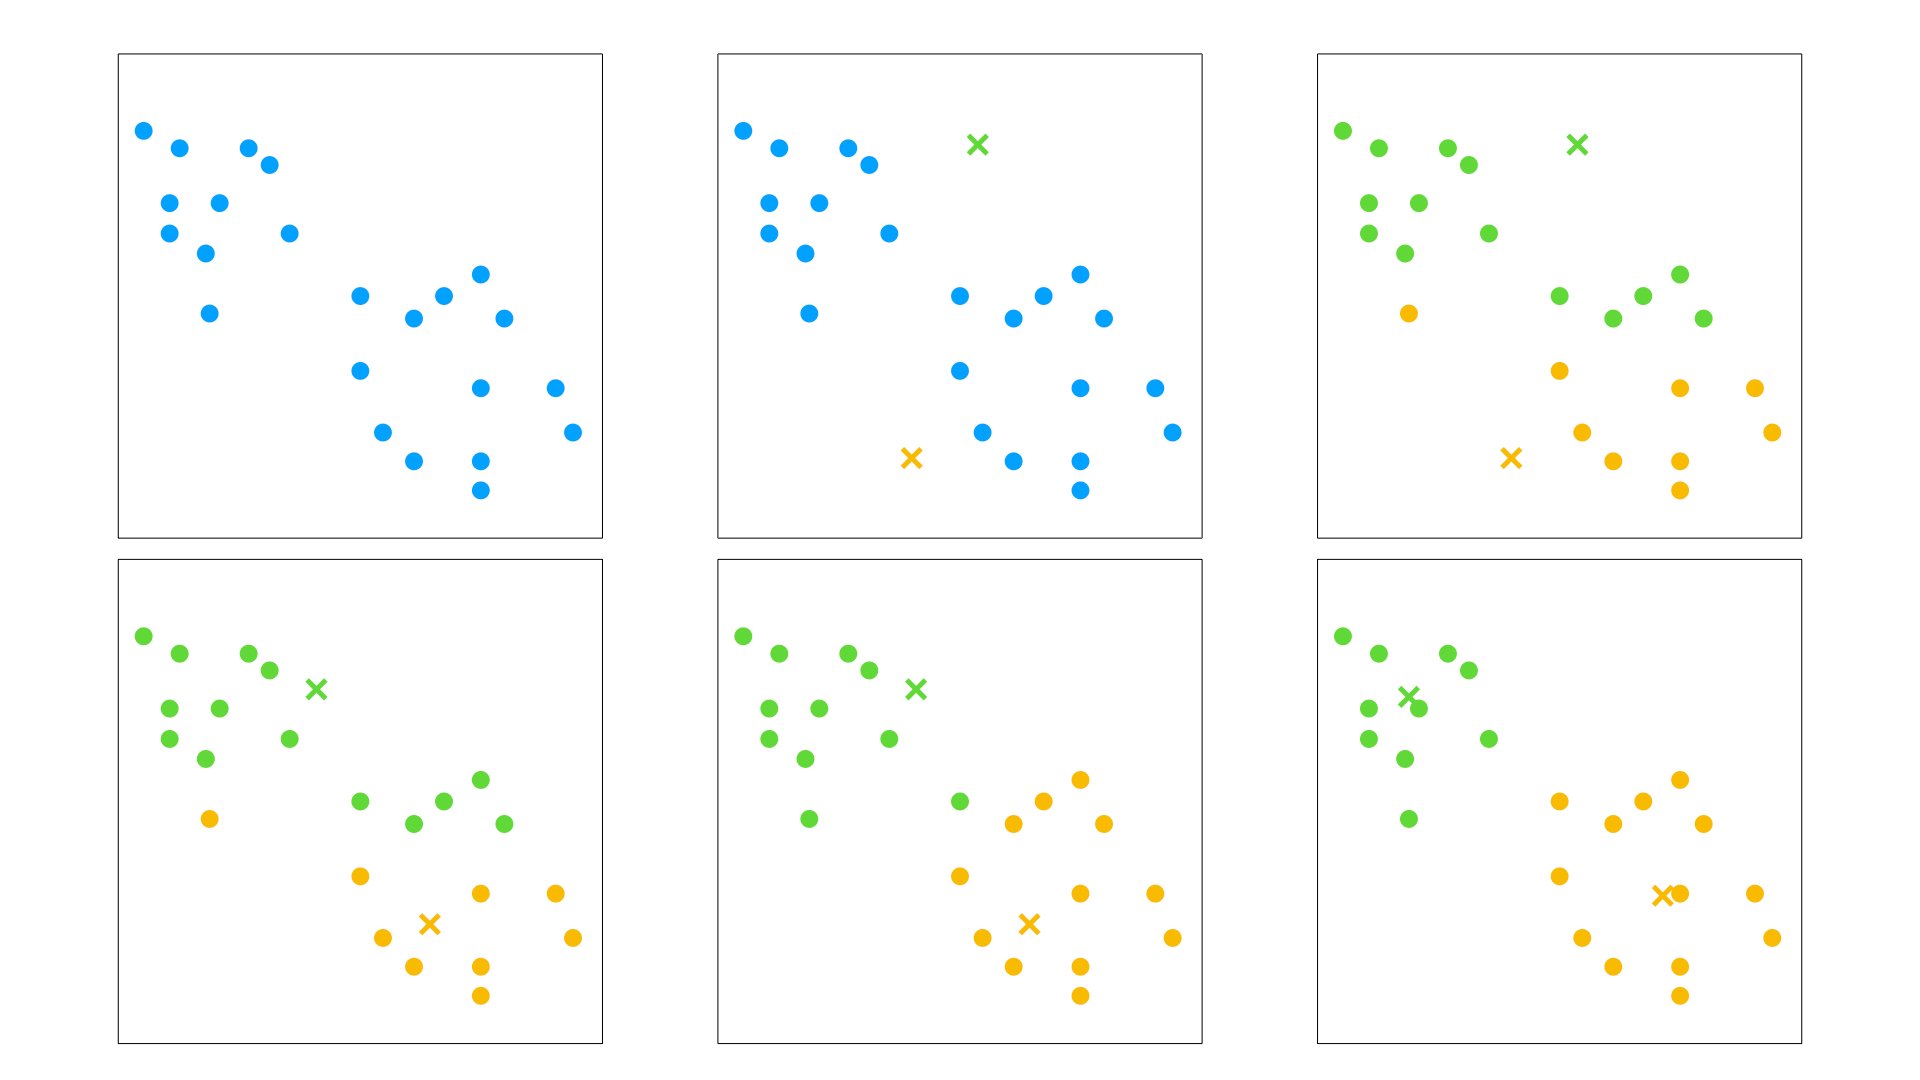
k-means clustering
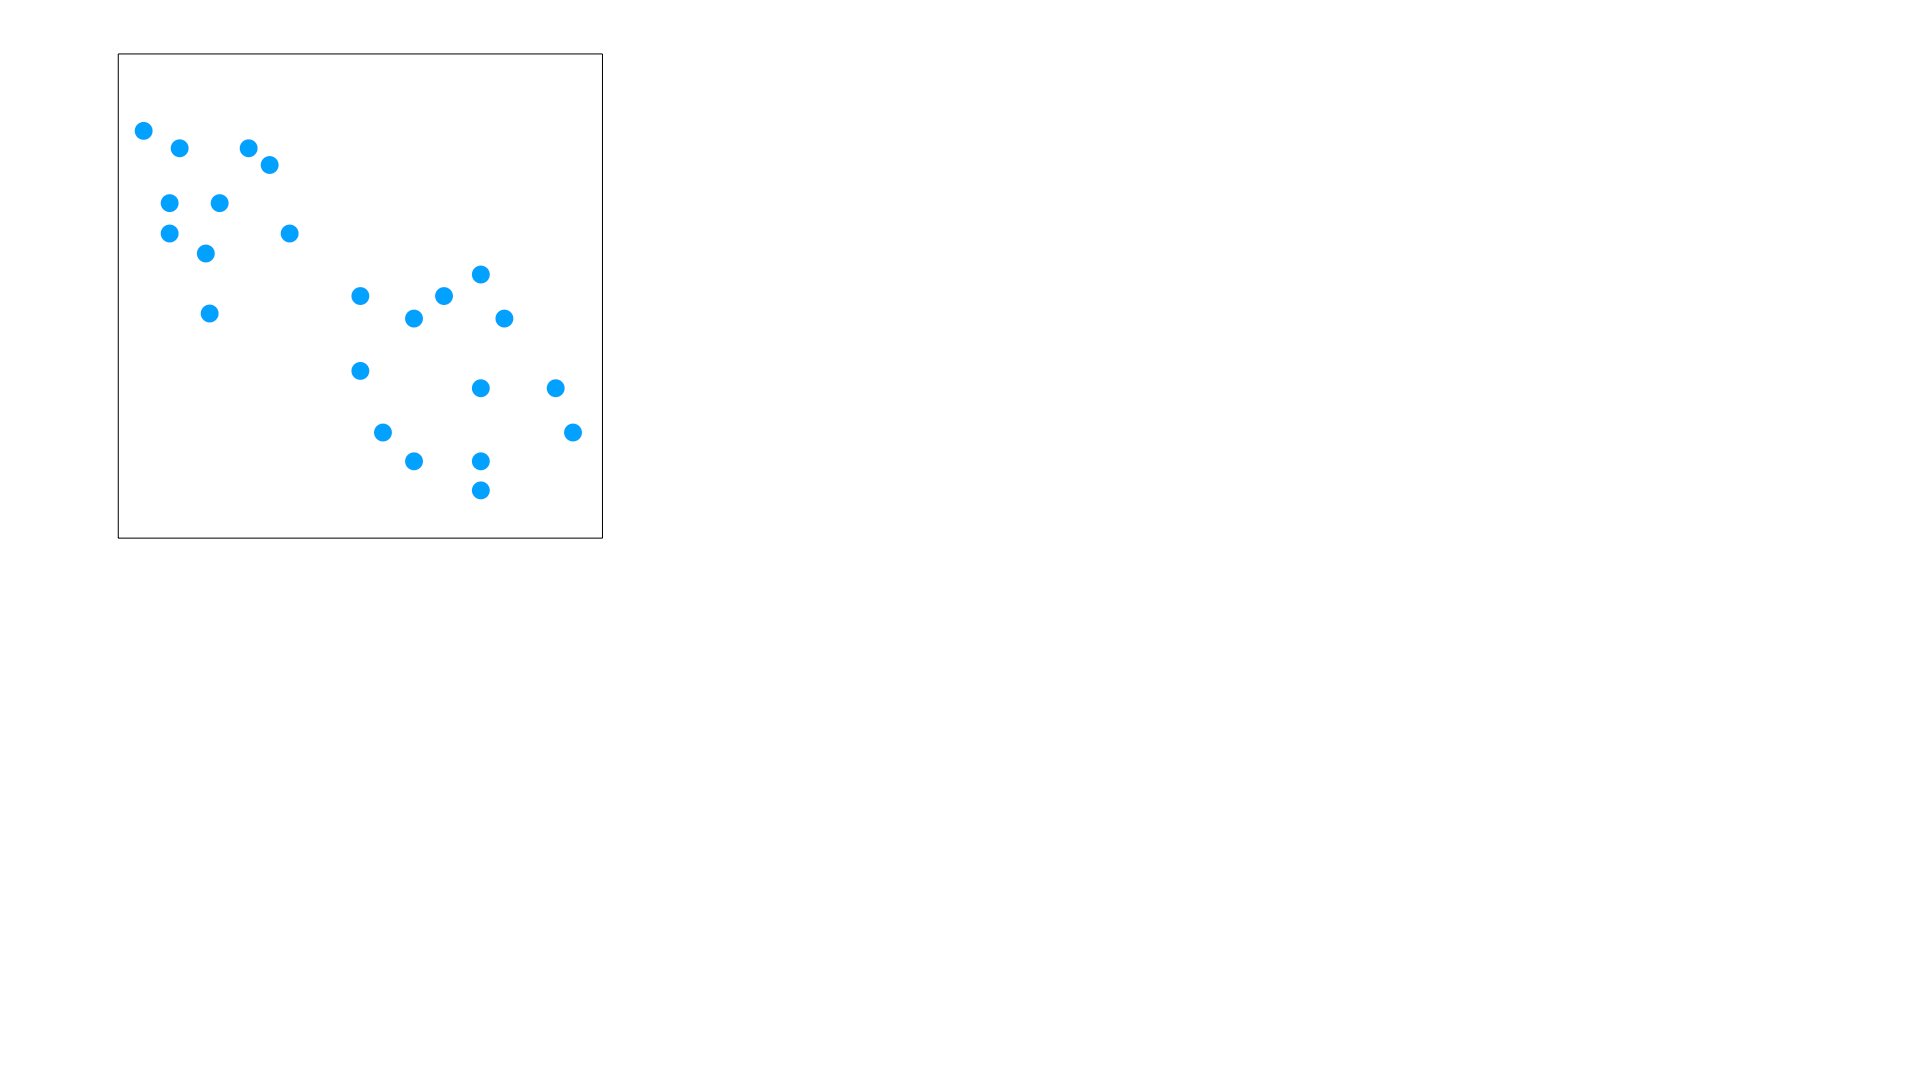
k-means clustering
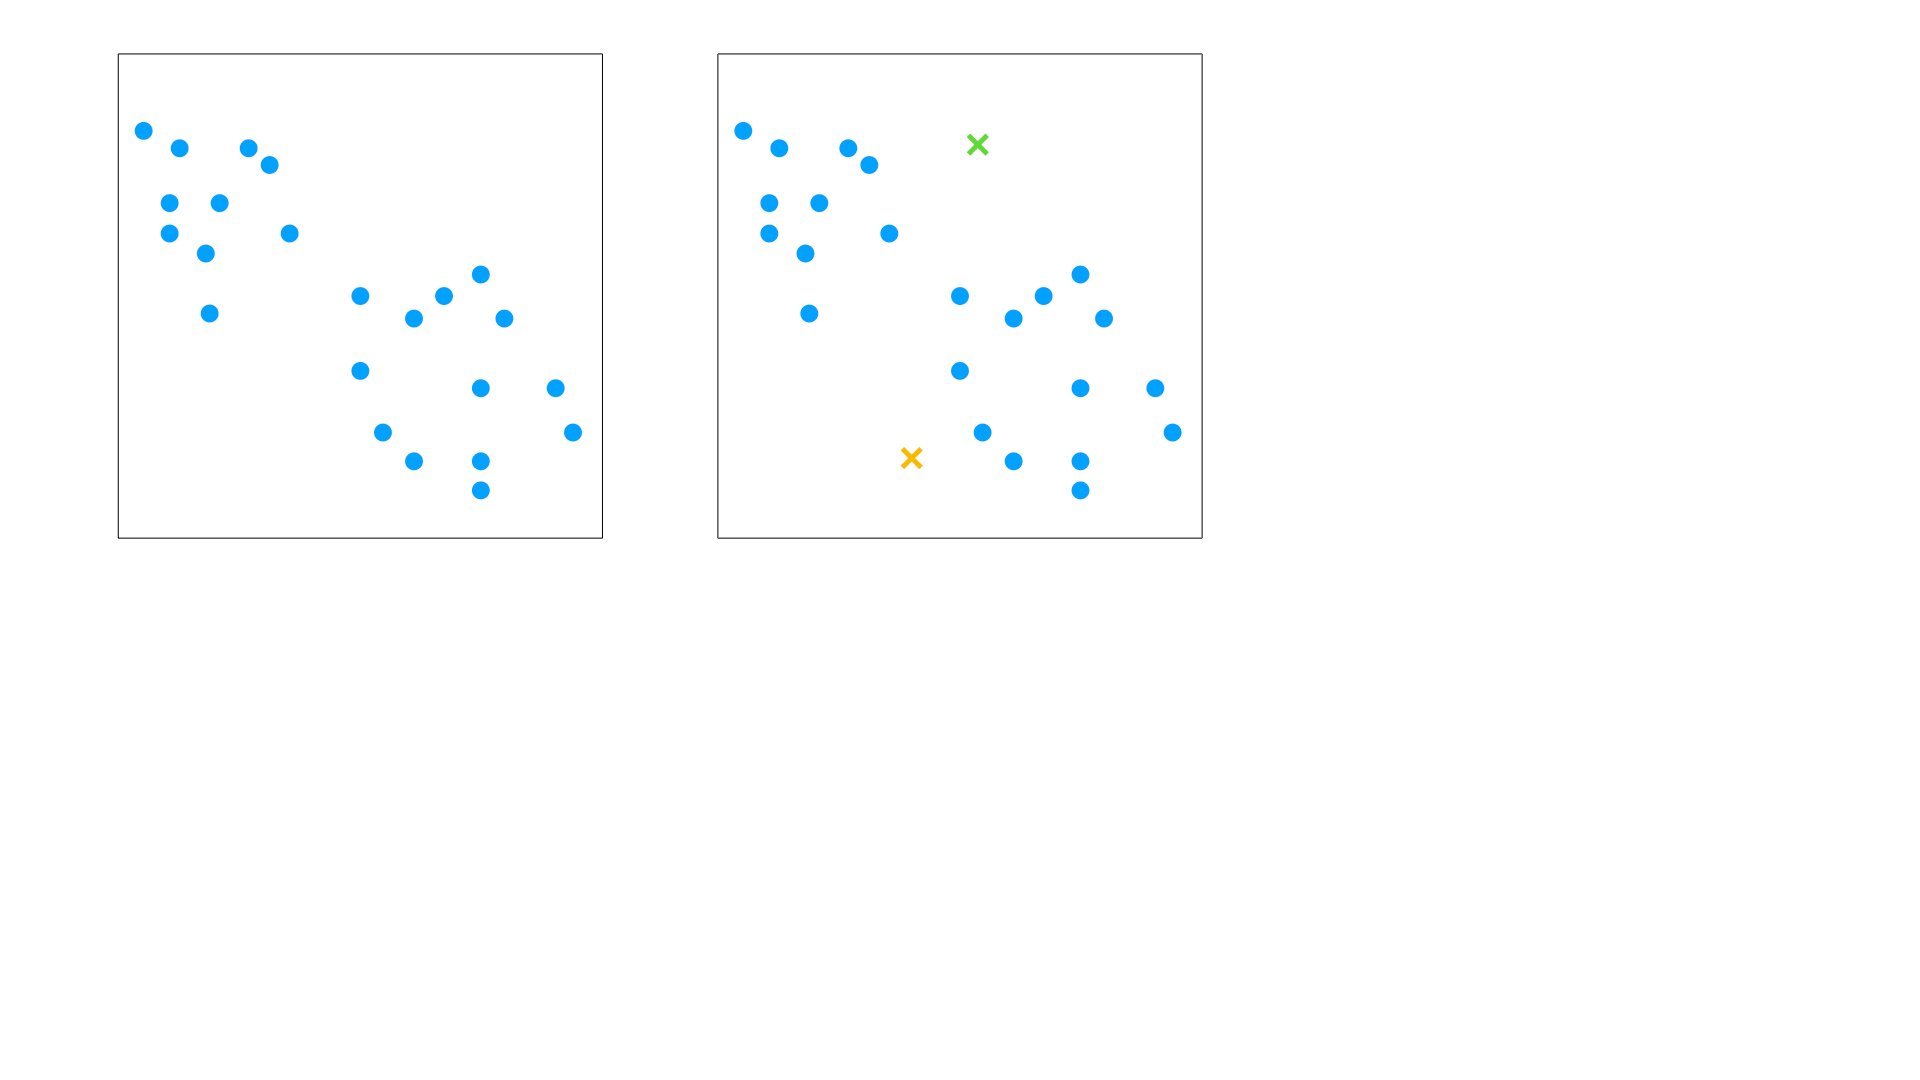
k-means clustering
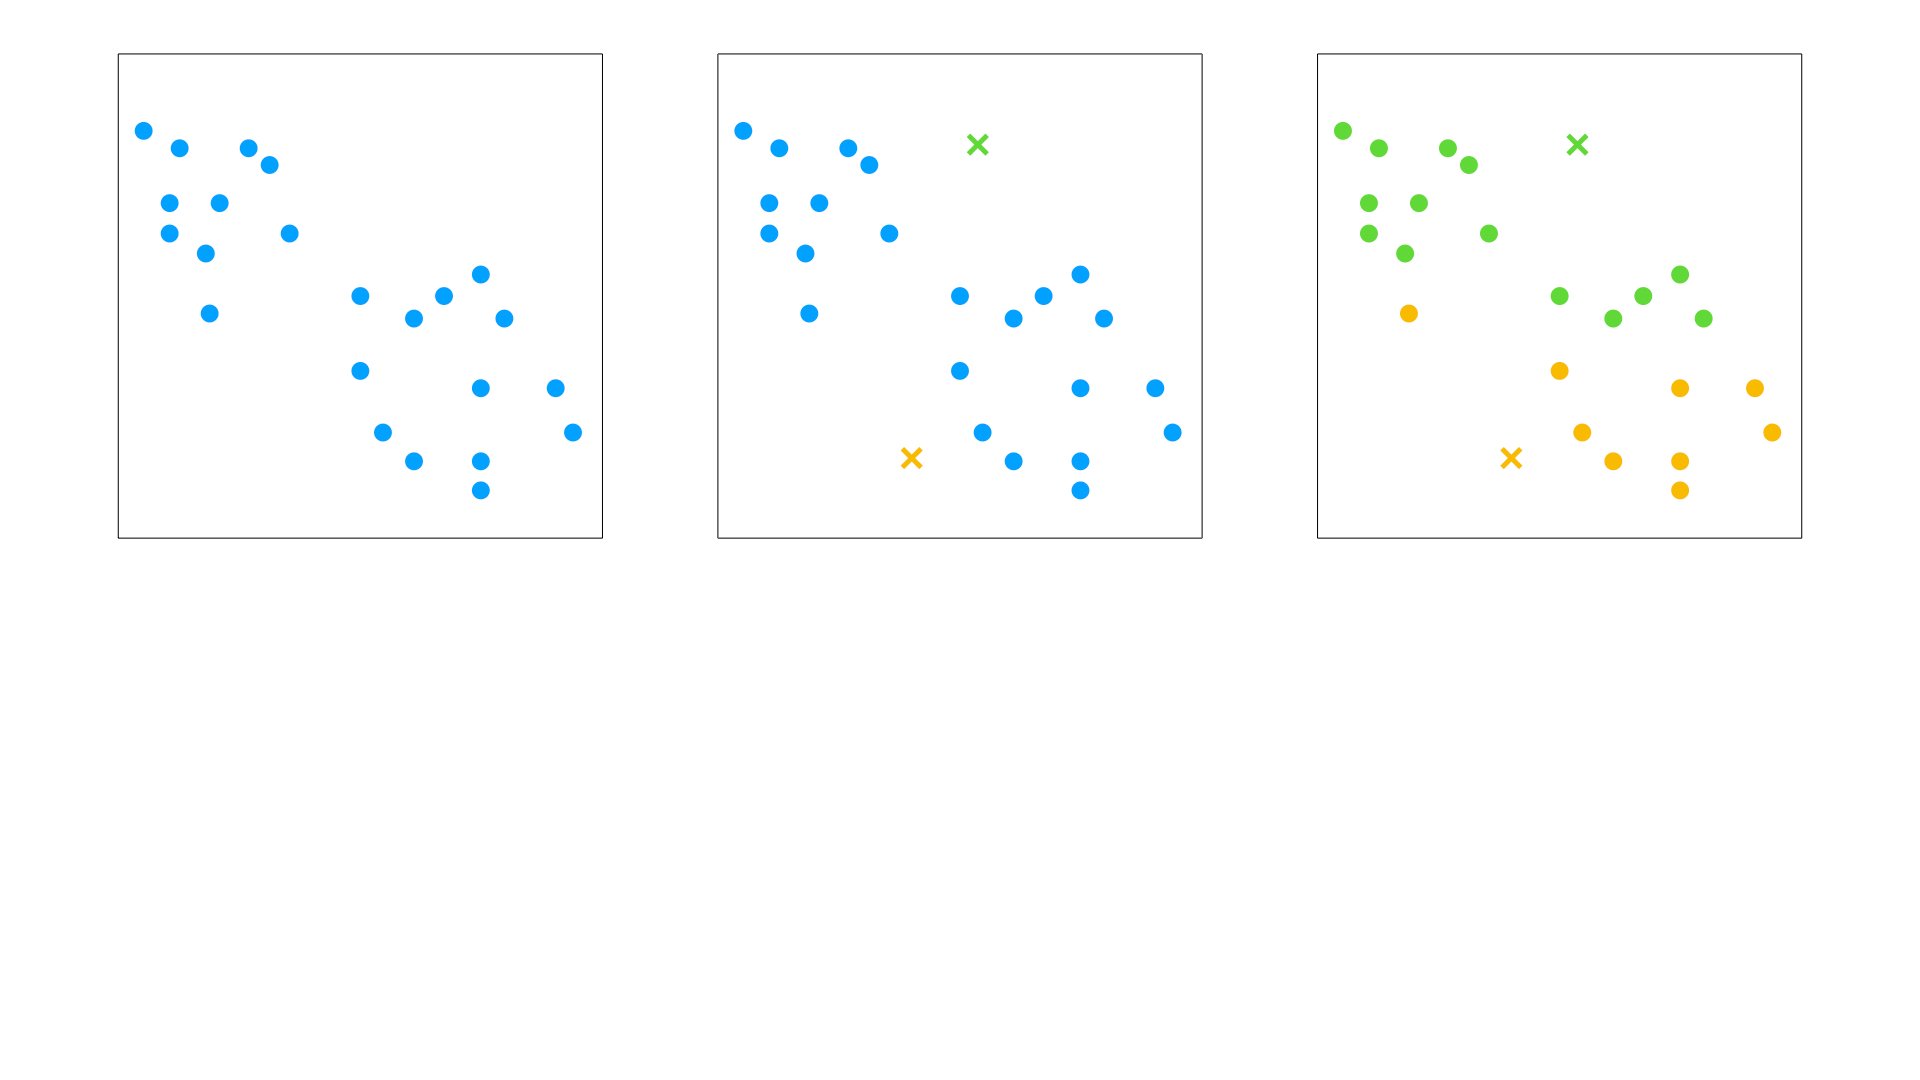
k-means clustering
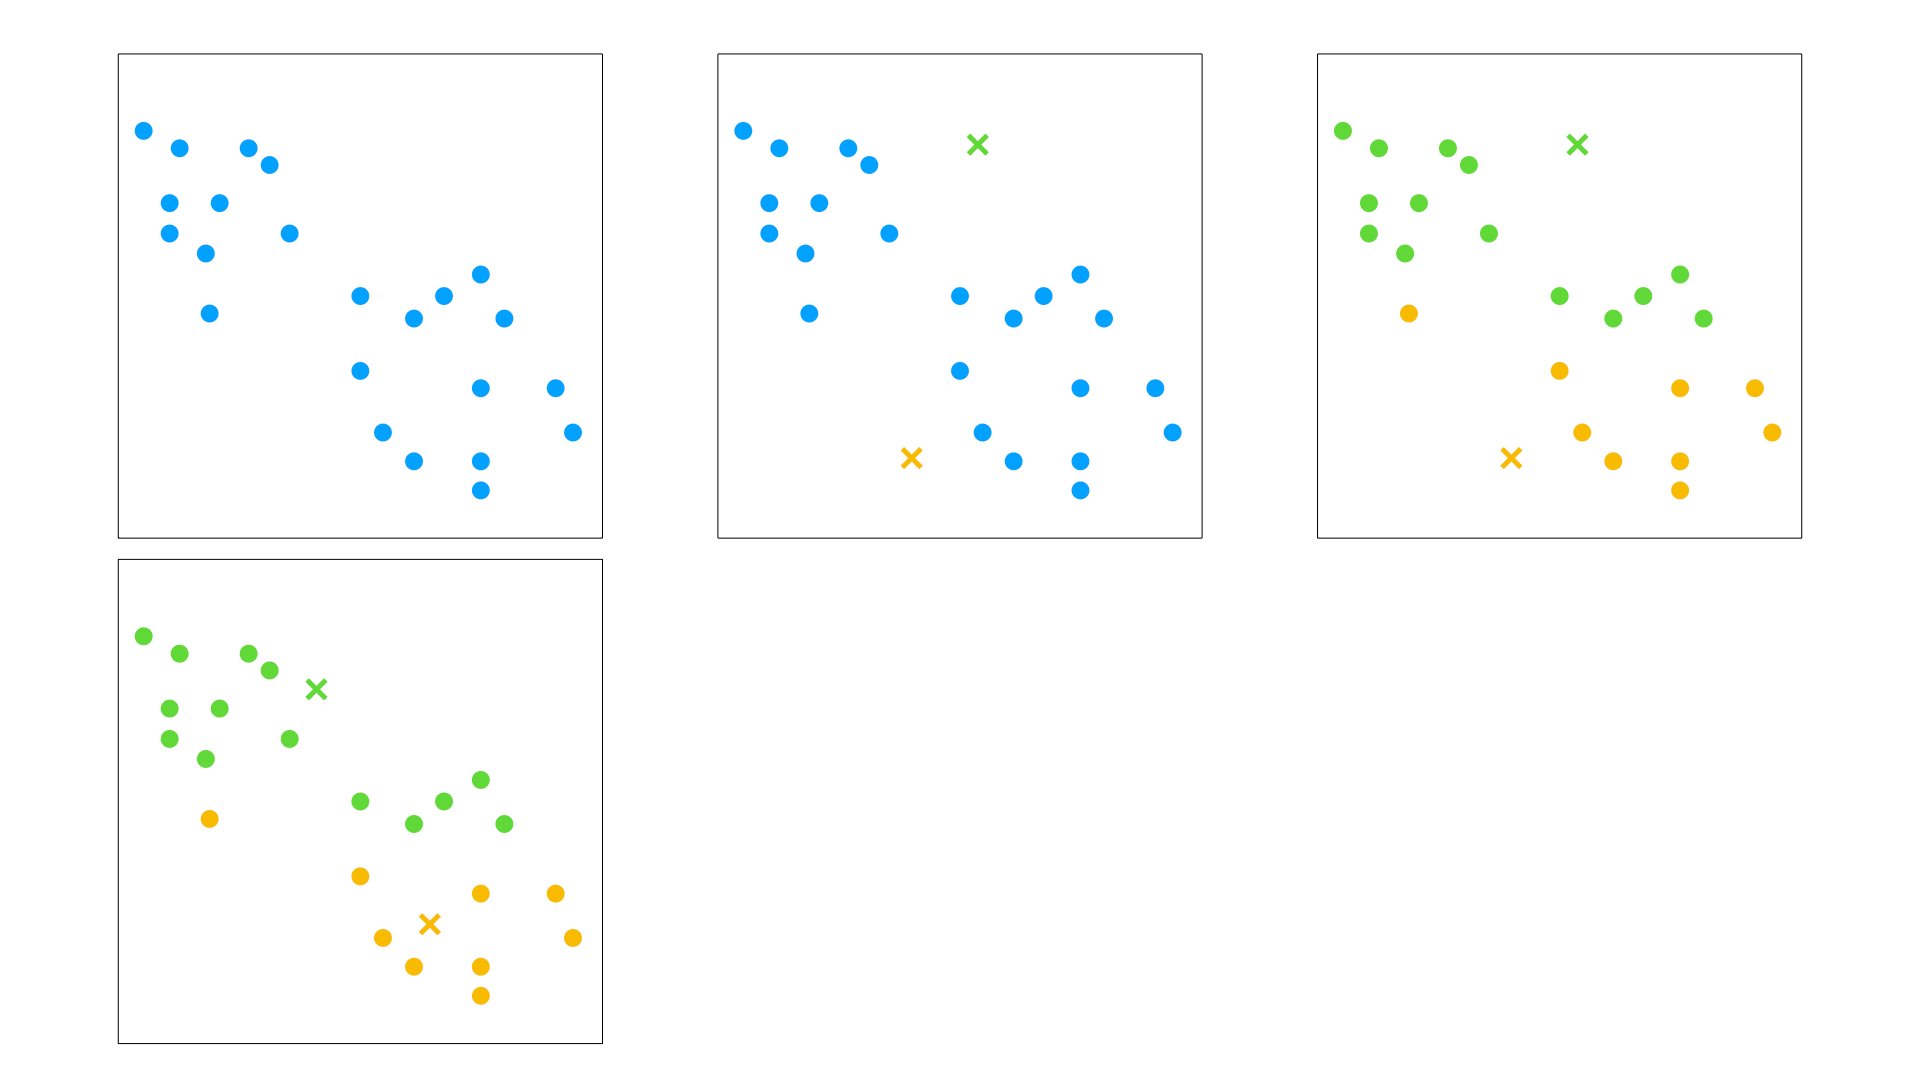
k-means clustering
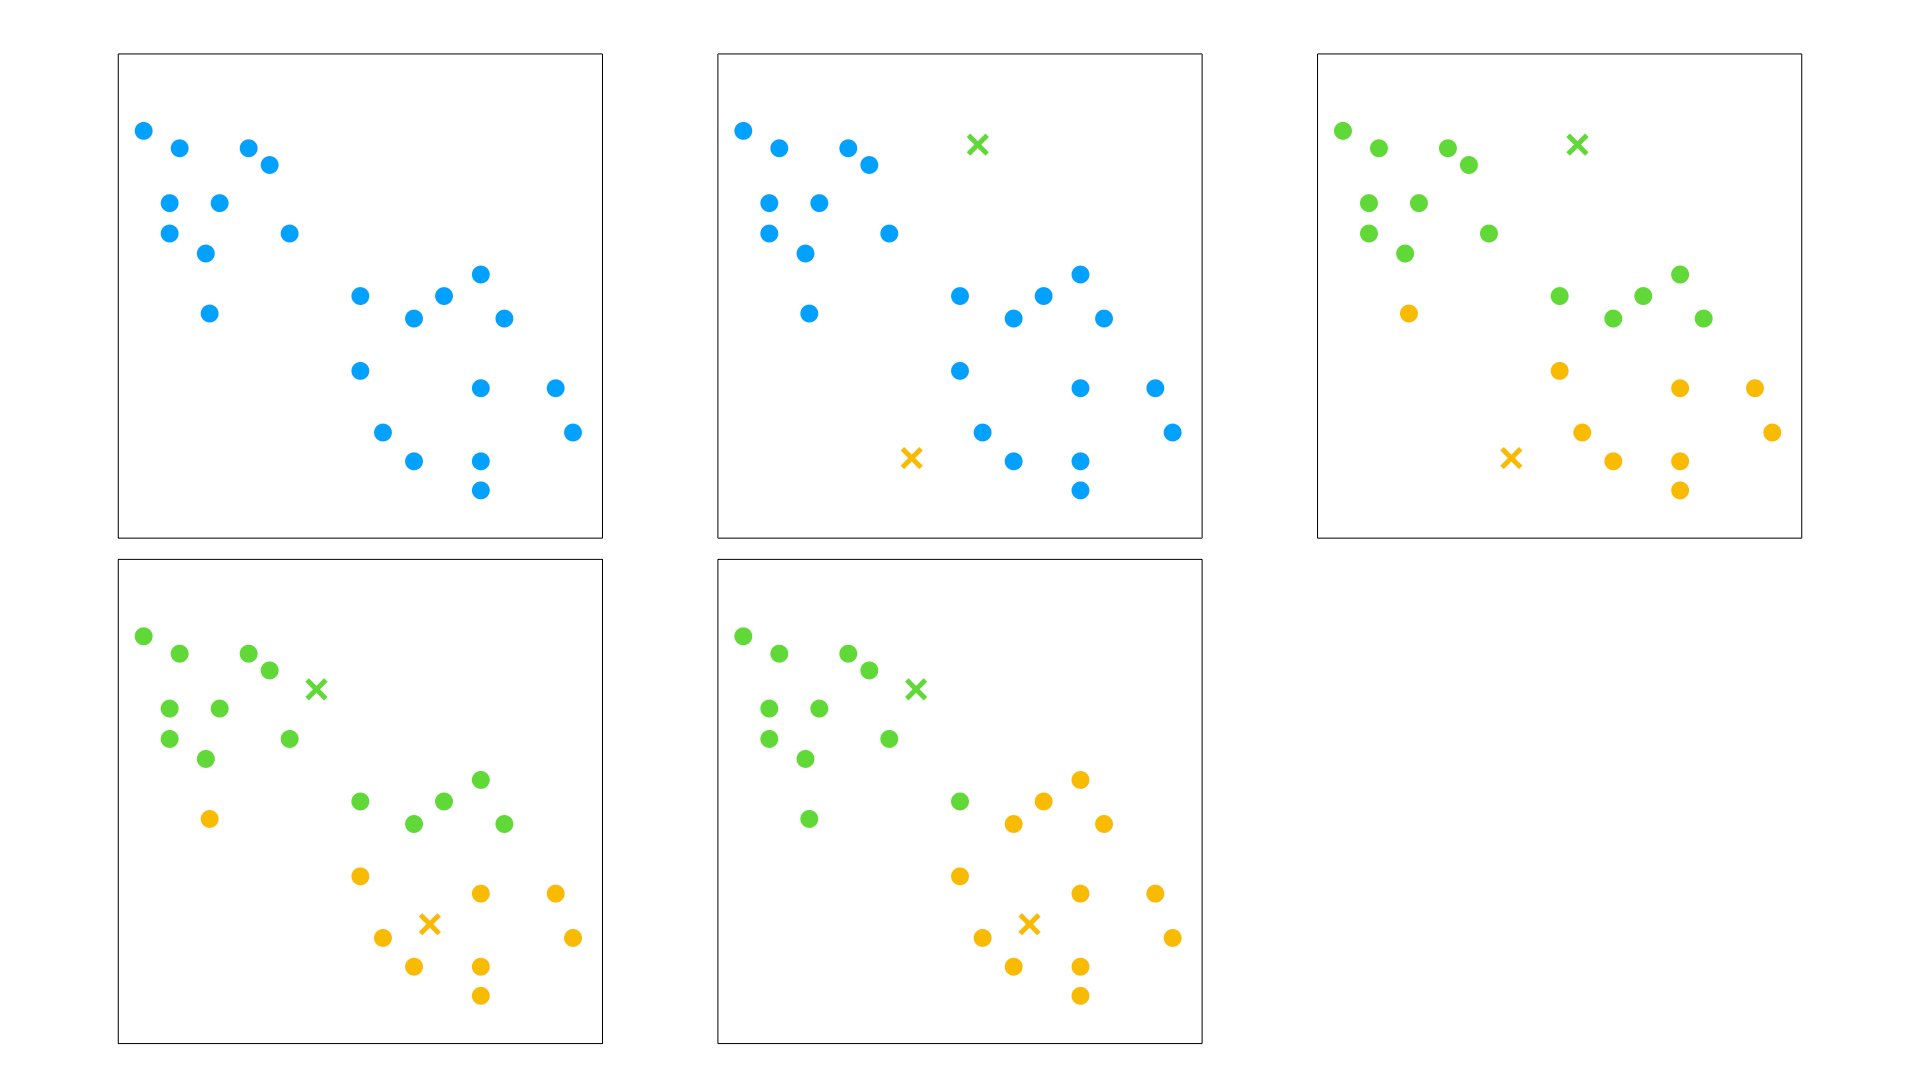
k-means clustering
Assess clustering quality
Between-group sum of squares
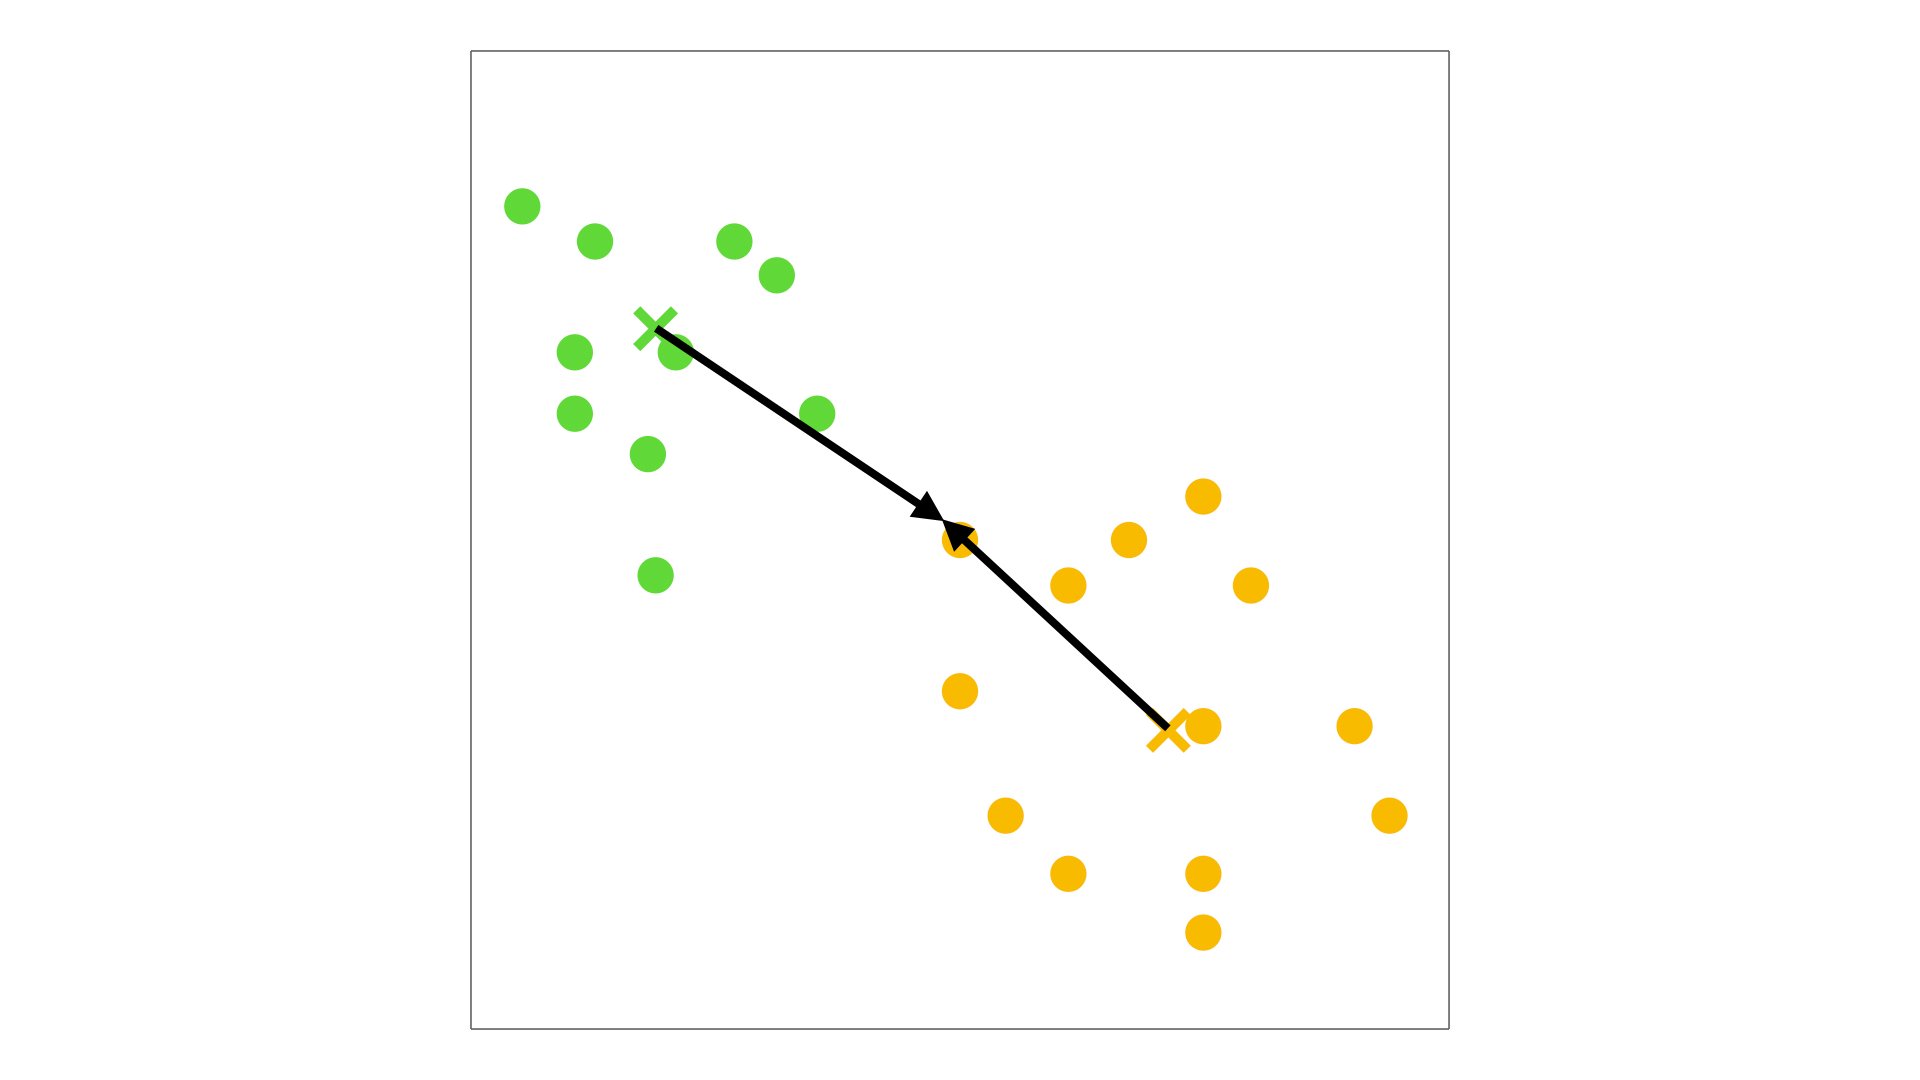
- The higher, the better
Within-group sum of squares
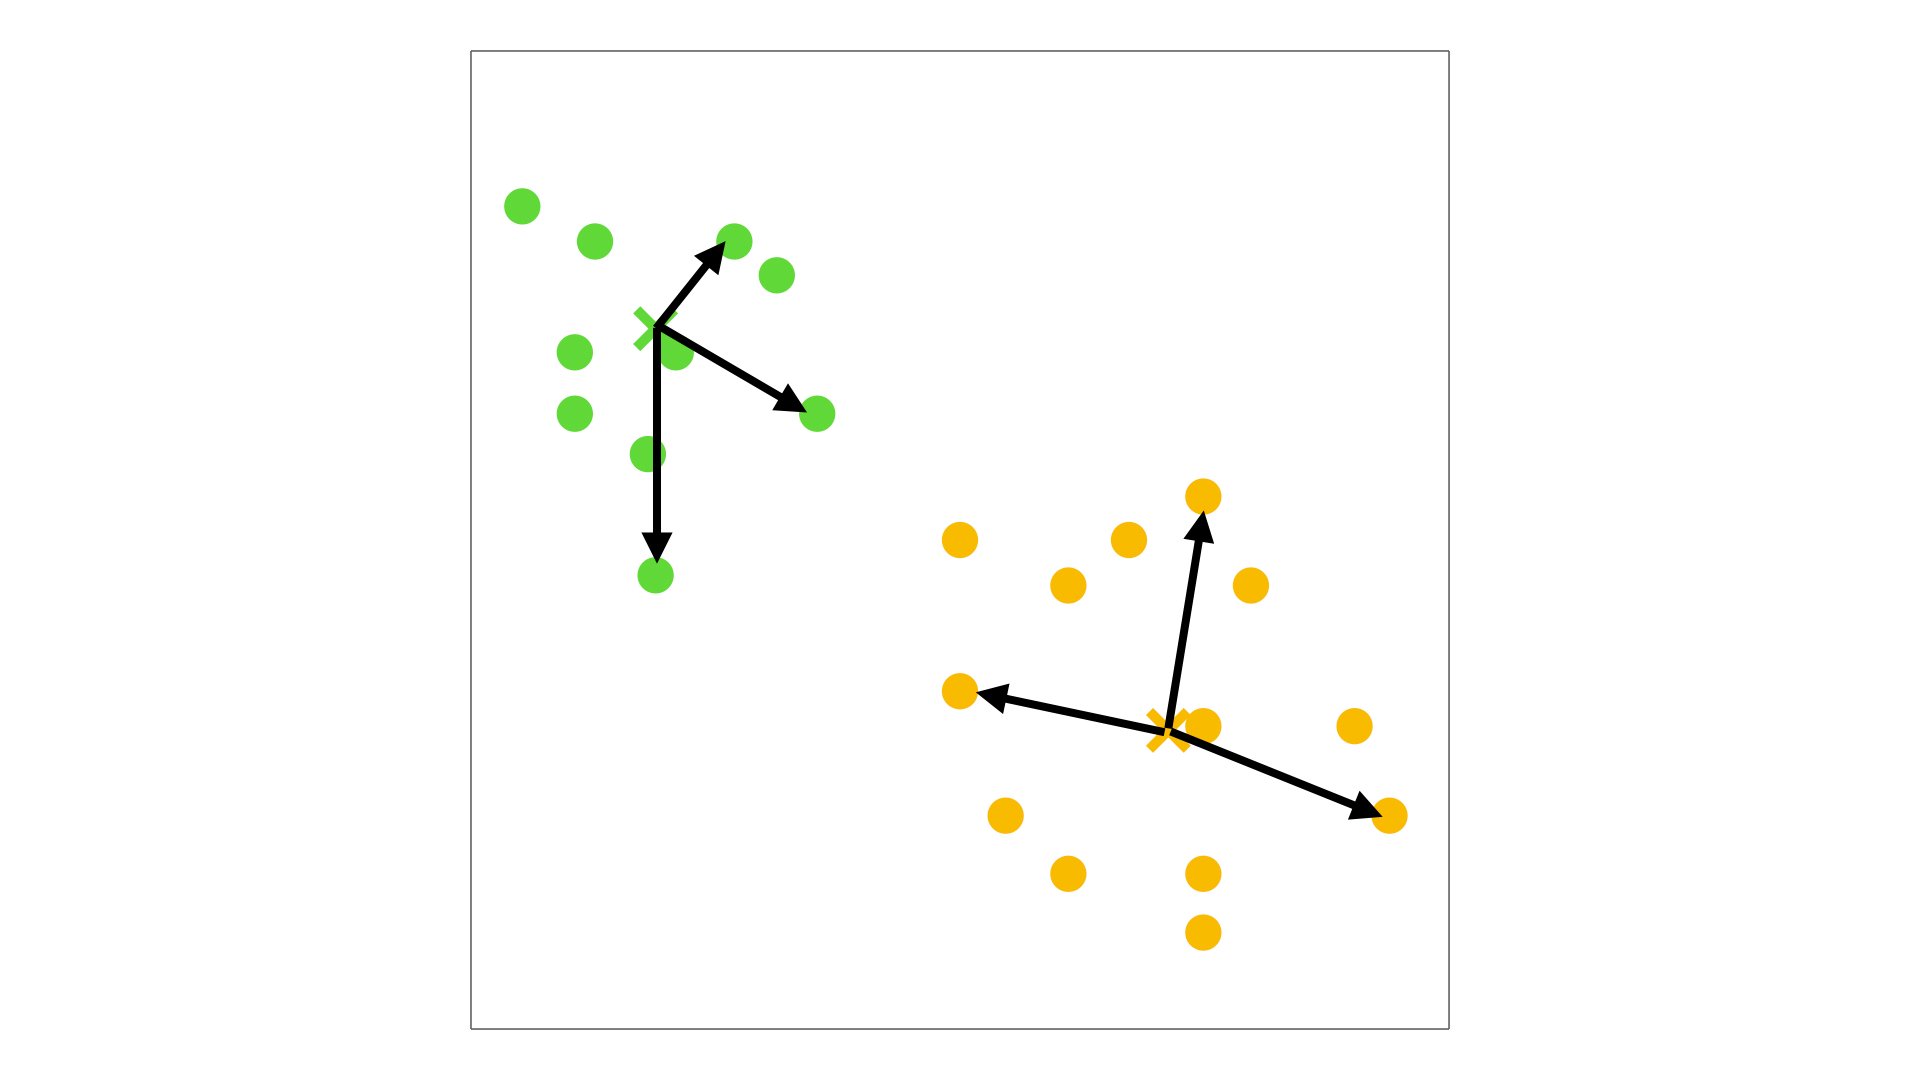
- The lower, the better

