Wrap-up video
Building Dashboards with Dash and Plotly

Alex Scriven
Data Scientist
Chapter 1
Chapter 2
Chapter 3
Chapter 4
Next steps?
Plotly Studio
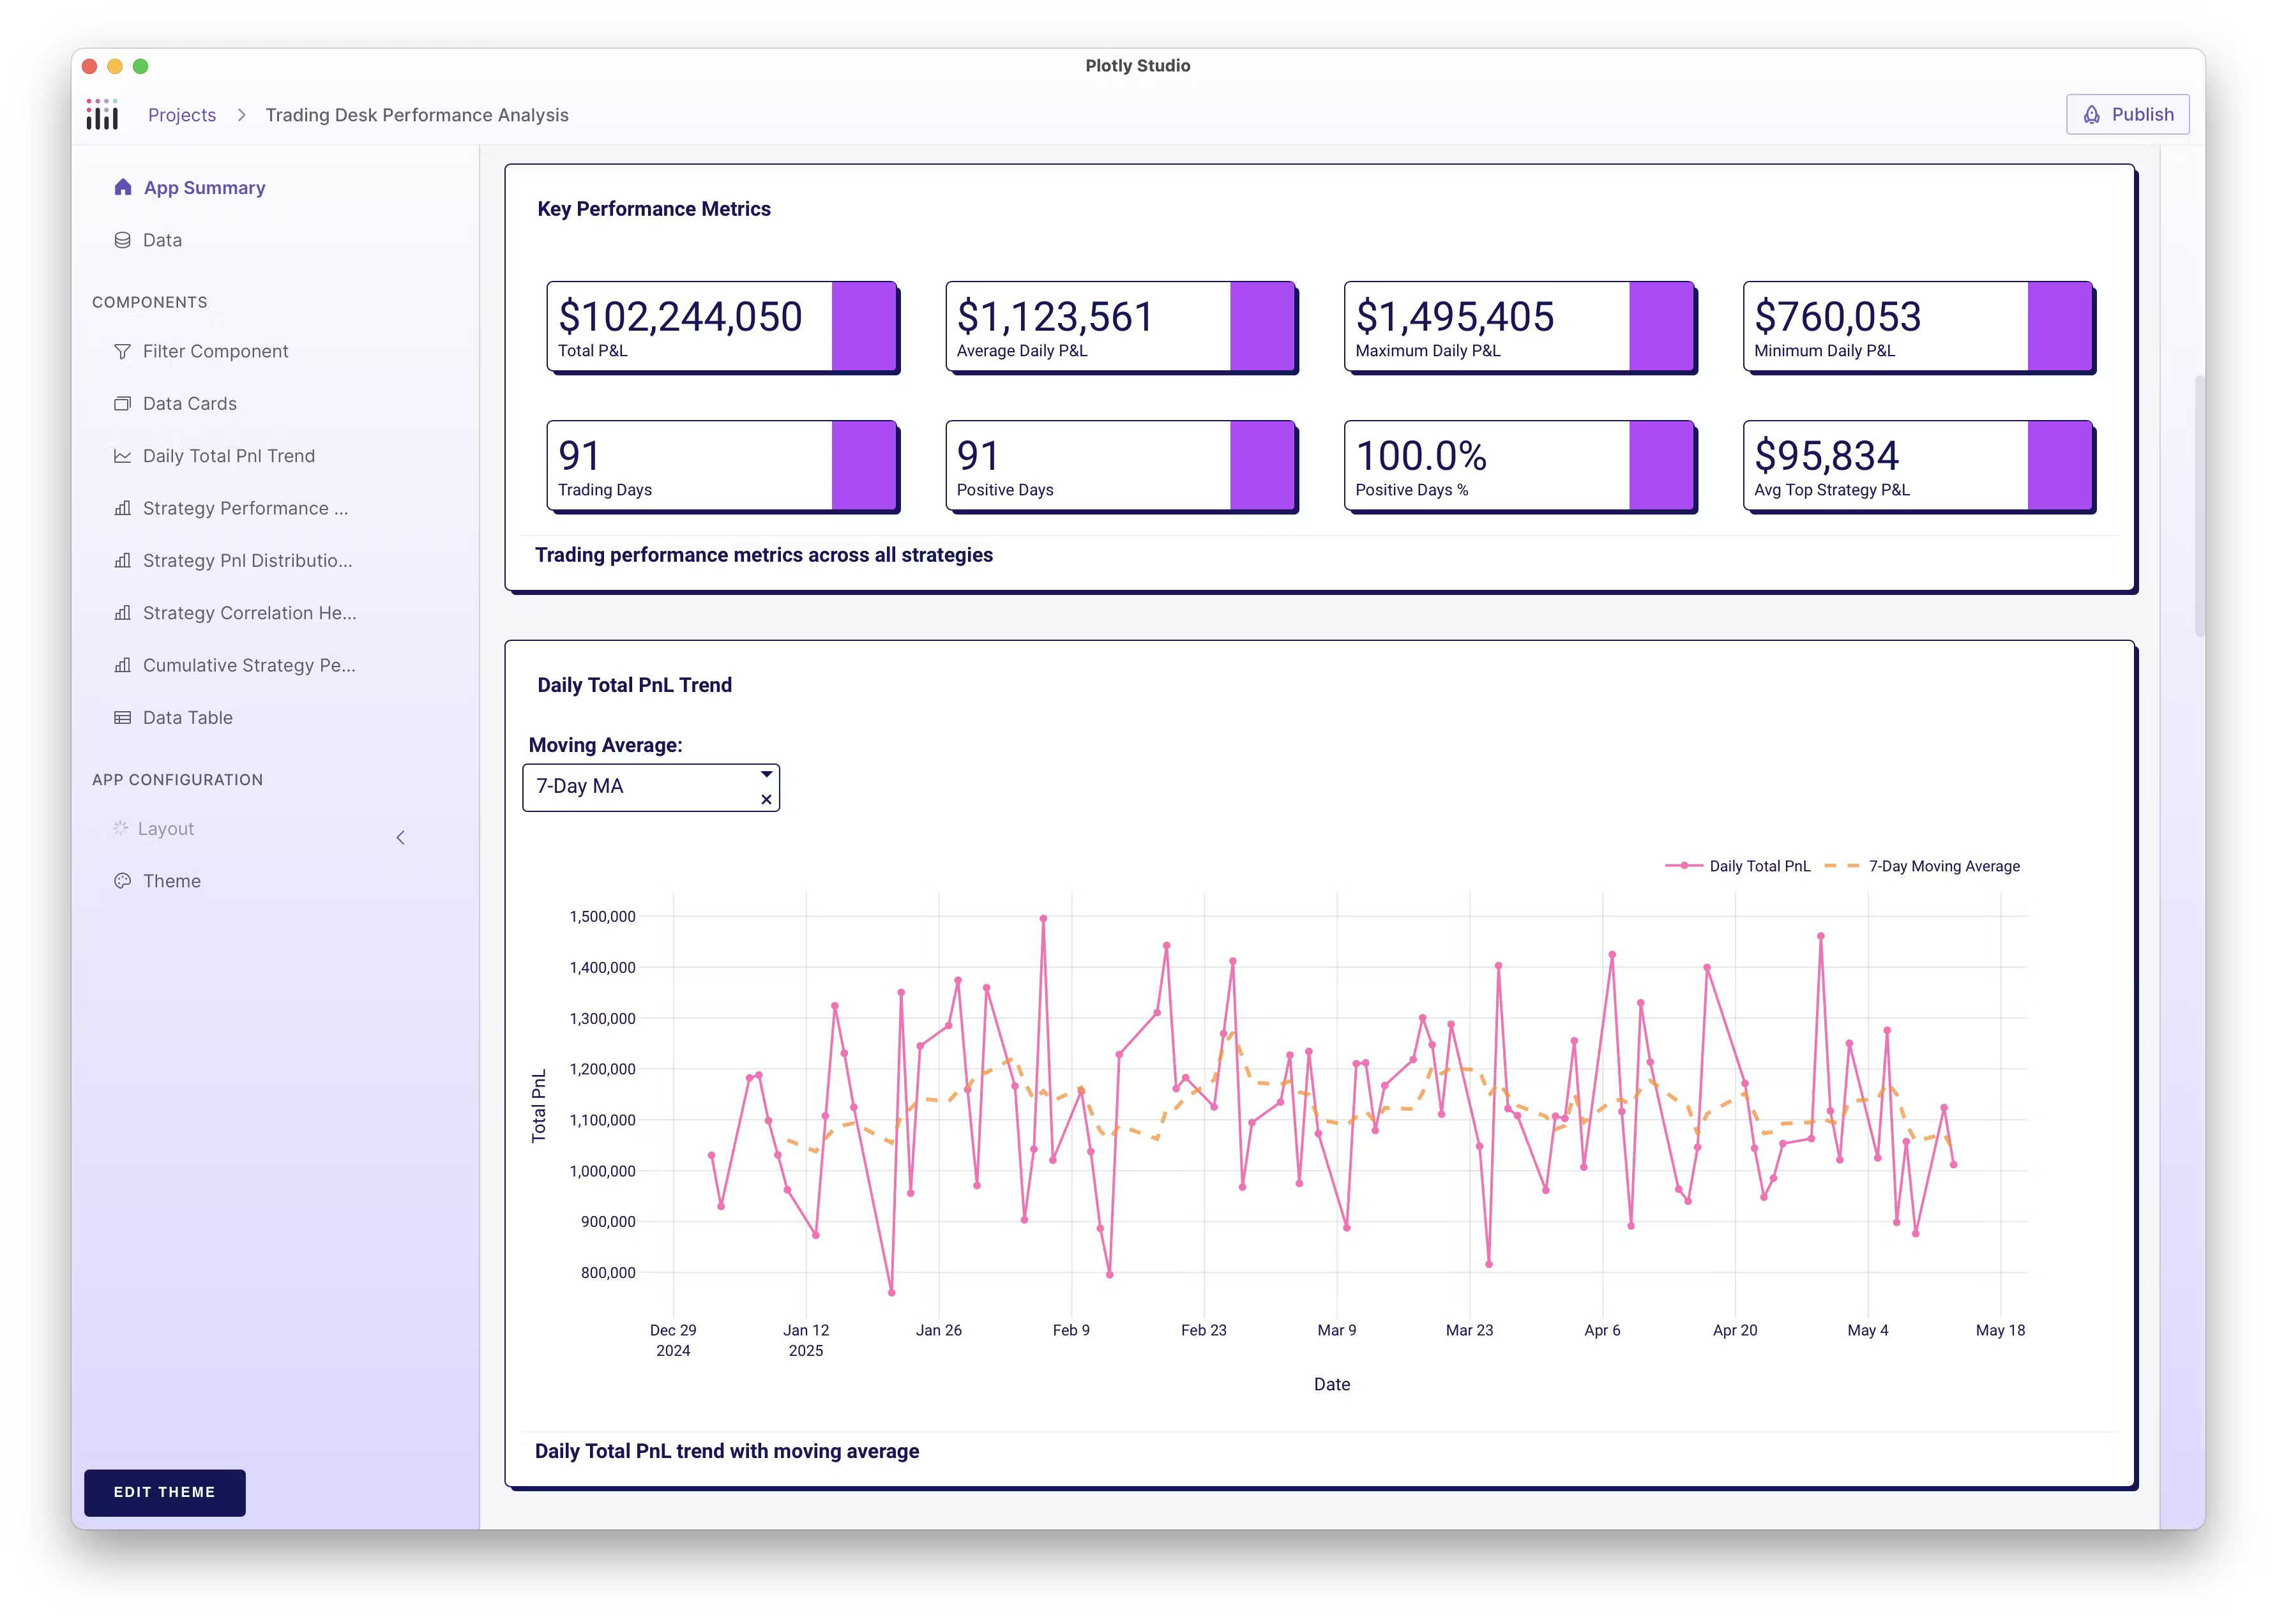
1 plotly.com/studio
Building Dashboards with Dash and Plotly
Alex Scriven
Data Scientist

