Interactive components

Building Dashboards with Dash and Plotly

Alex Scriven

Data Scientist

Enhancing Interactivity


  • Some useful interactive components:
    • dcc.Checklist() = Checkboxes
    • dcc.RadioItems() = Radio buttons
    • dcc.Slider() / dcc.RangeSlider() = Slider selectors
    • dcc.DatePickerSingle() / dcc.DatePickerRange() = Similar to sliders but for dates
Building Dashboards with Dash and Plotly

Sliders


  • Slider: drag and move for a single value


  • Range Slider: drag and move for two values
  • Reminder: Can link to callback
    • Update plots or components


A slider:

A gif of a blue slider on a black background with some text below stating what value has been selected. The mouse takes the slider notch and slides it up a few places, causing the value noted below to increase.

A range slider:

A gif of a blue range slider on a black background with some text below stating what two values have been selected. The mouse takes each side of the slider notch and slides it up and down a few places, causing the values noted below to change.

Building Dashboards with Dash and Plotly

Sliders in Dash


dcc.Slider(

min=10, max=50,
value=45,
step=5,
vertical=False
)


Key arguments:

  • min/max : Bounds of slider
  • value : Starting selection
  • step : Increment for each notch
  • vertical : To make horizontal or vertical
Building Dashboards with Dash and Plotly

Date pickers in Dash

DatePickerSingle: Select a single date

dcc.DatePickerSingle(
  date=date(2021, 7, 1),
  initial_visible_month=datetime.now(),
)
  • date = starting selection
  • initial_visible_month = month shown in popup
  • Optionally limit min_date_allowed and max_date_allowed

A gif of a common date picker example. There is a date input field with the 1st of July 2021 as the current date. The mouse clicks this, and a calendar appears. A different date is selected, July 2, 2021, and the expanded calendar collapses and the noted date in the selector has changed.

Building Dashboards with Dash and Plotly

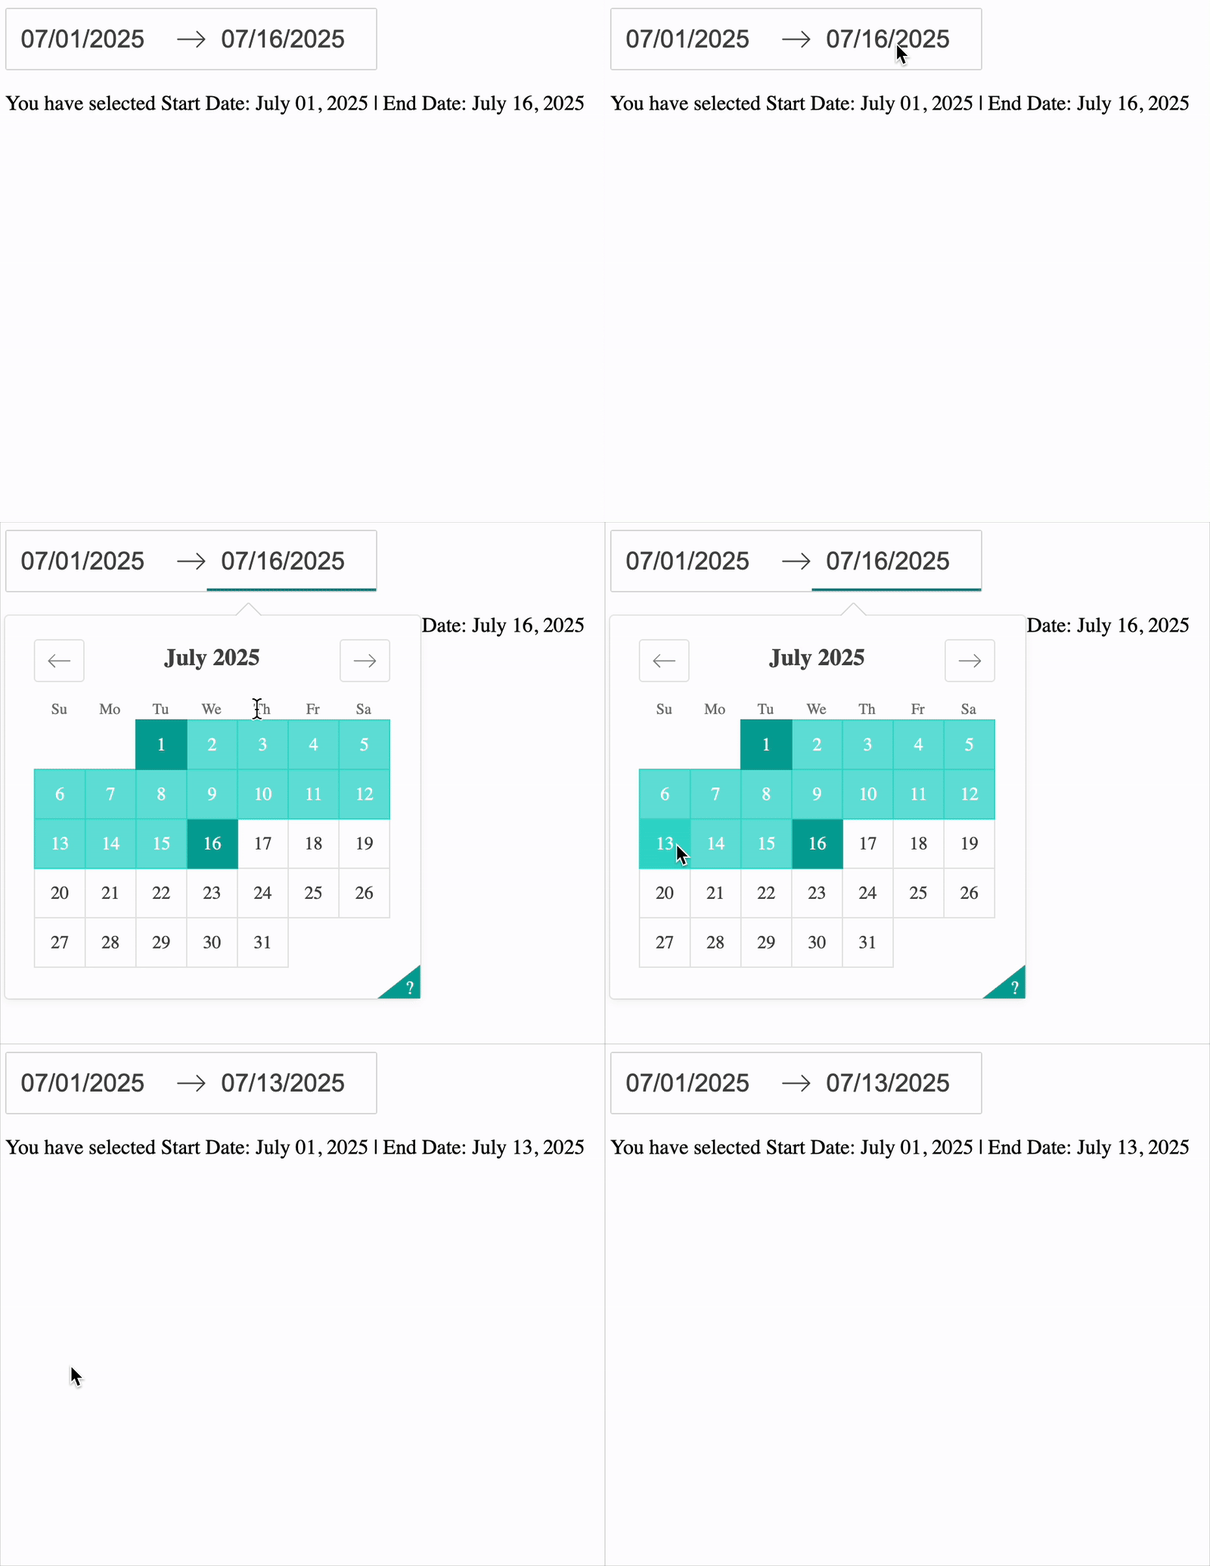
Date Range Picker


  • Similar to DatePickerSingle
    dcc.DatePickerRange(
    initial_visible_month=datetime.now(),
    start_date=date(2021, 7, 1),
    end_date=date(2021, 7, 14),
    )
    
  • Set an initial start_date and end_date


A gif of a common date picker example. There are two date input fields with the dates of 1st of July 2021 and 14th of July 2021 selected. The mouse clicks the second input, and a calendar appears, which already has highlighted in green all days between the 1st and 14th of July. A different date is selected, July 28th, 2021, and the calendar collapses and the noted date in the second selector has changed.

Building Dashboards with Dash and Plotly

Updating plots


# dcc.DatePickerSingle(id='sale_date')
# dcc.Graph(id='sales_cat')

@app.callback( Output(component_id='sales_cat', component_property='figure'), Input(component_id='sale_date', component_property='date'))
def update_plot(input_date): sales = ecom_sales.copy(deep=True)
if input_date: sales = sales[sales['InvoiceDate'] == input_date]
# Create fig return fig


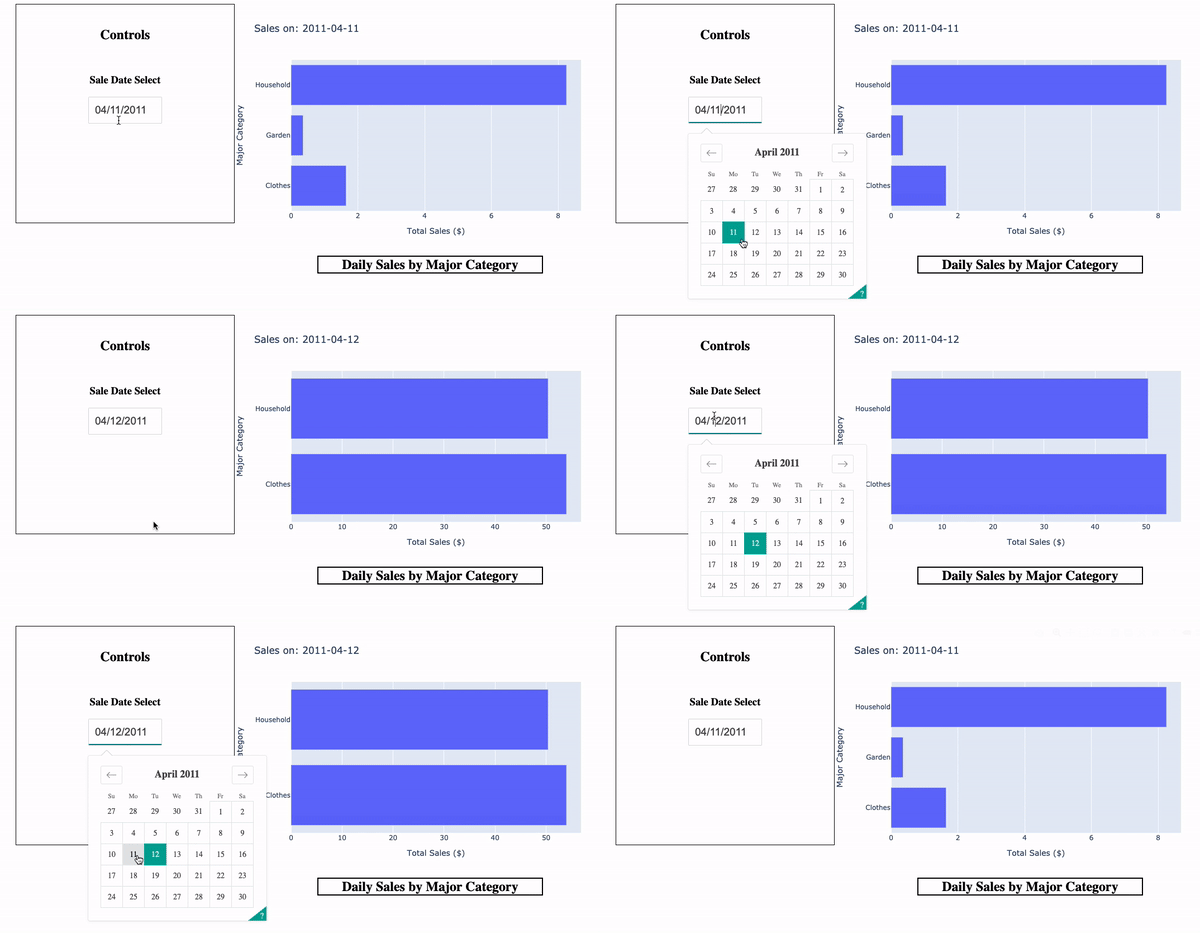
A gif of a date picker being used in Dash. On the left is a box with the title 'Controls', and inside is a date picker with the title 'Sale Date Select'. The date picker has the date 04/11/2011 selected. To the right of this, outside the box, is a bar chart with "Total Sales ($) on the x-axis and "Major Category" on the y-axis. There is a title below this graph noting "Daily Sales by Major Category," and the title of the graph itself is "Sales on 2011-04-11". The mouse clicks into the date selector and selects the next day, the 11th of April 2011. This causes the bar chart to change to different columns and sizes and the title of the Bar chart to change to reflect this date.

Building Dashboards with Dash and Plotly

Let's practice!

Building Dashboards with Dash and Plotly

Preparing Video For Download...