Between-element interactivity

Building Dashboards with Dash and Plotly

Alex Scriven

Data Scientist

What is between-element?


  • Previously: Interact with input (e.g., dropdown); to trigger change in a figure
  • Now: Interact with figure; to trigger change in a figure
  • Two specific ways:
    • Hover to filter and regenerate (via callback)
    • Click to filter and regenerate (via callback)
Building Dashboards with Dash and Plotly

The hoverData property

A familiar bar chart and text component:

# Create figure & dash.Dash()
html.Div(children=[
   dcc.Graph(id='bar_fig', 
             figure=ecom_bar),

html.Br(), html.H2("The Hover Data:"), html.P(id='text_output')

Set up a callback

@app.callback(
    Output('text_output', 'children'),
    Input('bar_fig', 'hoverData'))

def capture_hover_data(hoverData): return str(hoverData)
Building Dashboards with Dash and Plotly

Our first hover


What happens:

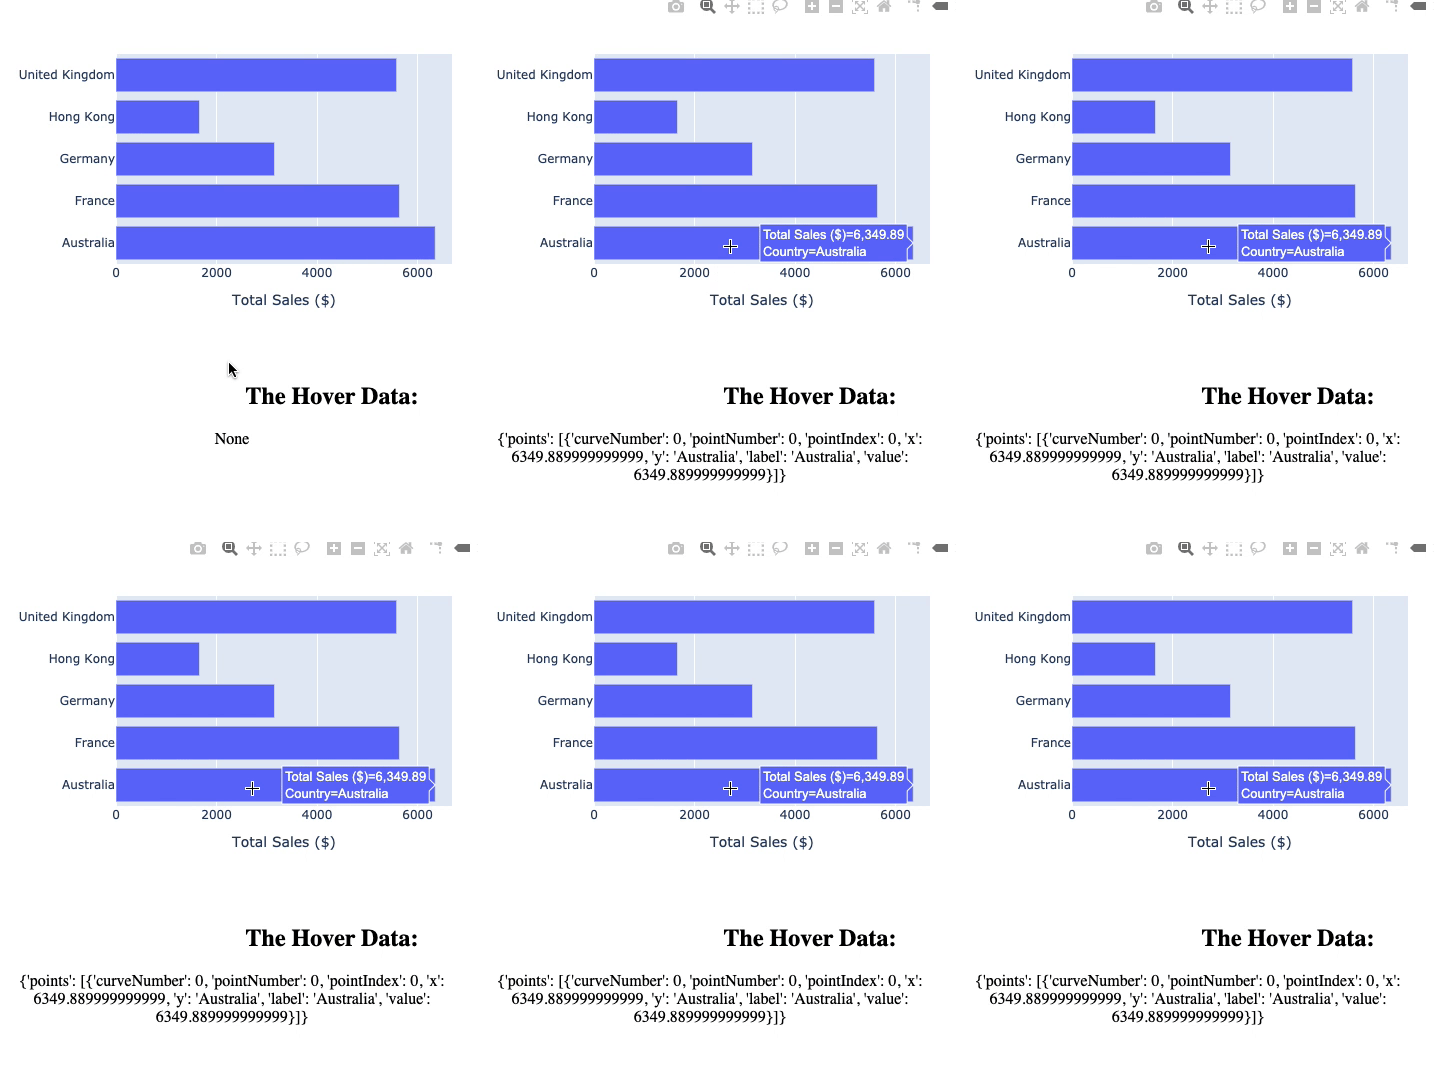
  • User hovers: hoverData property of the figure changes
  • Callback takes and returns this to .P() tag
  • We can see point-related information
    • Now: Use that information!

A gif of a horizontal bar chart of total sales (x-axis) vs. Country (y-axis) with the text "hover data" below it, which has the word "none" below that. As the mouse hovers over the bottom bar, for Australia, the text none changes to a dictionary that contains details of the point hovered over including the country label and the value.

Building Dashboards with Dash and Plotly

Beware missing info


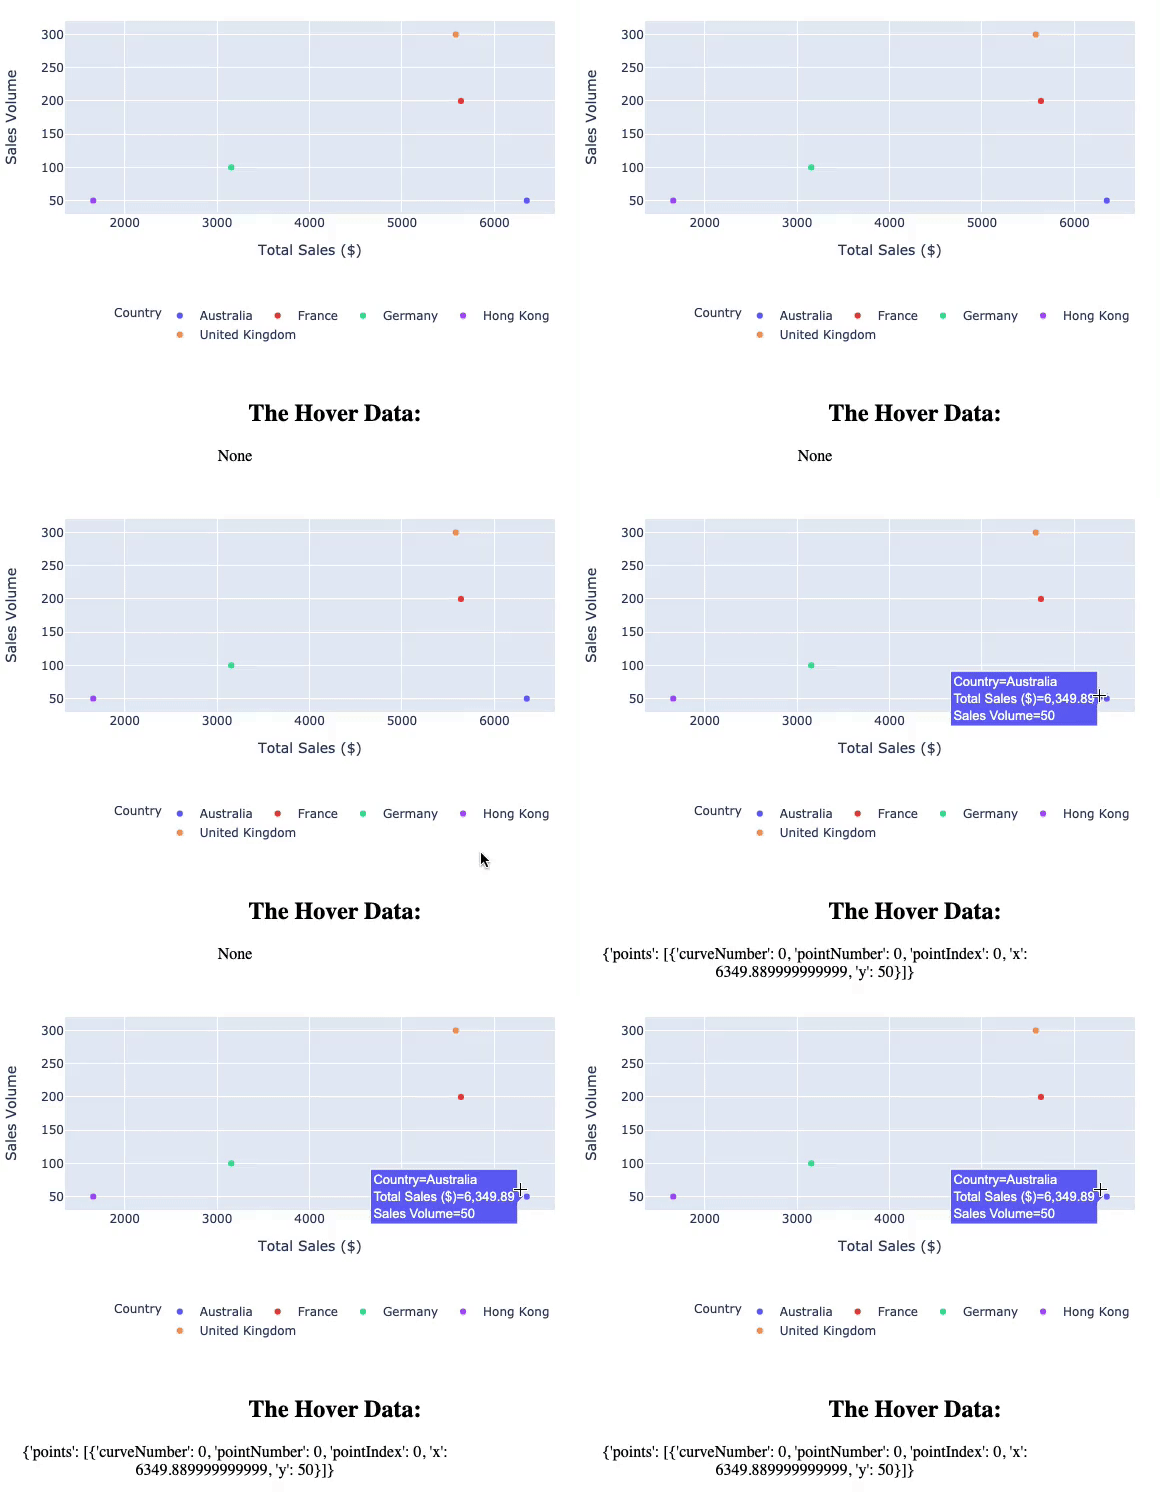
  • Aim: Use 'country' in the callback (filter and regenerate a graph)
    • Previous example - in hoverData
  • See this scatter plot (graph type and relevant ID's updated)
    • There is no country!

A gif of a scatter chart of total sales (x-axis) vs. sales volume (y-axis) where the points are each a different country with the text "hover data" below it which has the word "none" below that. As the mouse hovers over a point, for Australia, the text none changes to a dictionary that contains details of the point hovered over including then two values but it crucially doesn't contain the word Australia

Building Dashboards with Dash and Plotly

Adding custom data


ecom_scatter = px.scatter(ecom_data, 
    x='Total Sales ($)', 
    y='Sales Volume', color='Country',
    custom_data=['Country'])
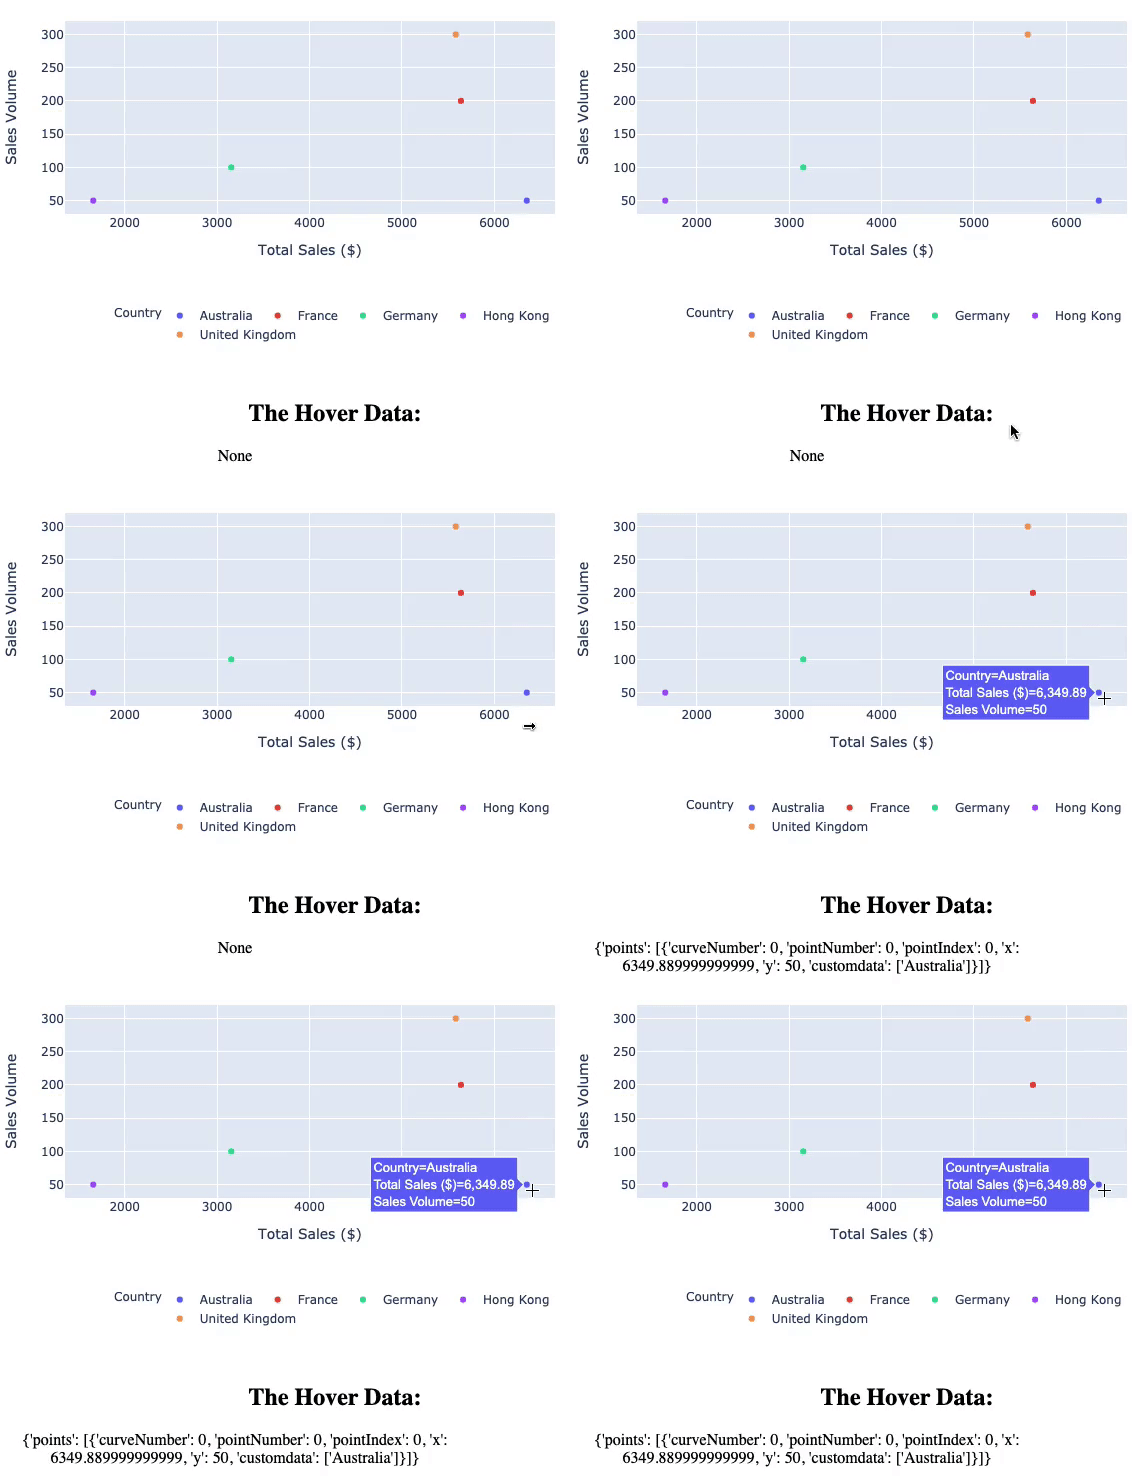
  • Now customData contains the country!

A gif of a scatter chart of total sales (x-axis) vs. sales volume (y-axis) where the points are each a different country with the text "hover data" below it which has the word "none" below that. As the mouse hovers over a point, for Australia, the text none changes to a dictionary that contains details of the point hovered over including then two values and this time, in the customdata property it contains the word Australia

Building Dashboards with Dash and Plotly

What about clicking?


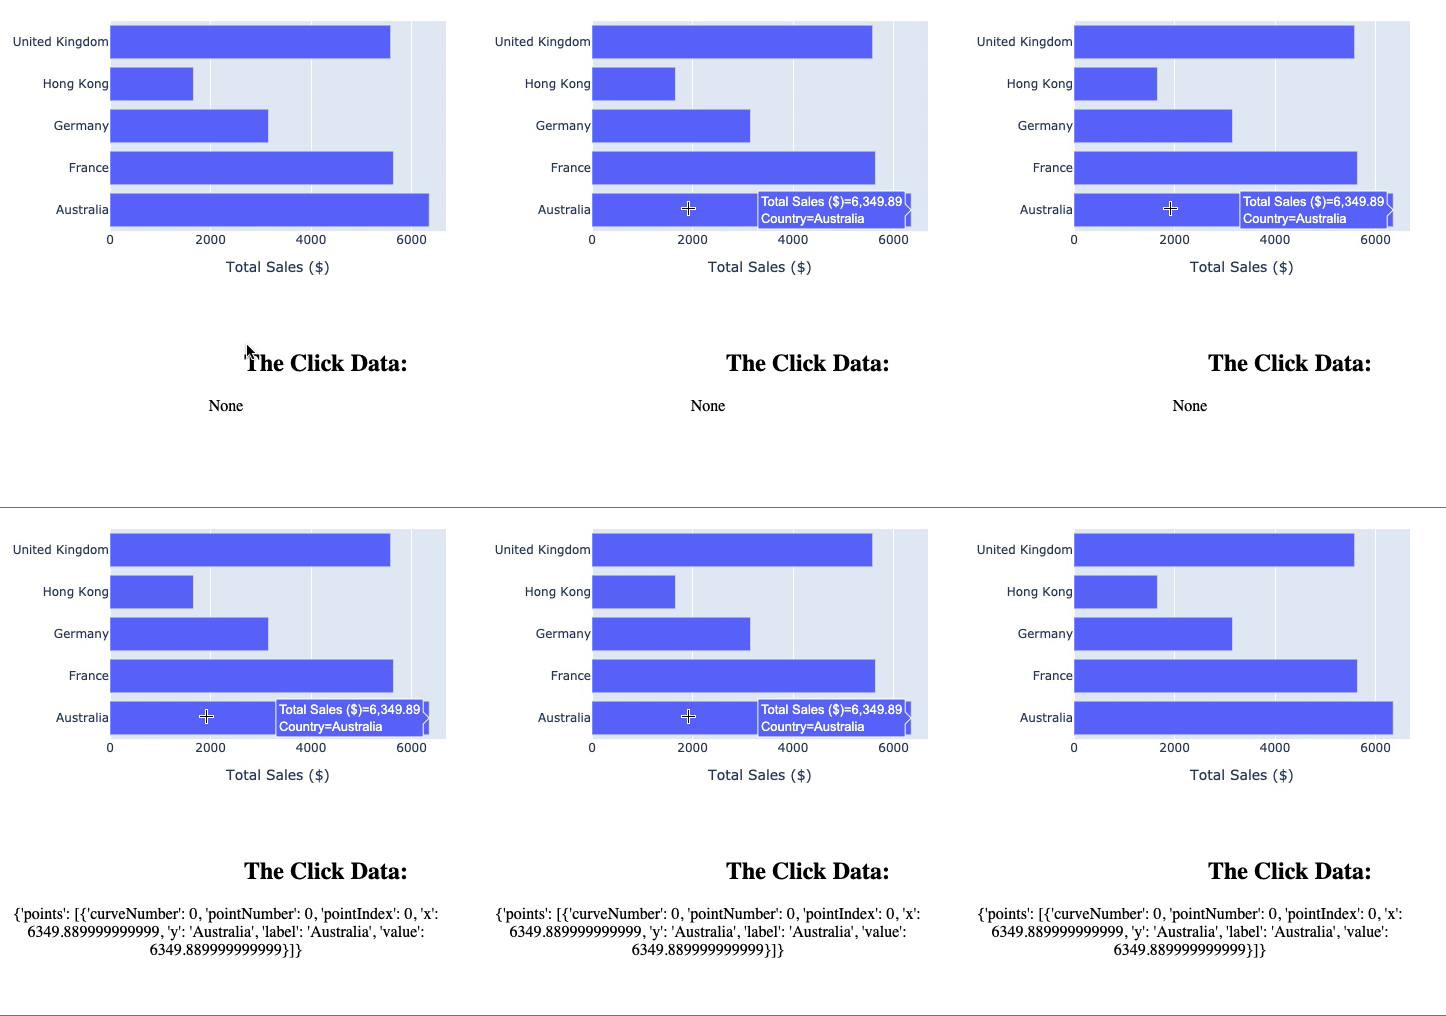
  • Can also trigger a callback when a point is clicked
    • Only one change required (clickData property)
@app.callback(
    Output('text_output', 'children'),
    Input('bar_fig', 'clickData'))
def capture_hover_data(clickData):
    return str(clickData)
  • Notice: Did not immediately appear

A gif of a horizontal bar chart of total sales (x-axis) vs. Country (y-axis) with the text "hover data" below it which has the word "none" below that. As the mouse hovers over the bottom bar, for Australia, the text none does not change. When the mouse clicks on this bar, the word None changes to a dictionary that contains details of the point hovered over, including the country label and the value.

Building Dashboards with Dash and Plotly

Let's practice!

Building Dashboards with Dash and Plotly

Preparing Video For Download...