Callbacks in Dash
Building Dashboards with Dash and Plotly

Alex Scriven
Data Scientist
What are callbacks?
- Functionality triggered by interaction
- A user interacts with an element
- -> A Python function is triggered
- --> Something is changed
- -> A Python function is triggered
- A user interacts with an element
$$
$$
$$
- Why? Enhances interactivity ✨
Callbacks in Dash
- Start with the decorator function
- Uses
from dash import Input, Output
- Uses
- Output: Where to send the function return
component_id: Identify the componentcomponent_property: What will be changed
- Input: What triggers the callback
component_property: What to use in triggered function
@callback(Output(component_id='my_plot', component_property='figure'),Input(component_id='my_input', component_property='value'))def some_function(data): # Subset Data # Recreate Figure return fig
Dropdowns in Dash
dcc.Dropdown(id='title_dd',
             options=['Title 1', 'Title 2'])
- List of values
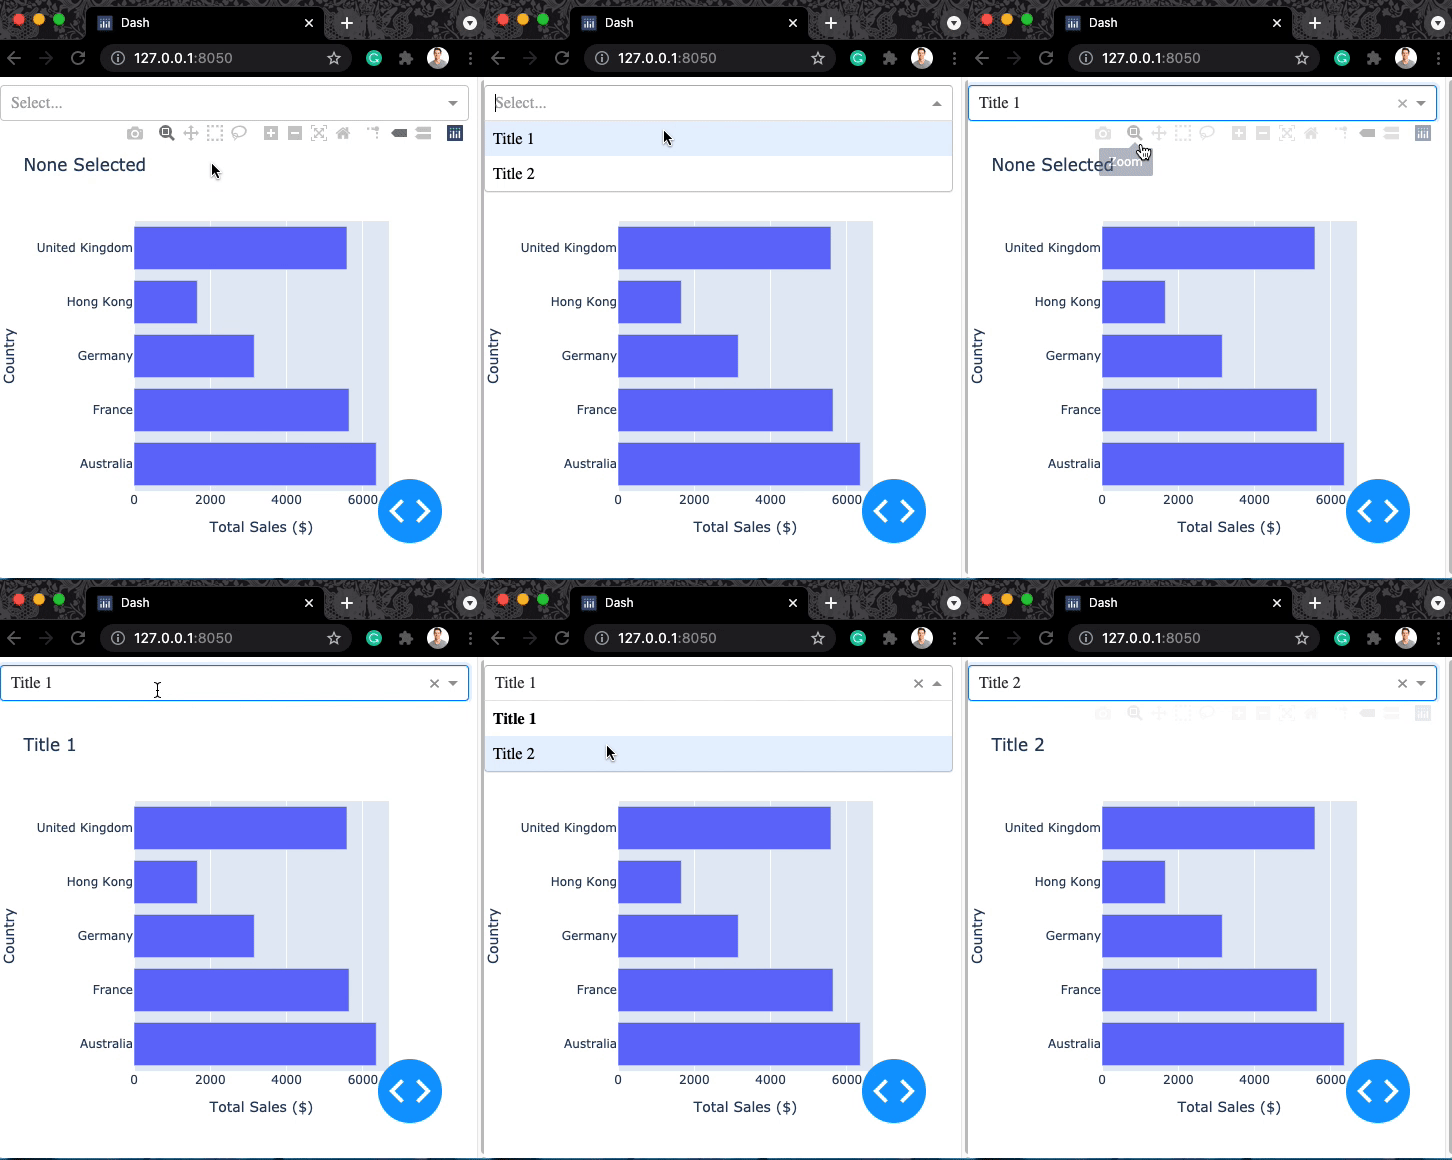
A dropdown callback
app.layout =[dcc.Dropdown(id='title_dd', options=['Title 1', 'Title 2']),dcc.Graph(id='my_graph')])@callback( Output(component_id='my_graph', component_property='figure'),Input(component_id='title_dd', component_property='value') )
# @callback() def update_plot(selection): title = "None Selected" if selection: title = selectionbar_fig = px.bar( data_frame=ecom_sales, title=f'{title}', x='Total Sales ($)', y='Country')return bar_fig
Our first dropdown

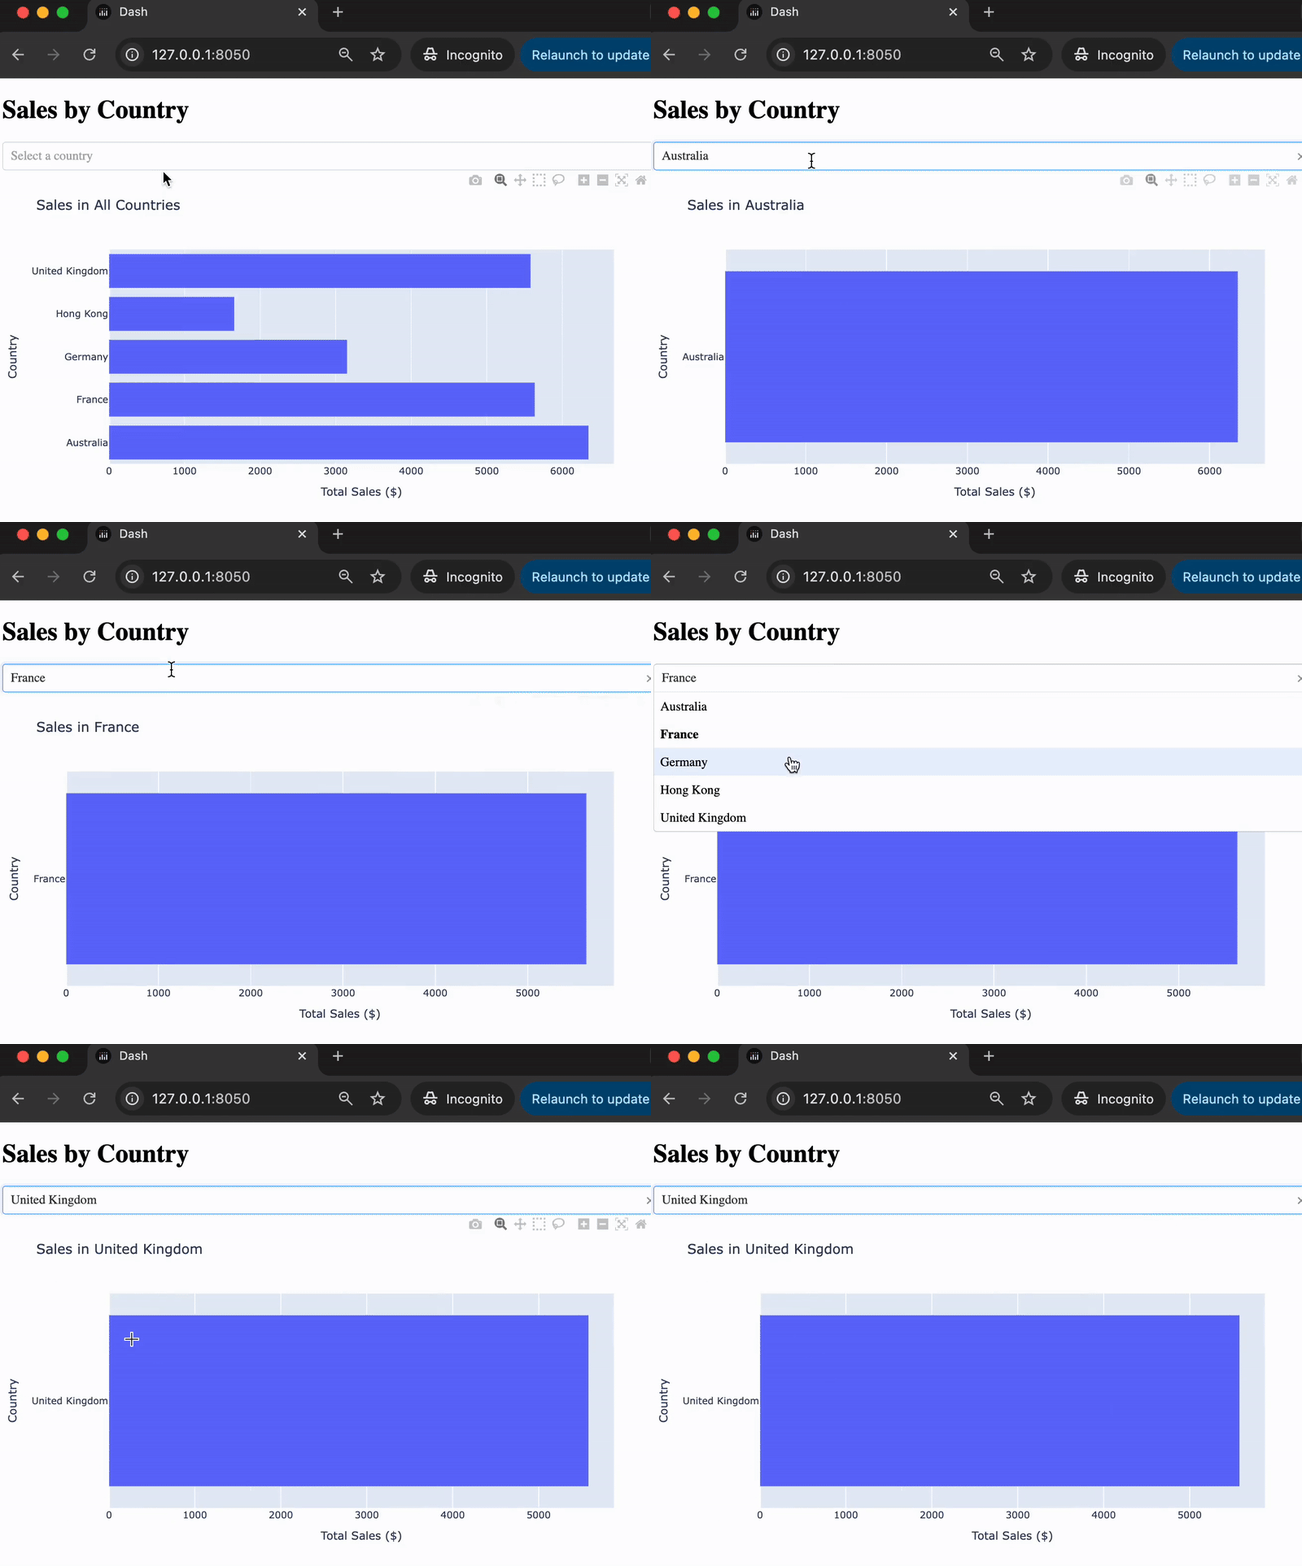
Dropdown as a filter
- Common use case - dropdown filters the plot DataFrame
# @callback() def update_plot(input_country): country = 'All Countries'sales = ecom_sales.copy(deep=True)if input_country: country = input_country sales = sales[sales['Country'] == country]bar_fig = px.bar( data_frame=sales, title=f"Sales in {country}", x='Total Sales ($)', y='Country') return bar_fig
The filter in action

Let's practice!
Building Dashboards with Dash and Plotly

