Dash AG Grid interactivity
Building Dashboards with Dash and Plotly

Alex Scriven
Data Scientist
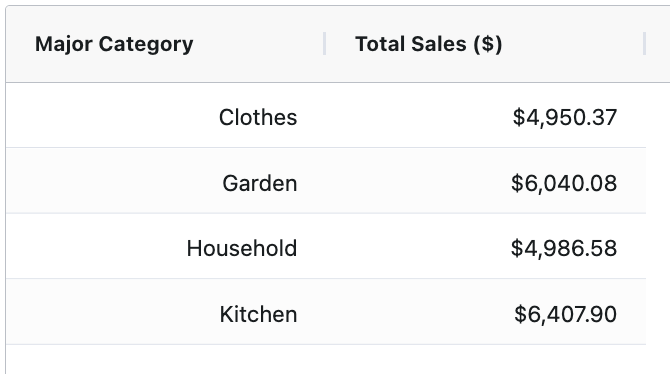
Styling all AG Grid cells
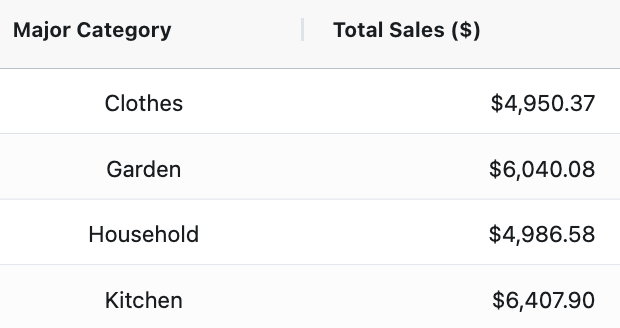
Styling some AG Grid cells
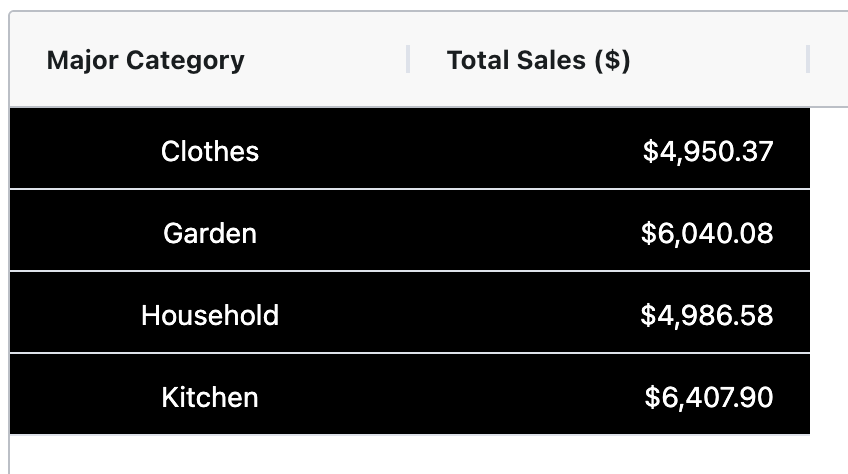
More styling examples
$$
Selecting cells
Selecting rows
Building Dashboards with Dash and Plotly
Alex Scriven
Data Scientist
$$

