Positioning Dash components
Building Dashboards with Dash and Plotly

Alex Scriven
Data Scientist
HTML and the web
HTML: language for structuring websites
- HTML: wooden structure of a house
- Set placement of objects
- CSS: paint color of a room
- Style (e.g., background color) of objects


Div and H tags
- Dash uses
dash.htmlto interface between HTML and Python
$$
Two important HTML structures ('tags'):
- Div tags: important for structuring websites
- Can have many different-sized divs with different things inside
- H tags: different sized titles (H1 > H6)
Using Div and H tags
$$
- Overall div (everything inside)
- Div inside: red background
- Div with blue background
- H tags inside
- Ignore the
stylepart - more on 'CSS' later!
<div>
  <div style="background-color: red;
              width:250; height:250;">
  </div>
  <div style="background-color: lightblue;
              width:250; height:250;">
    <h1>This box</h1>
    <h2>Another Title</h2>
  </div>
</div>
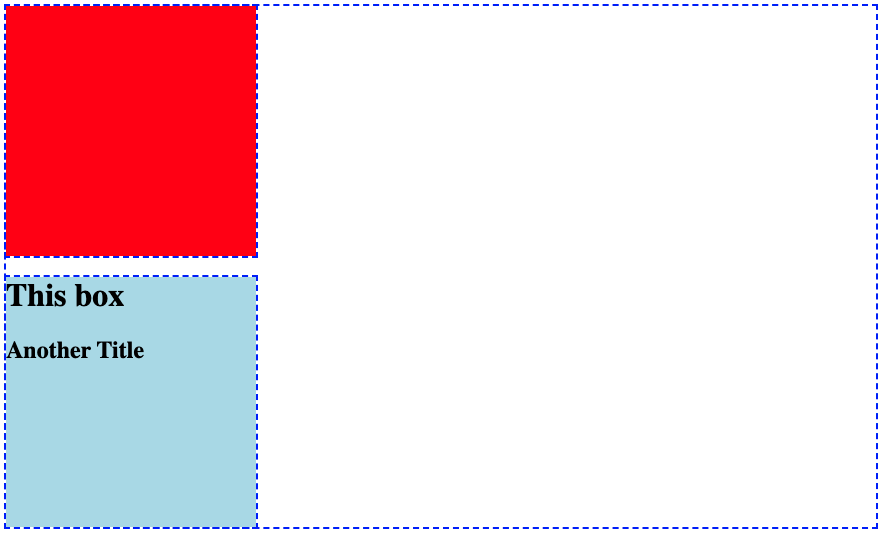
Our example displayed

Take note:
- Red background div
- Blue background div with H tags
Our example in Dash
- Recreating HTML example with Dash
from dash import Dash, html
app = Dash()
app.layout = [
    html.Div(style={'height':250, 'width':250, 'background-color':'red'}),
    html.Div(children=[
        html.H1("This box"),
        html.H2("Another Title")],
        style={'background-color':'lightblue'})
    ]
Breaking down the layout
- HTML tags align to Dash
html.()html.Div()=<div>html.H1()=<h1>
- The last div has a
childrenargument- A list of objects to go inside
- We can put
dcc.Graph()components inside too!
from dash import Dash, html
app.layout = [
  html.Div(
    style={'background-color':'red',
           'height':250, 'width':250}),
  html.Div(
  children=[
      html.H1("This box"),
      html.H2("Another Title")]
    ,style={'background-color':'lightblue',
              'height':250, 'width':250})
]
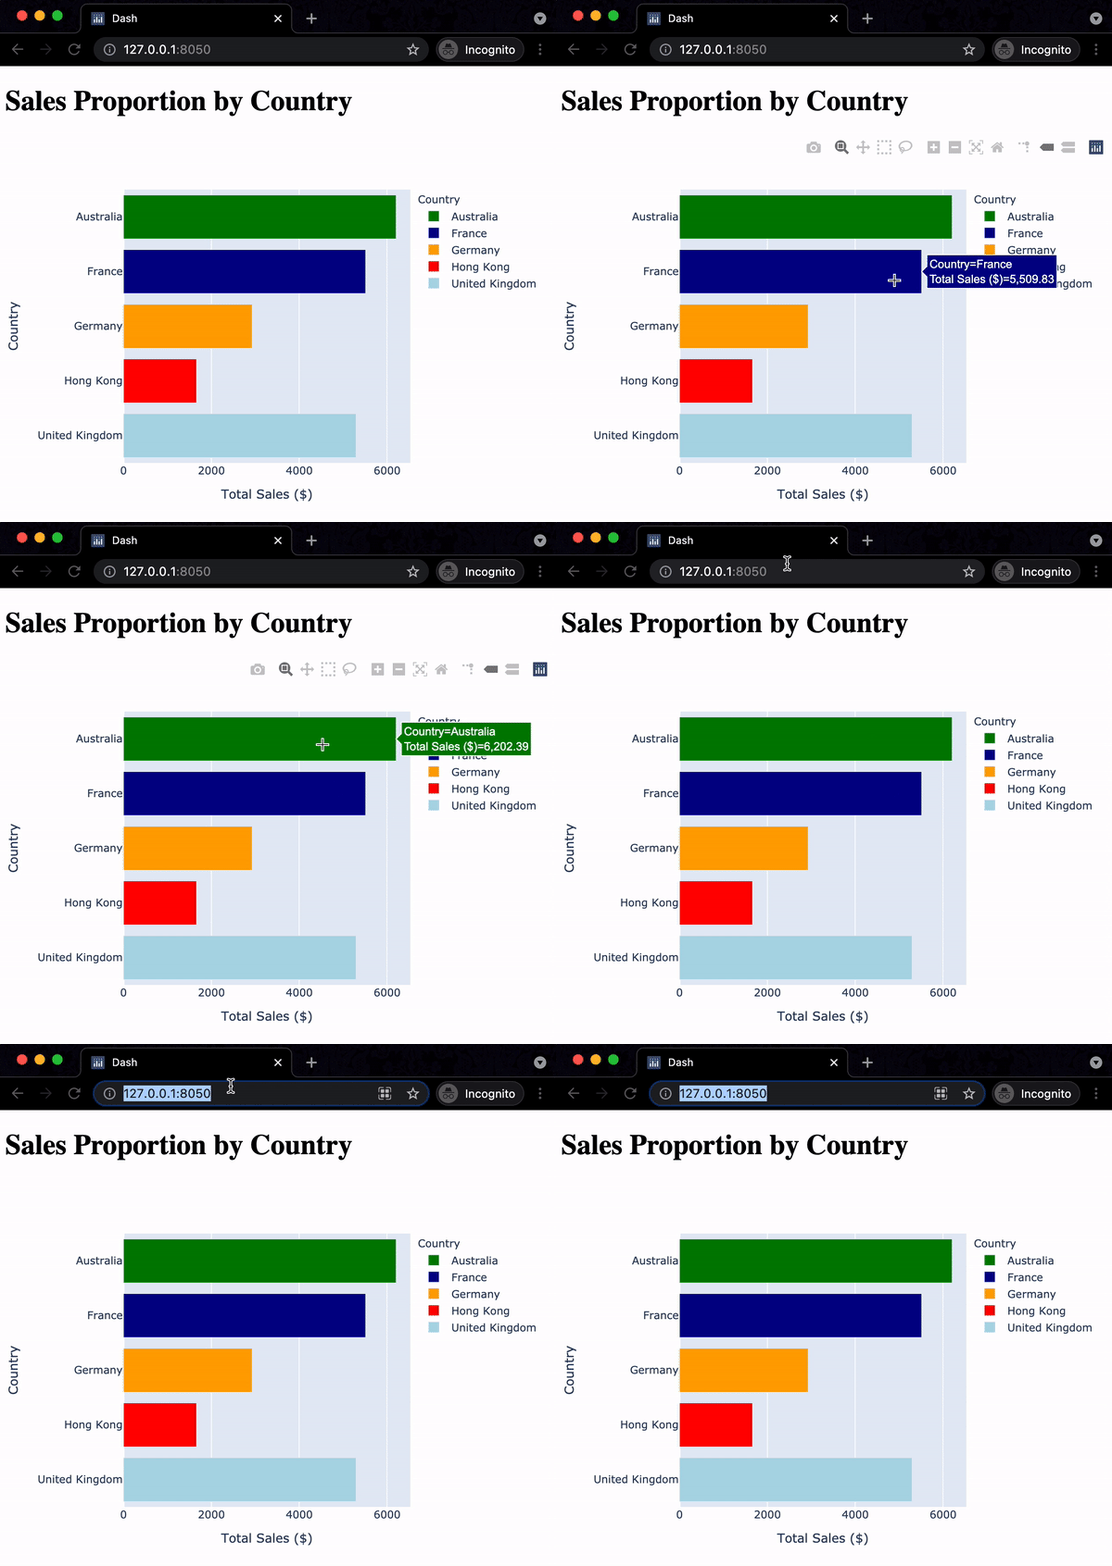
Graphs in the layout
bar_fig_country = px.bar(ecom_sales, x='Total Sales ($)', y='Country', color='Country', color_discrete_map= {'United Kingdom':'lightblue', 'Germany':'orange', 'France':'darkblue', 'Australia':'green', 'Hong Kong':'red'}) app = Dash()app.layout = [ html.H1("Sales Proportion by Country"), dcc.Graph(id='bar_graph', figure=bar_fig_country) ]

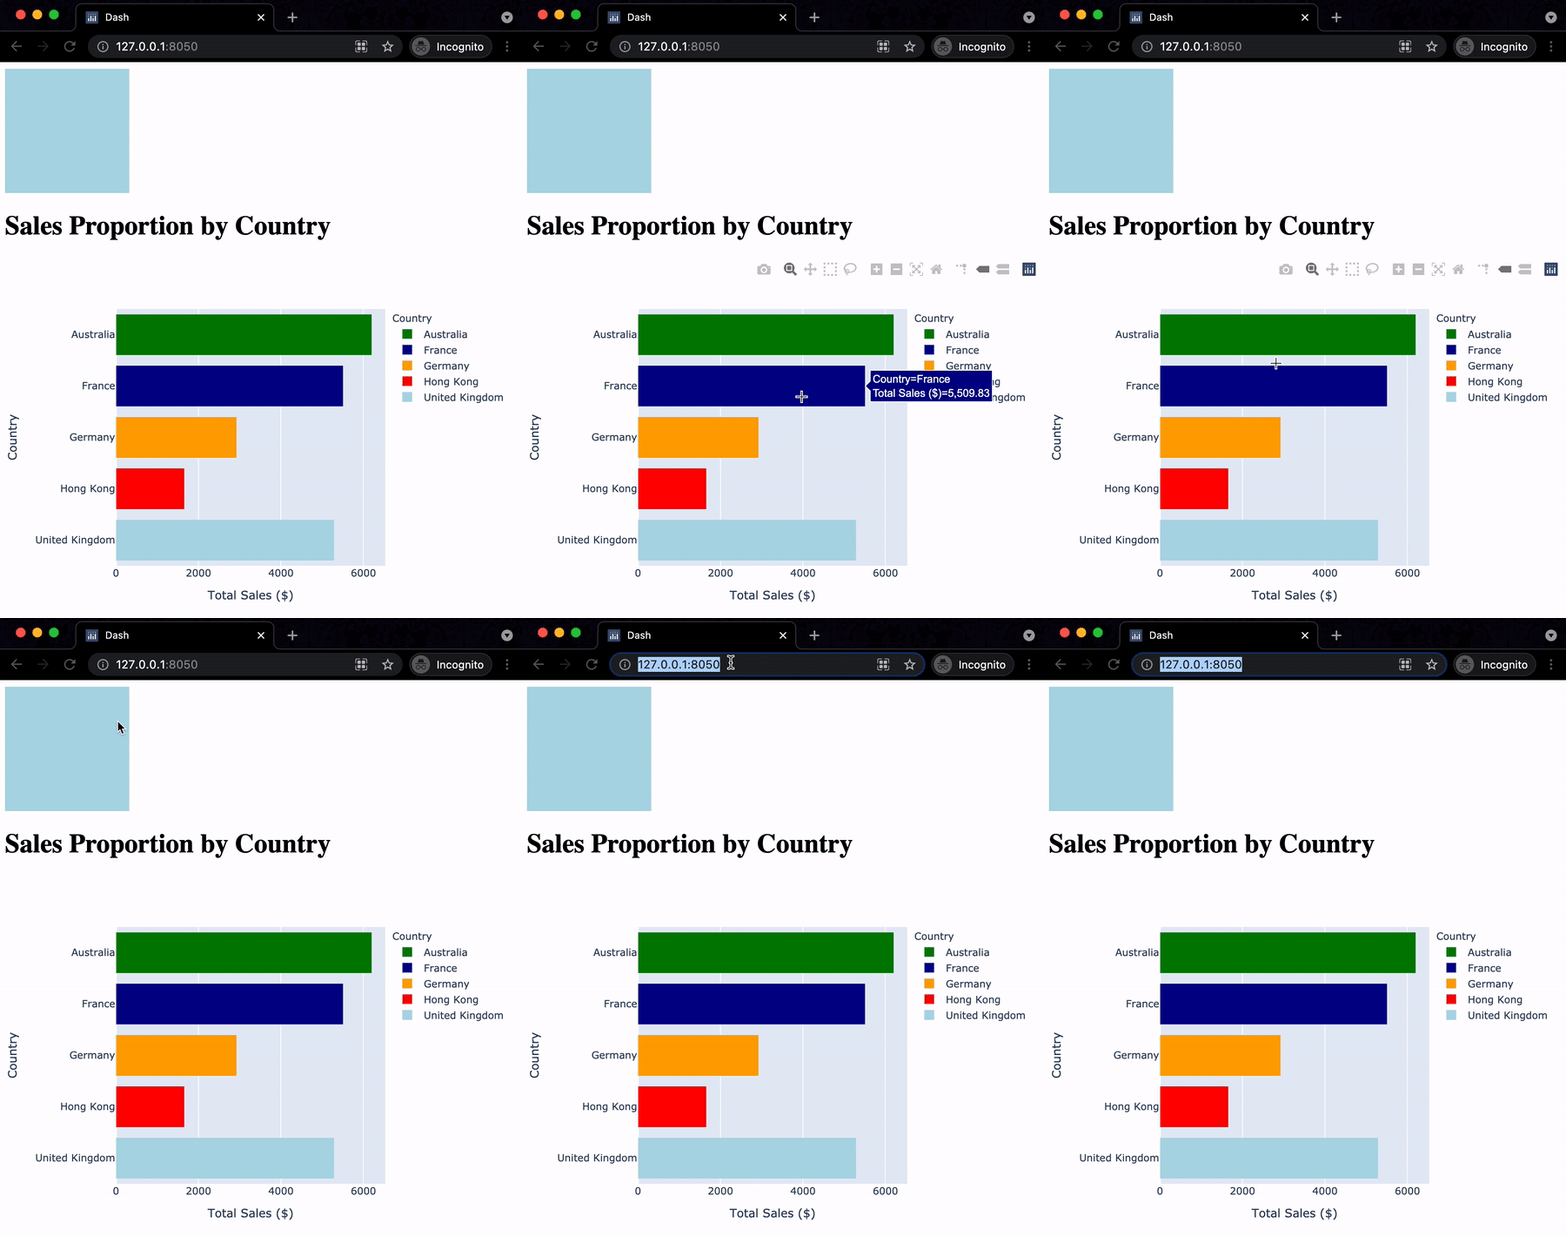
Adding more structure
$$
app.layout = [
  html.Div(style={
    'width':150,'height':150,
    'background-color':'lightblue'}),
  html.H1("Sales Proportion by Country"),
  dcc.Graph(id='bar_graph',
            figure=bar_fig_country)
]
$$

Let's practice!
Building Dashboards with Dash and Plotly

