From Plotly to Dash

Building Dashboards with Dash and Plotly

Alex Scriven

Data Scientist

A first Dash App


A complete Dash app:

import dash
from dash import dcc
app = dash.Dash()
app.layout = dcc.Graph(id='example-graph', figure=bar_fig)
if __name__ == '__main__':
    app.run_server(debug=True)
  • Python functionality possible
    • e.g., String interpolation print("f{my_variable}")
Building Dashboards with Dash and Plotly

The main Dash imports


import dash

from dash import dcc
  • dash is the main library that creates the app itself
  • dcc ('dash core components') contains the different building blocks to create the app
    • Two components in our app
    • More components throughout the course (e.g., user inputs!)
Building Dashboards with Dash and Plotly

The app layout


app = dash.Dash()

app.layout = dcc.Graph( id='example-graph', figure=bar_fig)


  • Create an app object using dash.Dash()
  • Set the app.layout
    • Here, a single graph
    • Using dcc.Graph()
      • figure = The Plotly figure to render
      • id = Important for callbacks later
Building Dashboards with Dash and Plotly

Running the app


if __name__ == '__main__':
    app.run_server(debug=True)


  • Lastly, running the server
  • Script is run from command-line (not read into a notebook)
    • i.e., python my_app.py in the command-line
  • debug for helpful feedback when testing
Building Dashboards with Dash and Plotly

Our app


Script is run via the command-line (python3 script.py), served on a local server

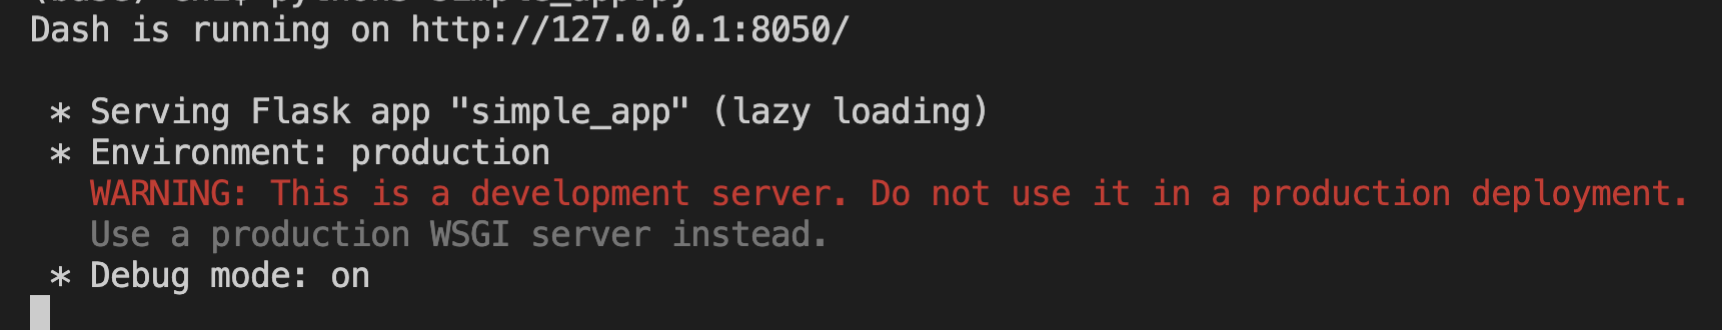
Access via a web browser such as Google Chrome

While served, update and save .py file to see live updates in browser

A screenshot of what is seen in a terminal once a dash app is run. There is white text on a black background showing the details mentioned in the script.

Building Dashboards with Dash and Plotly

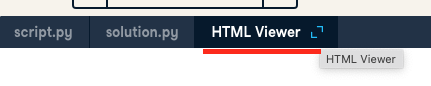
Our app in the browser

A gif of a horizontal bar chart of total sales on the x-axis by country on the y-axis. This is the same graph as in the previous lesson; however, it is in a chrome web browser, and a server address can be seen in the URL bar. The mouse hovers over the graph and clicks into the URL bar to demonstrate the server is present.

Building Dashboards with Dash and Plotly

Dash in DataCamp


  • Some differences to other DataCamp exercises:
    • All code inside the panel (Pre-exercise, dataset etc.)
    • All executed at once (not line-by-line)
    • (Much) longer code
    • dash.Dash(__name__) (The __name__ not needed locally)
  • Fully-functional dashboards (expand window to see!)

A screenshot of the top of a dash coding exercise that has been run, highlighting the button used to expand the HTML output so the app can be viewed in full screen.

Building Dashboards with Dash and Plotly

Let's practice!

Building Dashboards with Dash and Plotly

Preparing Video For Download...