From Plotly to Dash
Building Dashboards with Dash and Plotly

Alex Scriven
Data Scientist
A first Dash App
A complete Dash app:
from dash import Dash, dcc
app = Dash()
app.layout = [dcc.Graph(id='example-graph', figure=bar_fig)]
if __name__ == '__main__':
    app.run(debug=True)
- Python functionality possible
- e.g., String interpolation
print("f{my_variable}")
- e.g., String interpolation
The main Dash imports
from dash import Dash, dcc
Dashinitializes the appdcchas UI components like graphs and inputs- One component in our app
- More components throughout the course
The app layout
app = Dash()app.layout = [dcc.Graph( id='example-graph', figure=bar_fig)]
- Create an app object using
Dash() - Set the
app.layout- Using
dcc.Graph()figure= The Plotly figure to renderid= Important for callbacks later
- Using
Running the app
if __name__ == '__main__':
    app.run(debug=True)
- Script is run from command-line
- i.e.,
python my_app.pyin the command-line
- i.e.,
debugfor feedback when testing
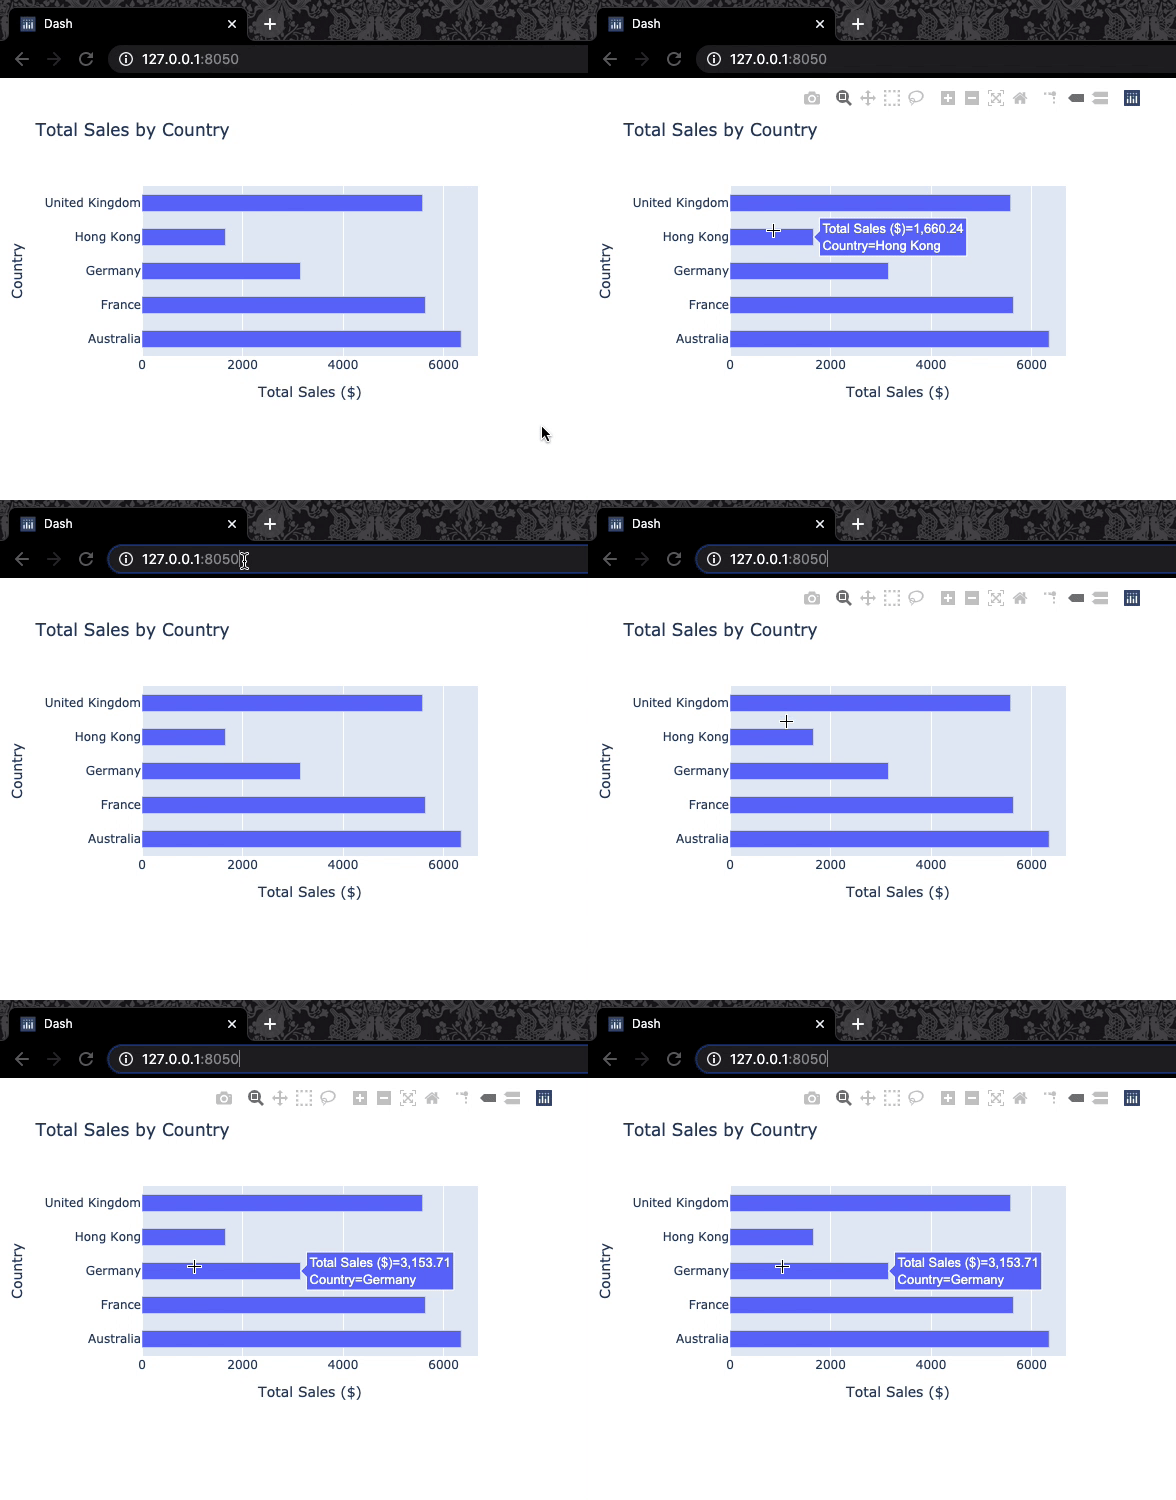
Our app
Access via a web browser such as Google Chrome
While served, update and save
.pyfile to see live updates in browser

Our app in the browser

Dash in DataCamp
- Some differences to other DataCamp exercises:
- Setup lines at the top of the exercises.
- All executed at once (not line-by-line)
- (Much) longer code
- Fully-functional dashboards (expand the window to see!)

Let's practice!
Building Dashboards with Dash and Plotly

