CSS Basics in Dash
Building Dashboards with Dash and Plotly

Alex Scriven
Data Scientist
CSS on the web
Most websites have CSS files;
- They are read in on page load
- This course:
styleproperty instead
CSS on HTML elements
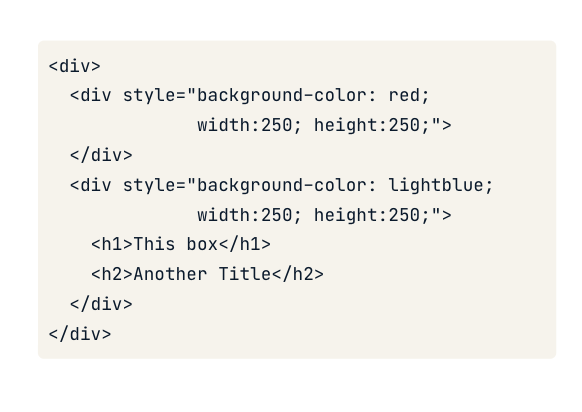
Some CSS styling

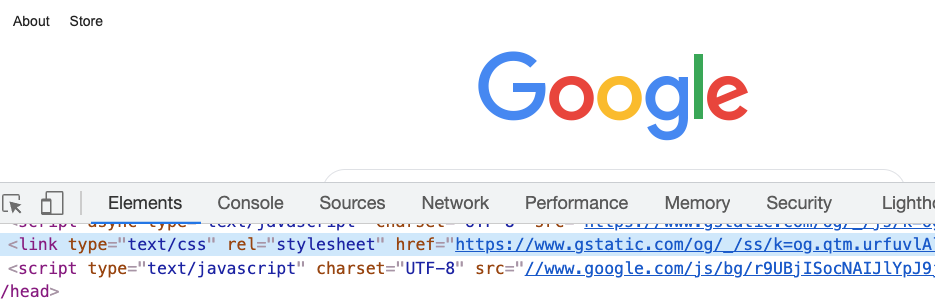
Editing live CSS
We can edit some CSS on a live website
- Right click an element > select 'Inspect' > edit a CSS value
- Note - only a local change (gone on refresh)
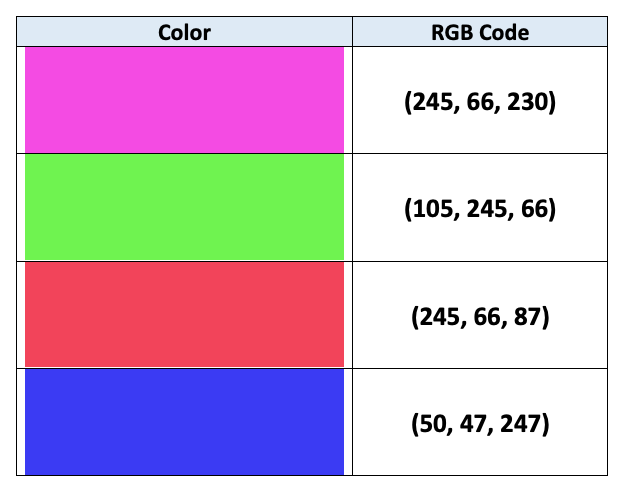
CSS for color