Packages
Intermediate R for Finance

Lore Dirick
Manager of Data Science Curriculum at Flatiron School
Packages
Packages
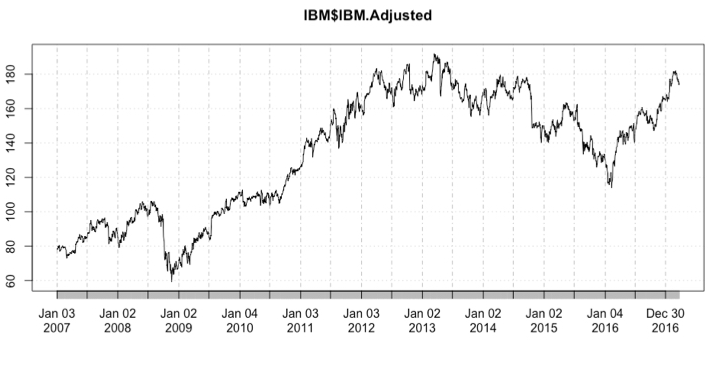
quantmod functionality
library(quantmod)
getSymbols("IBM")
"IBM"
head(IBM, n = 3)
           IBM.Open IBM.High IBM.Low IBM.Close IBM.Volume IBM.Adjusted
2007-01-03    97.18    98.40   96.26     97.27    9196800     77.73997
2007-01-04    97.25    98.79   96.88     98.31   10524500     78.57116
2007-01-05    97.60    97.95   96.91     97.42    7221300     77.85985
plot(IBM$IBM.Adjusted)