A great ggplot twist
Programming with dplyr

Dr. Chester Ismay
Educator, Data Scientist, and R/Python Consultant
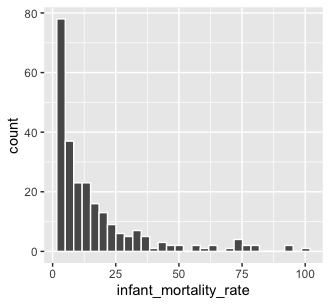
ggplot2 basics
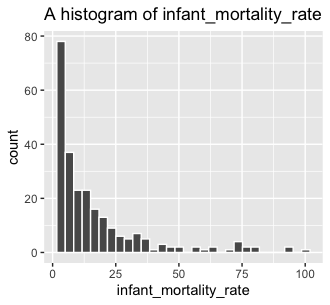
Adding a title
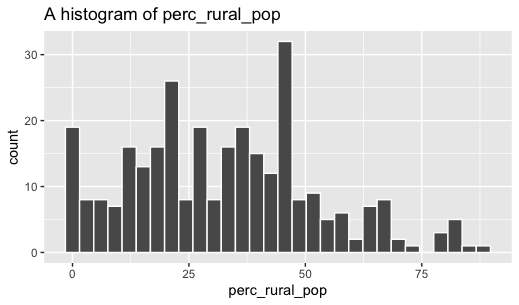
Using our function
Programming with dplyr
Dr. Chester Ismay
Educator, Data Scientist, and R/Python Consultant

