Xarray
Parallel Programming with Dask in Python

James Fulton
Climate Informatics Researcher
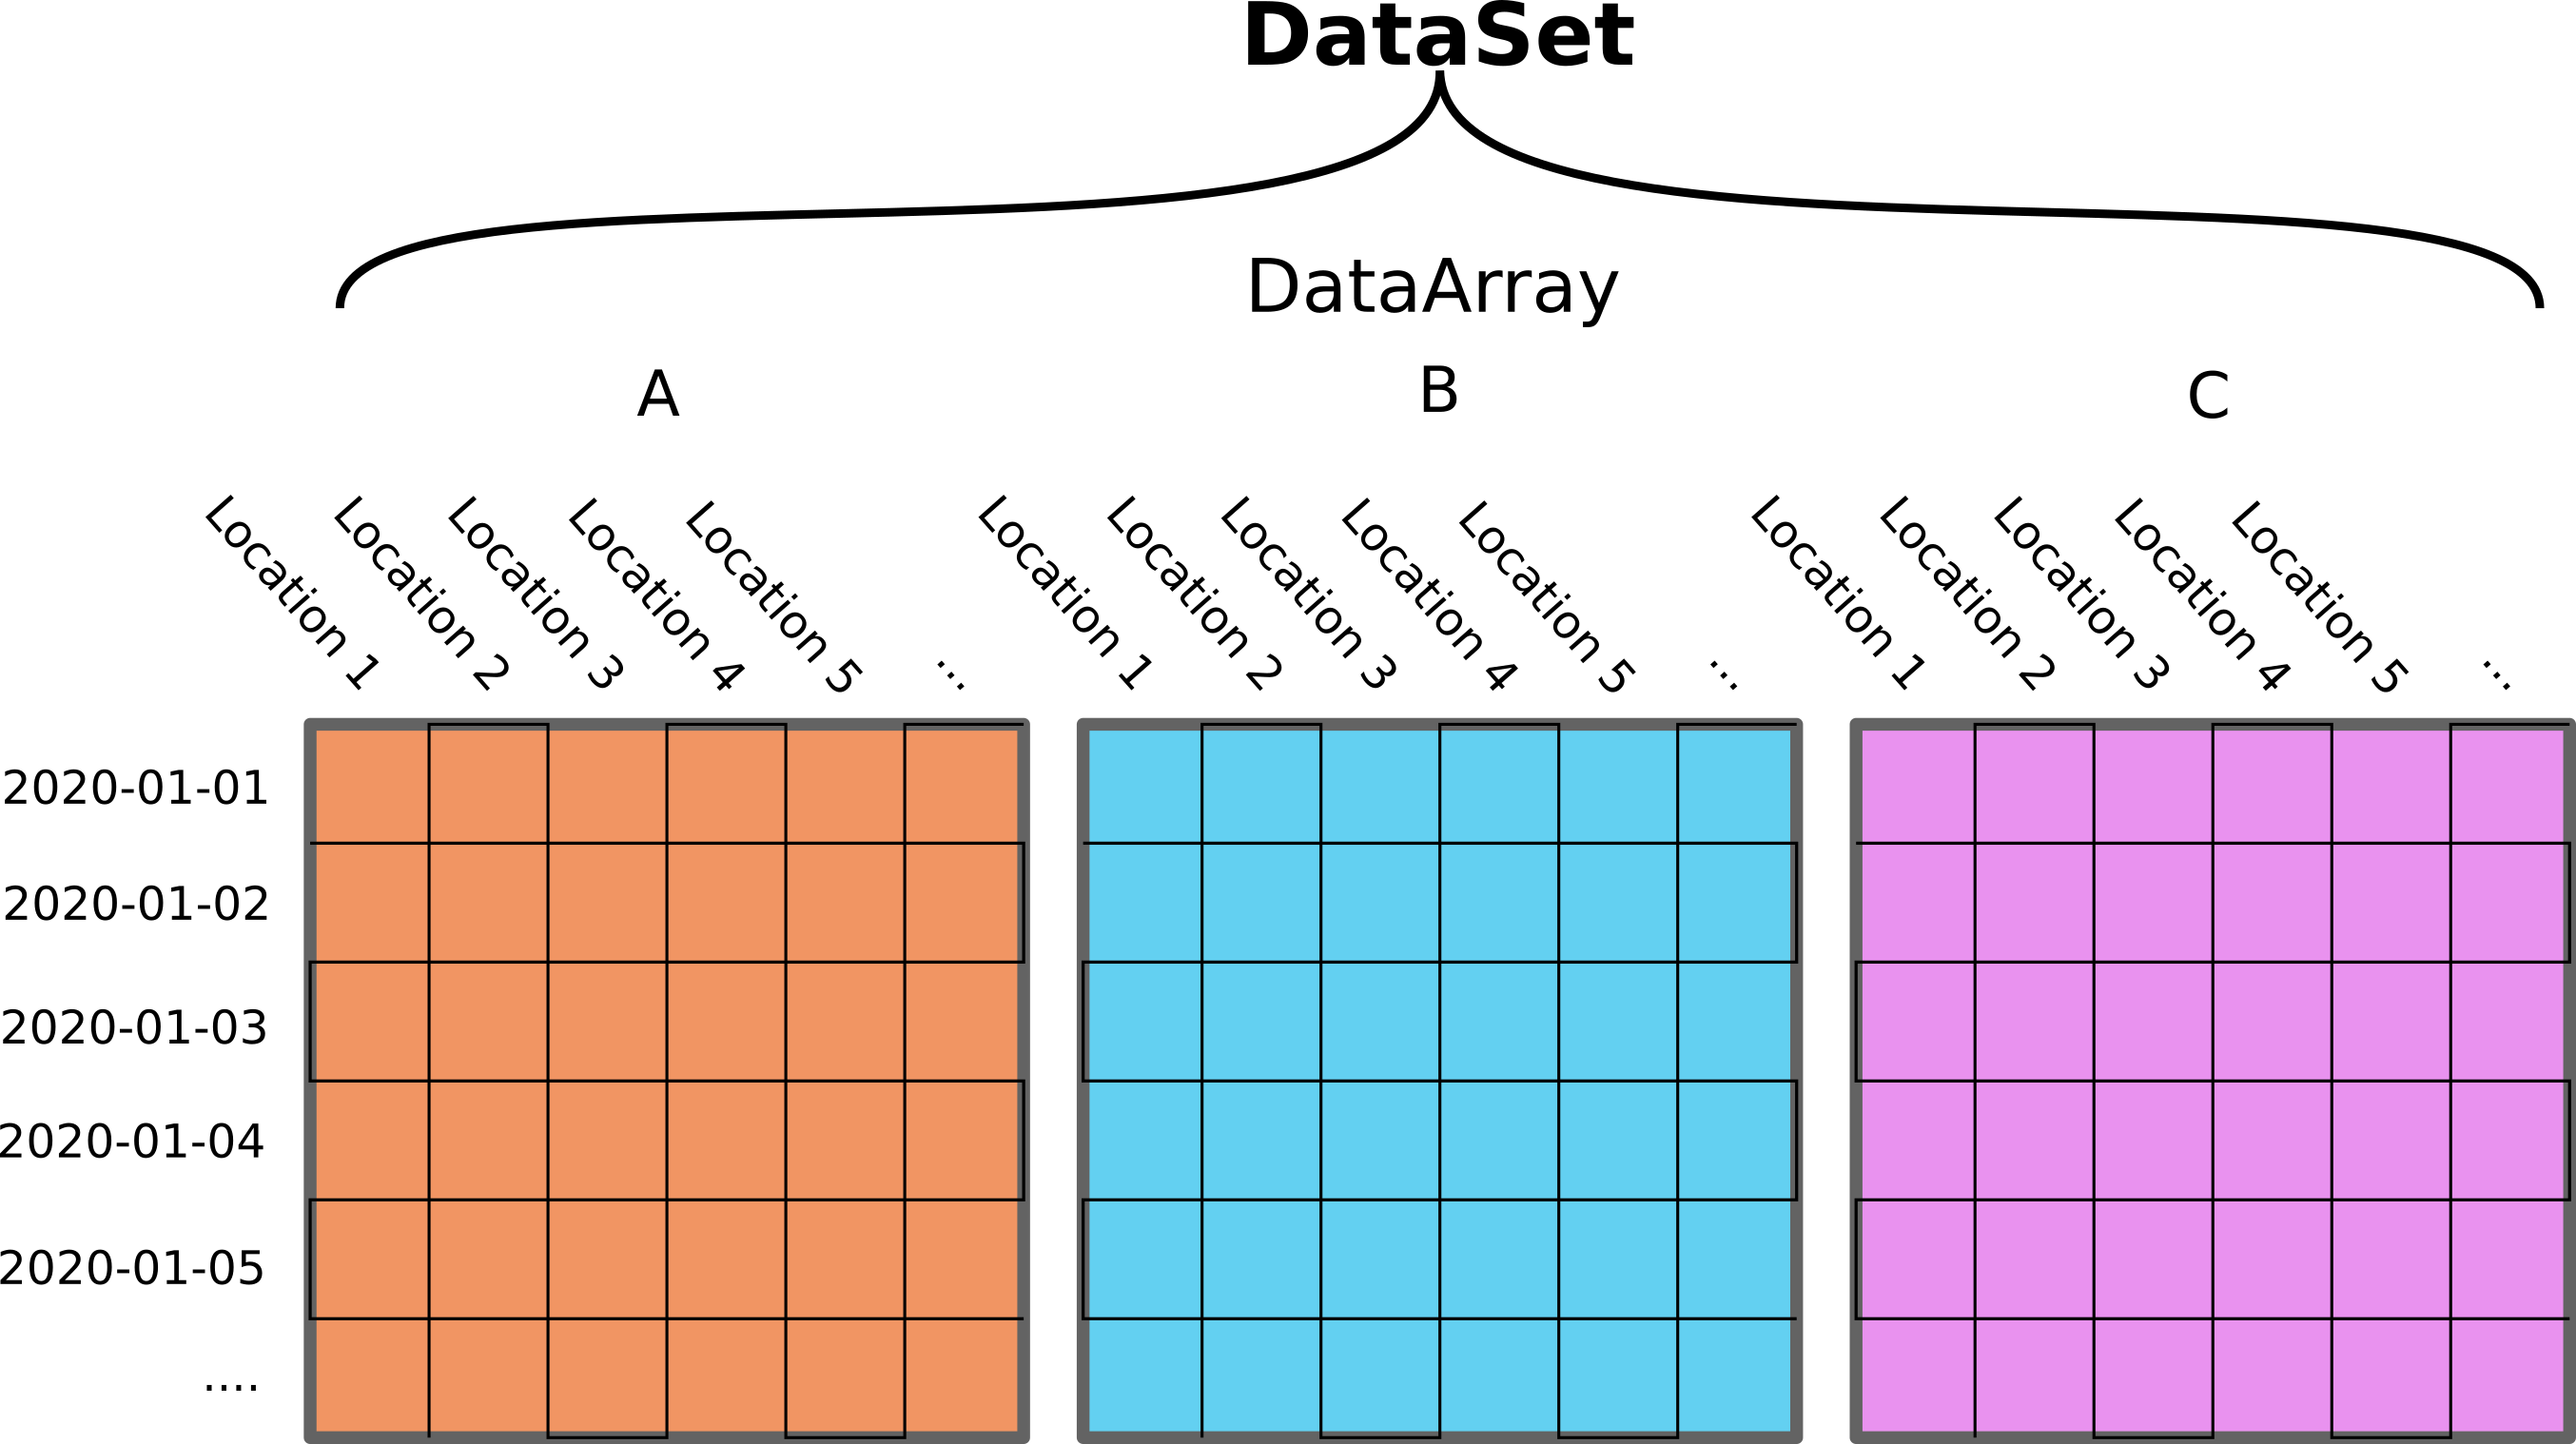
DataFrame

DataSet
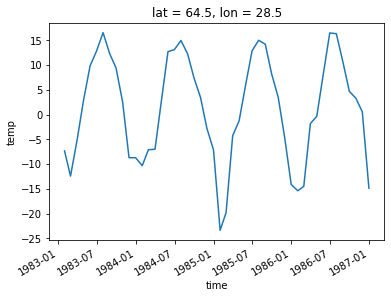
Plotting
Example
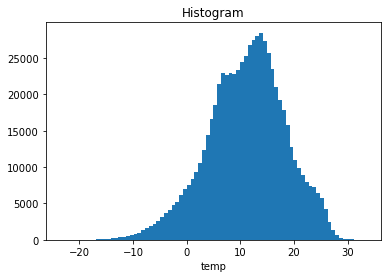
Plotting
Example

Plotting
Example
Parallel Programming with Dask in Python
James Fulton
Climate Informatics Researcher
Example
Example
Example

