Analyzing customer churn in Tableau
Case Study: Analyzing Customer Churn in Tableau

Carl Rosseel
Curriculum Manager
What is a case study?

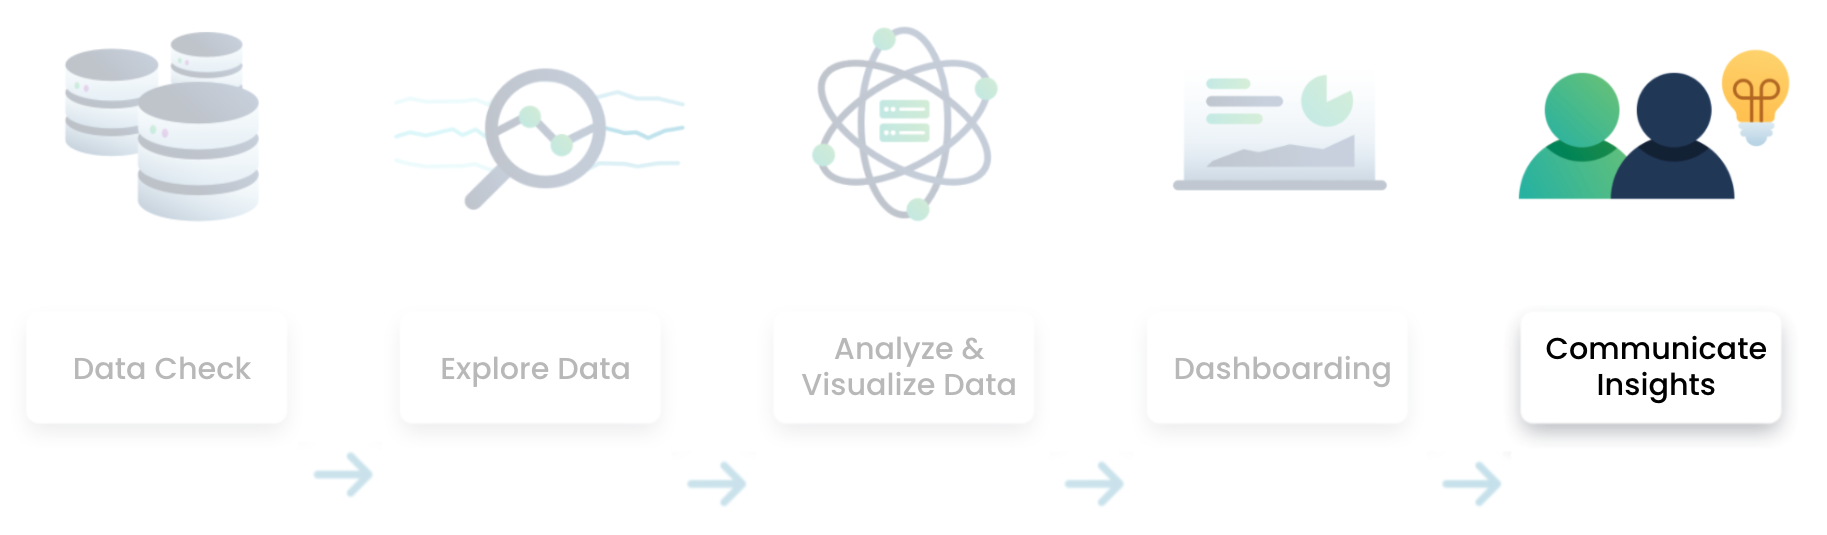
Data analysis flow in Tableau
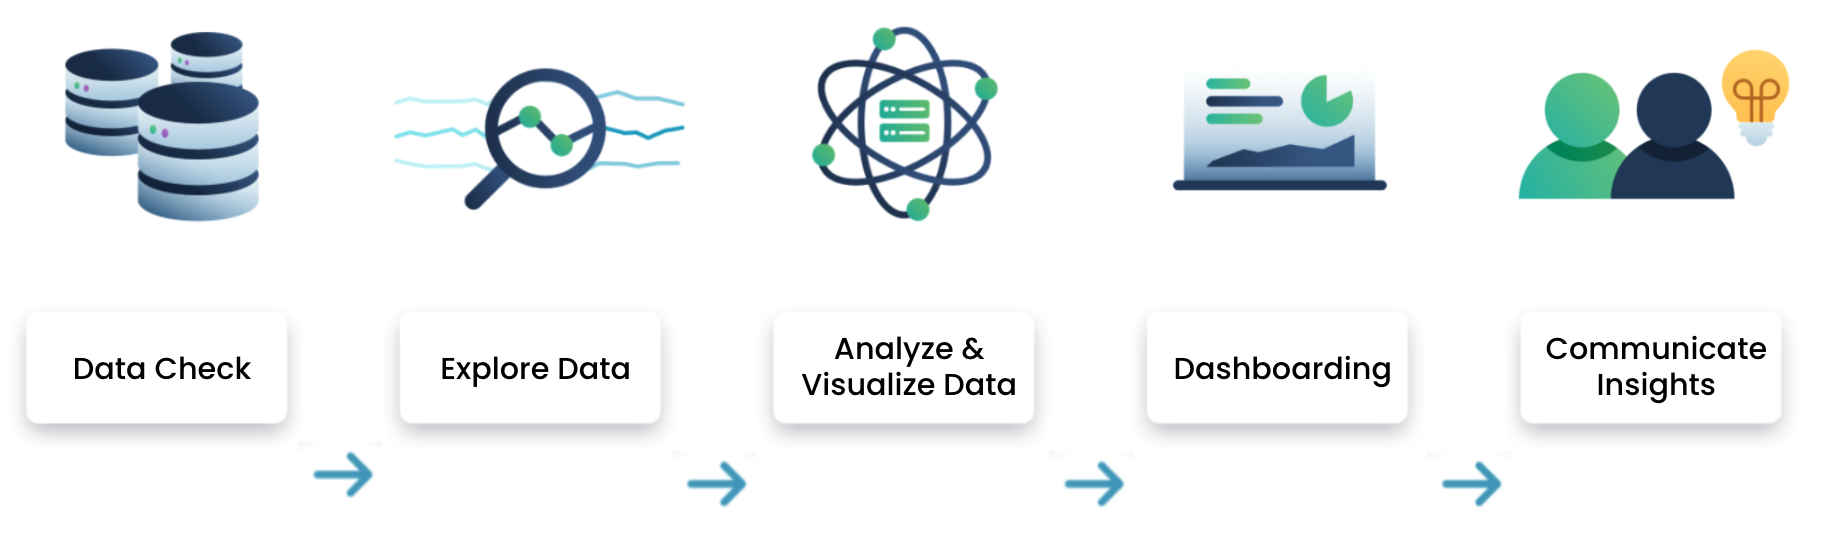
Data analysis flow in Tableau
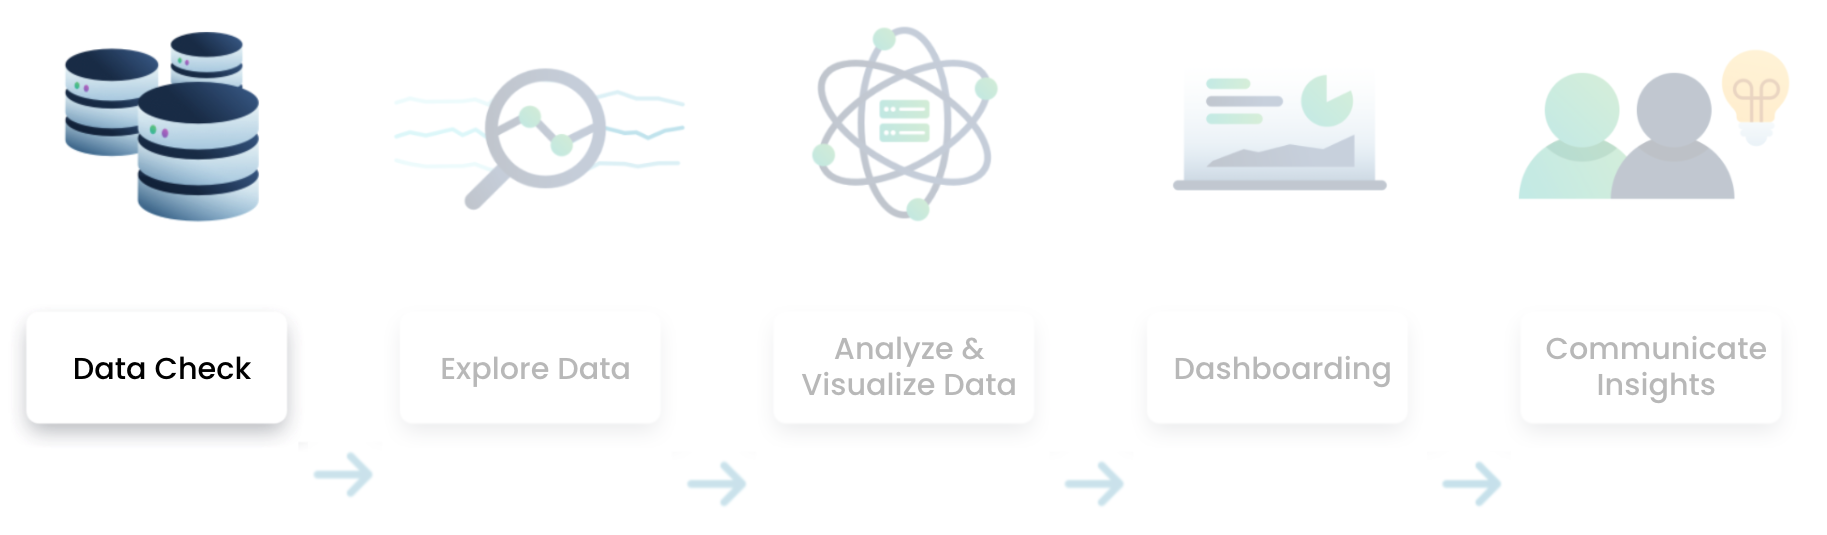
Data analysis flow in Tableau
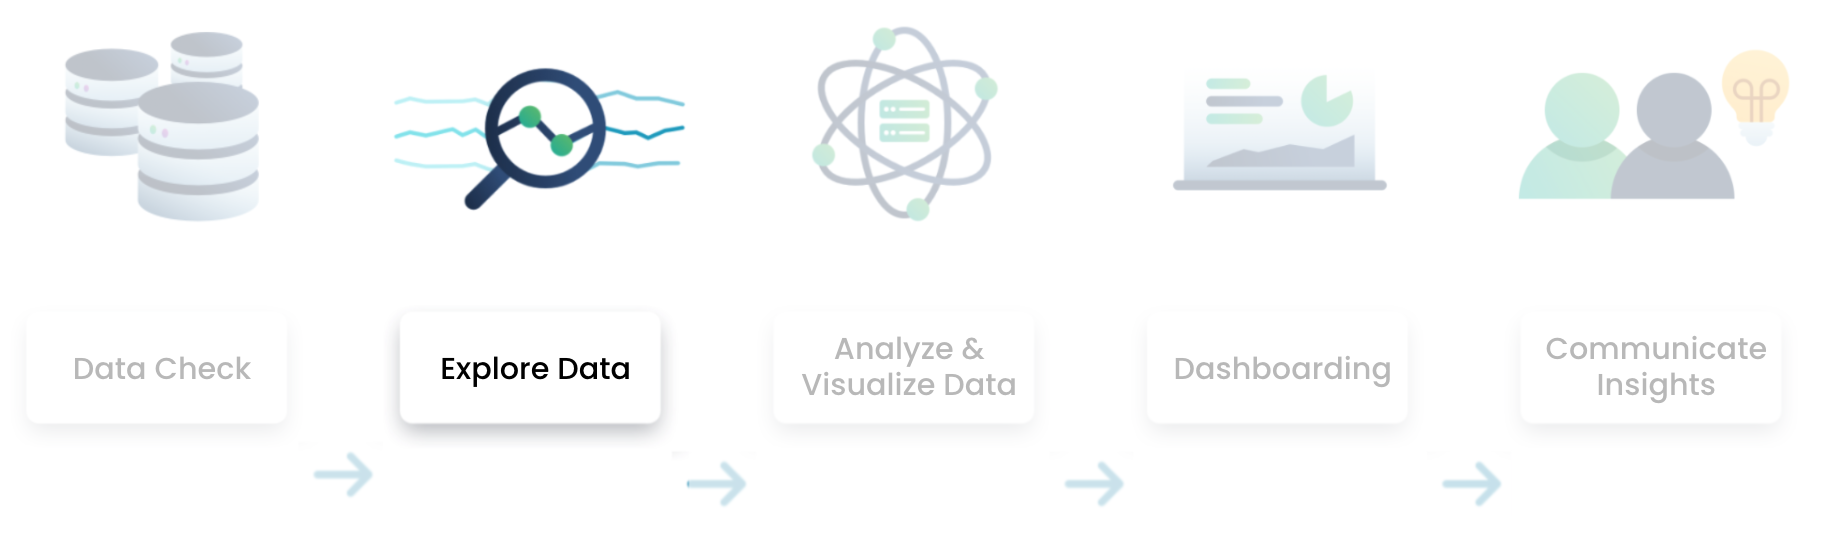
Data analysis flow in Tableau
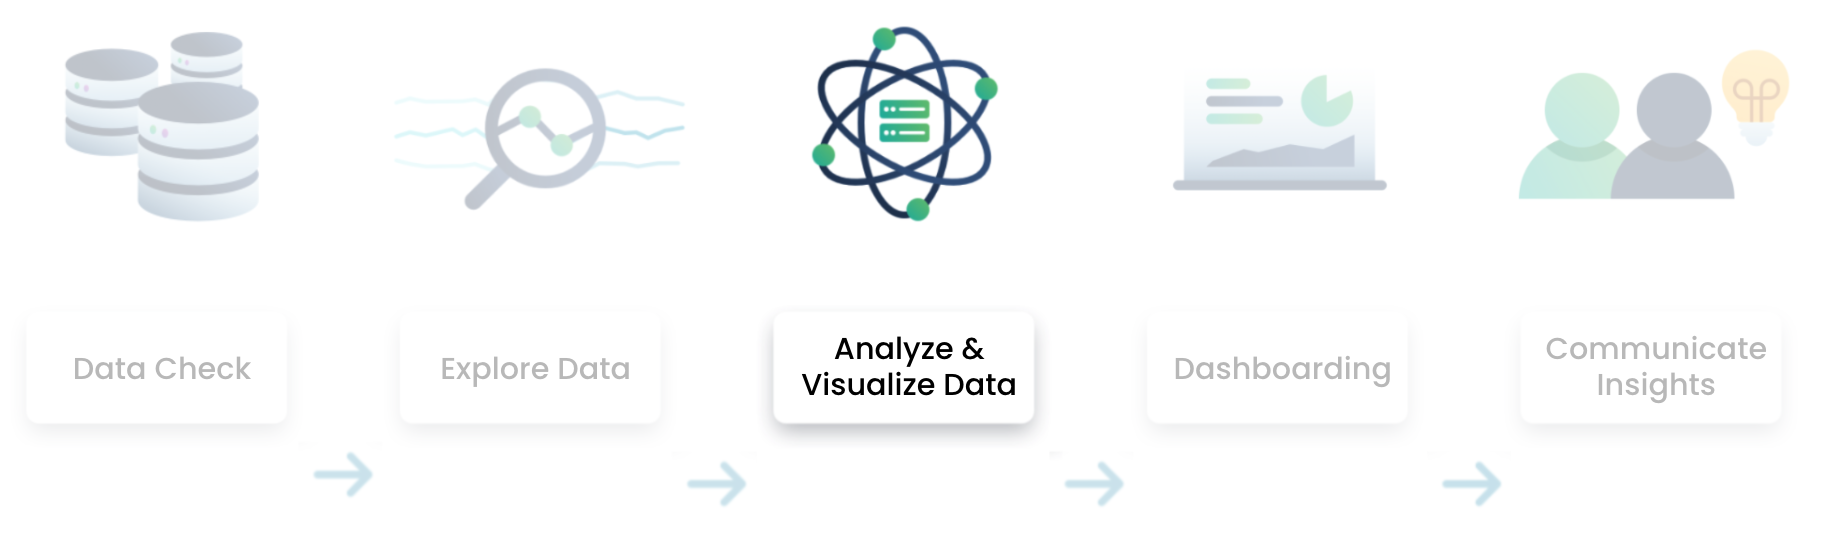
Data analysis flow in Tableau
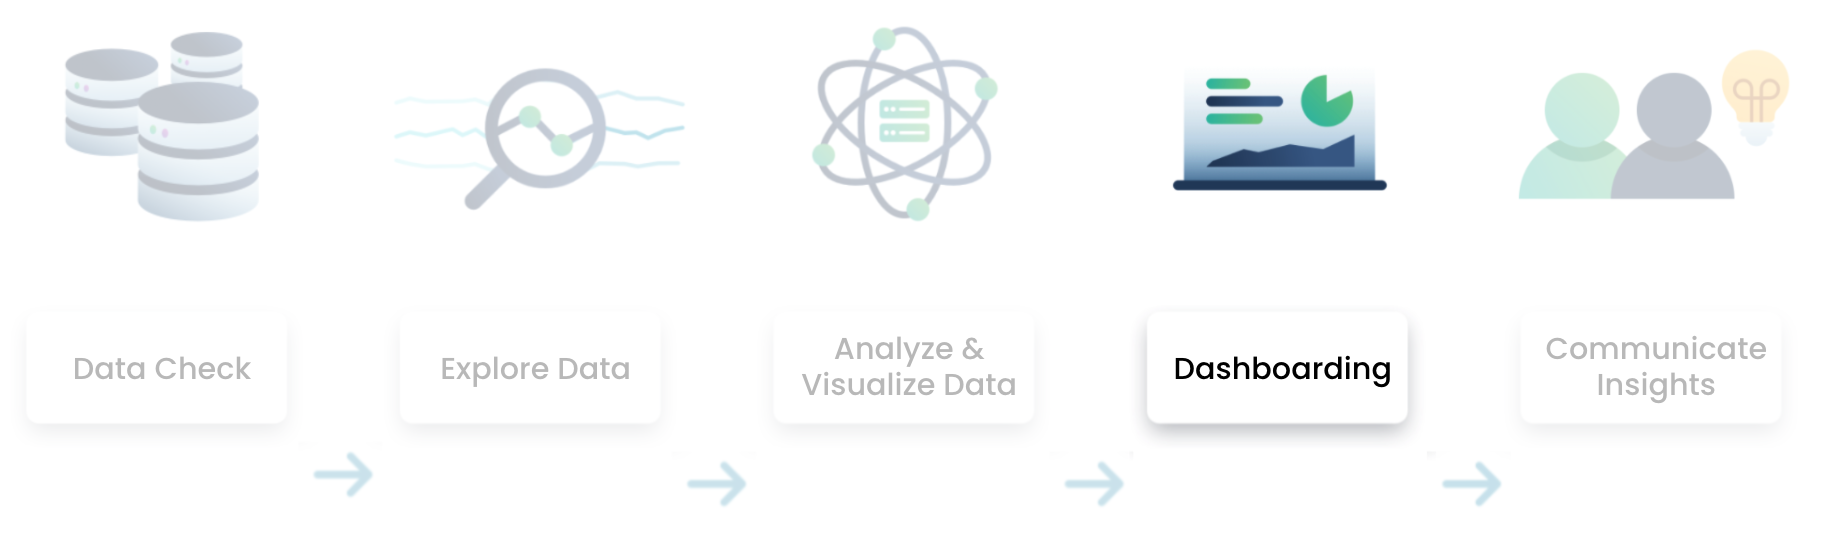
Data analysis flow in Tableau
The problem
$$

Defining churn

1 https://www.investopedia.com/terms/c/churnrate.asp
The data