Zooming out
Case Study: Analyzing Customer Churn in Tableau

Carl Rosseel
Curriculum Manager
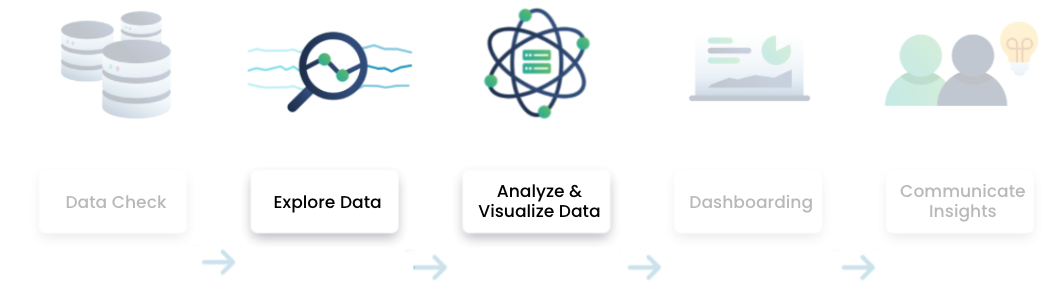
The 5 analysis steps from the drag-and-drop exercise
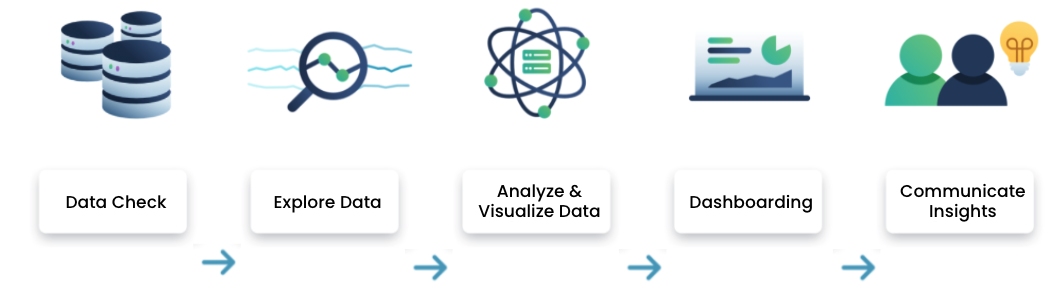
The 5 analysis steps from the drag-and-drop exercise
Insights discovered so far
- The churn rate for Databel is ~27%
- ~45% of the reasons why customers churn is related to competitors
- The churn rate in California is abnormally high (>60%)

There are many things we don't know yet.
- Immediately started analyzing, without designing a plan
- Many columns (over 20 out of 29) are still unexplored