Customizing glyph settings
Interactive Data Visualization with Bokeh

George Boorman
Core Curriculum Manager, DataCamp
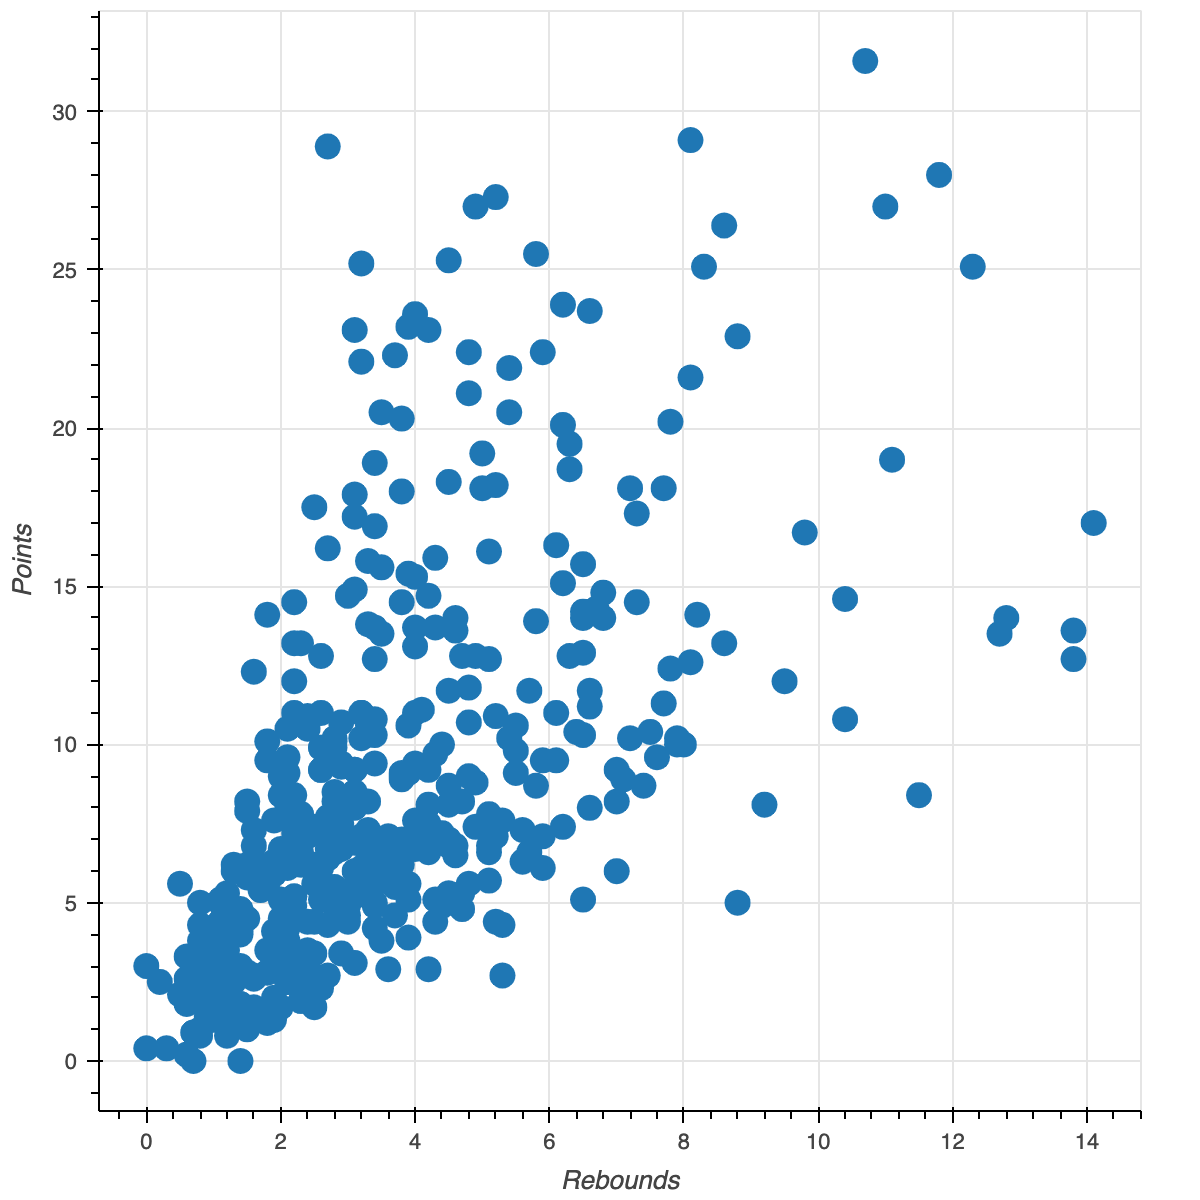
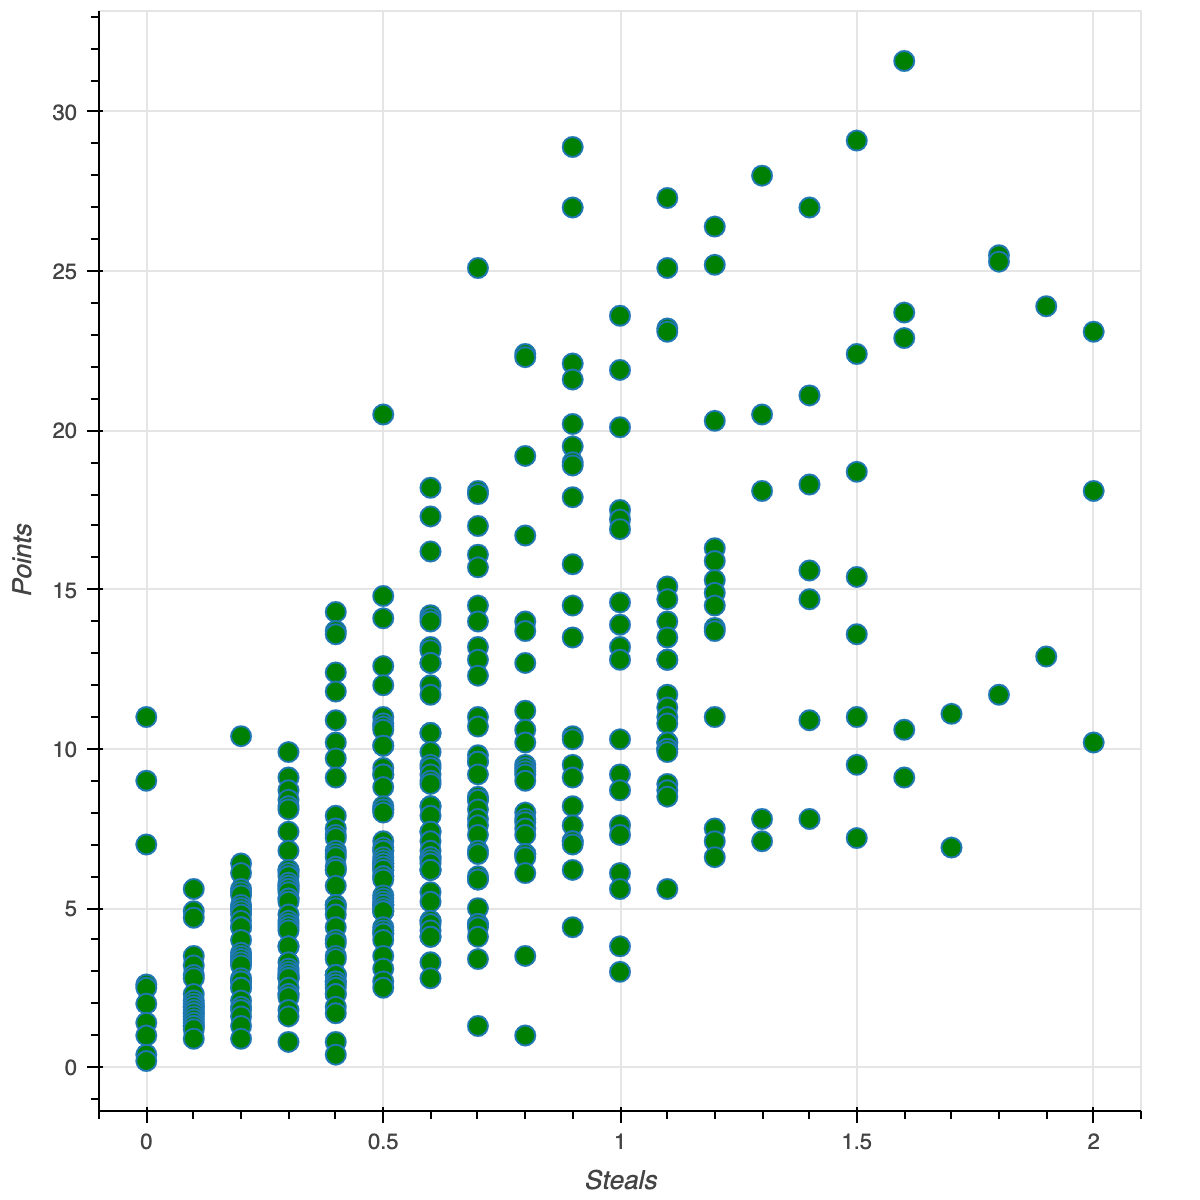
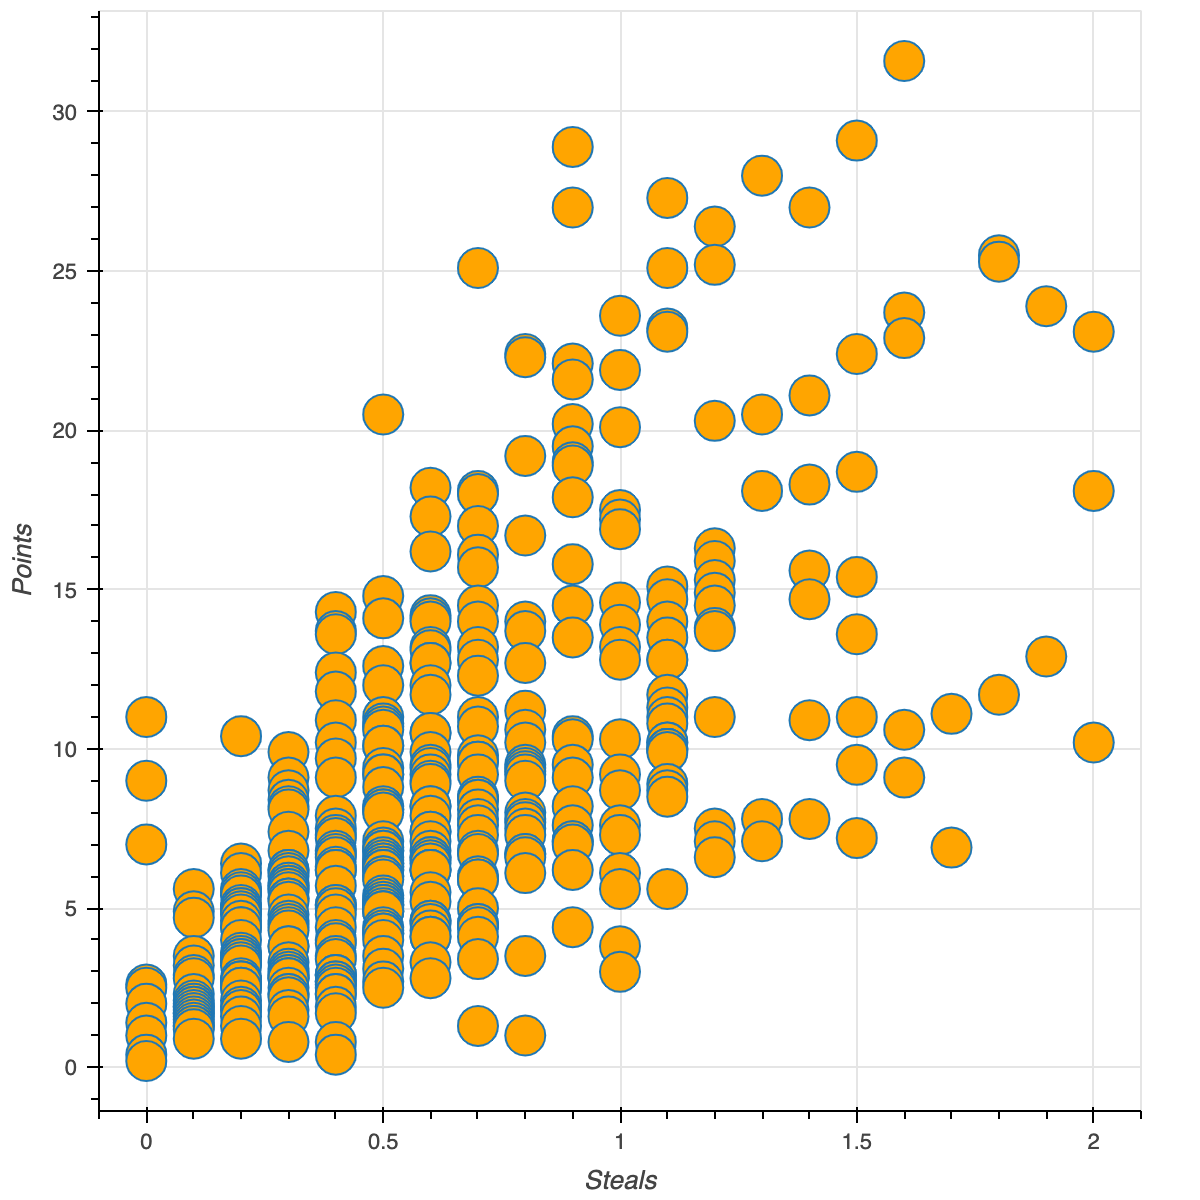
Glyph size
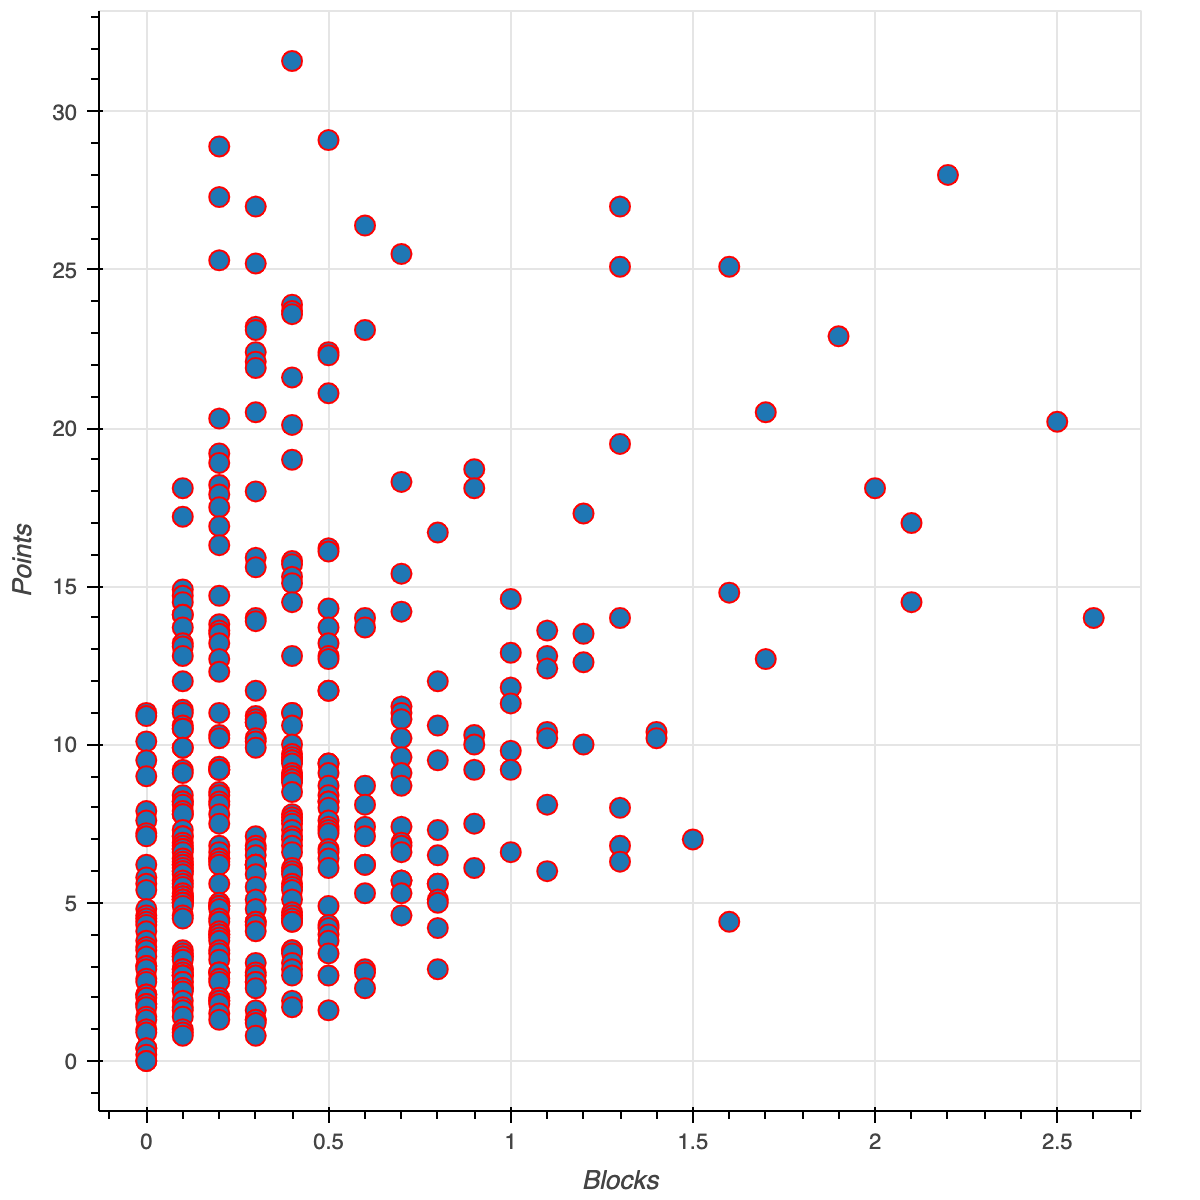
Glyph outline color
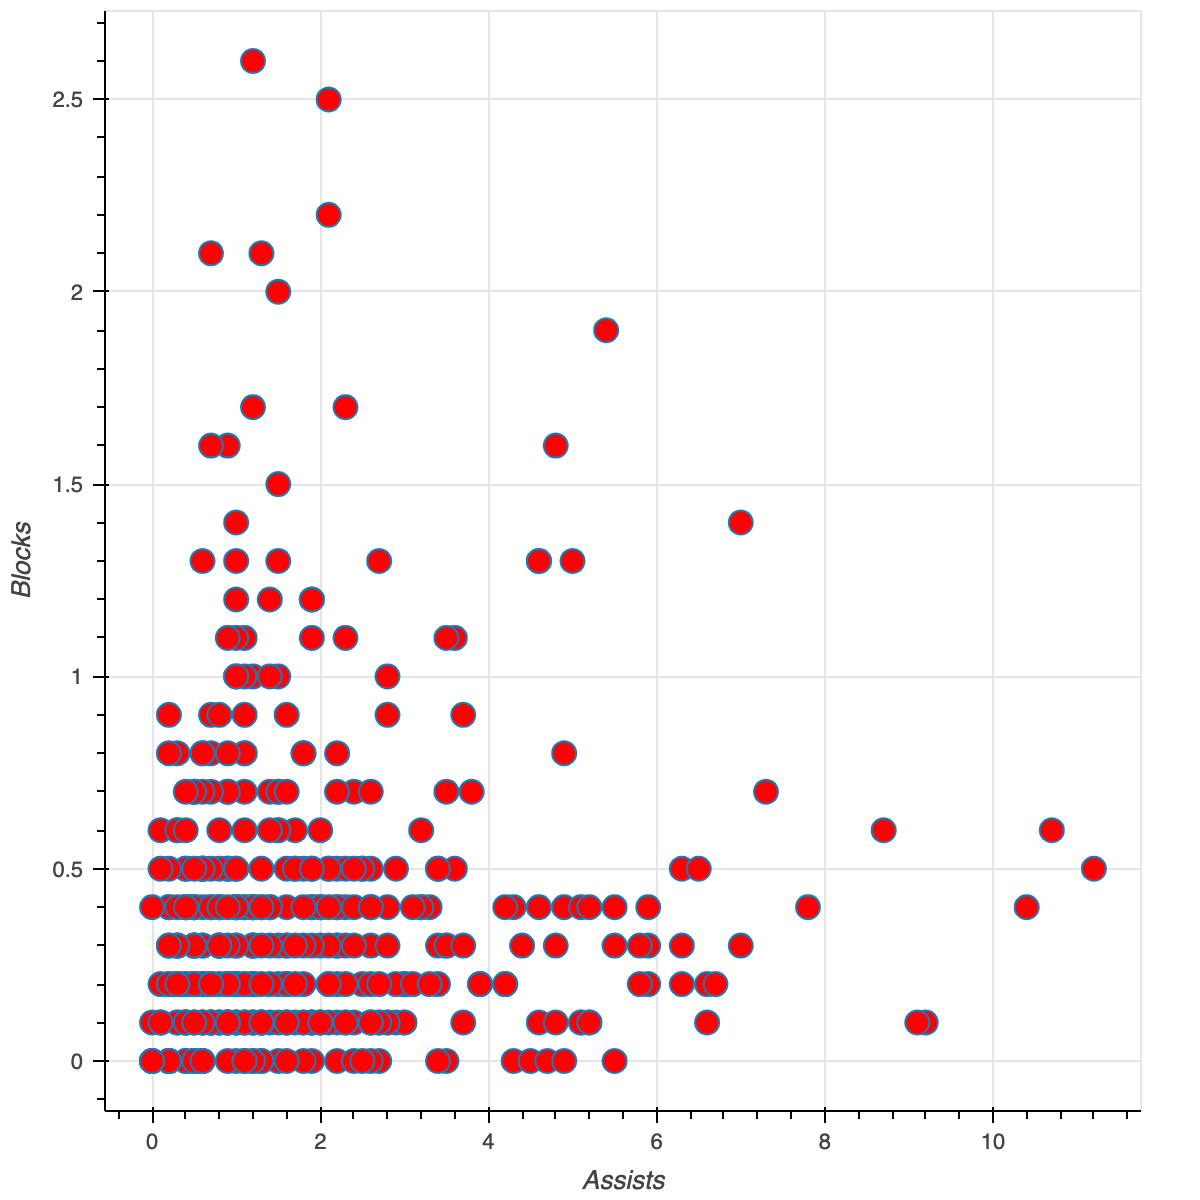
Glyph fill color
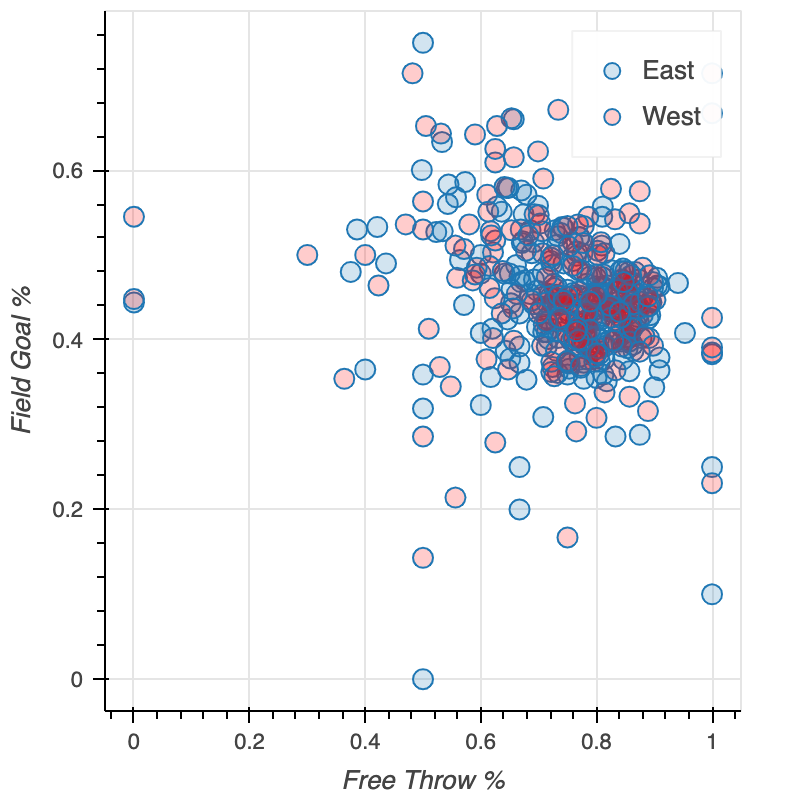
Glyph transparency
Updating glyphs
Interactive Data Visualization with Bokeh
George Boorman
Core Curriculum Manager, DataCamp

