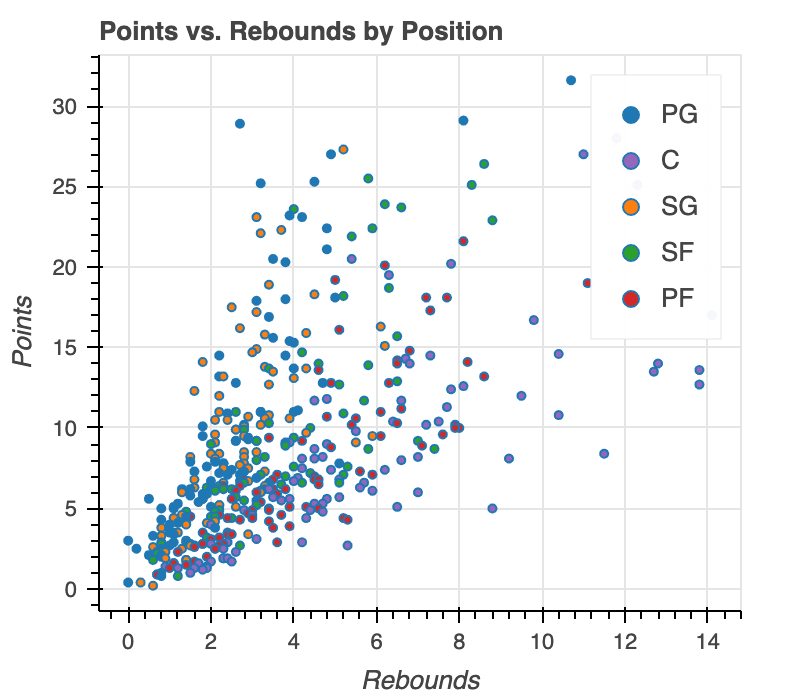
Highlighting and contrasting
Interactive Data Visualization with Bokeh

George Boorman
Core Curriculum Manager, DataCamp
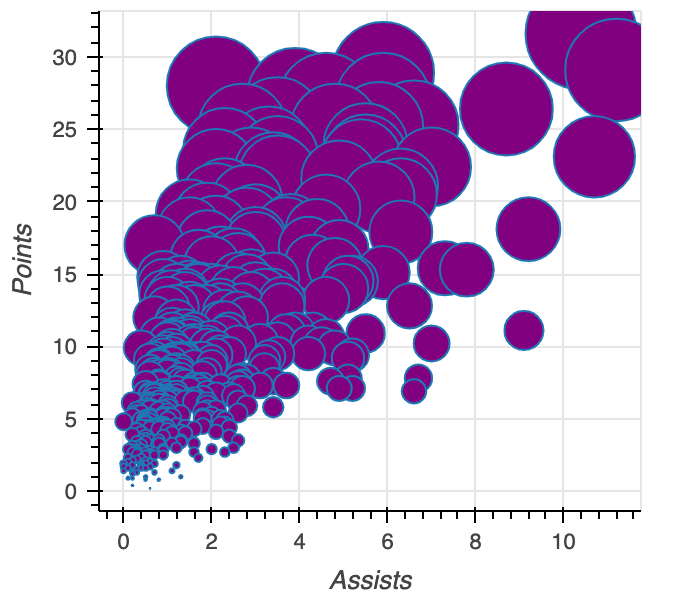
Different sizes

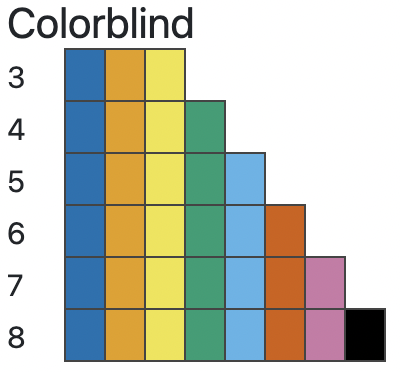
Palettes
from bokeh.palettes import Inferno3

from bokeh.palettes import Colorblind4
Color mapping and color bars
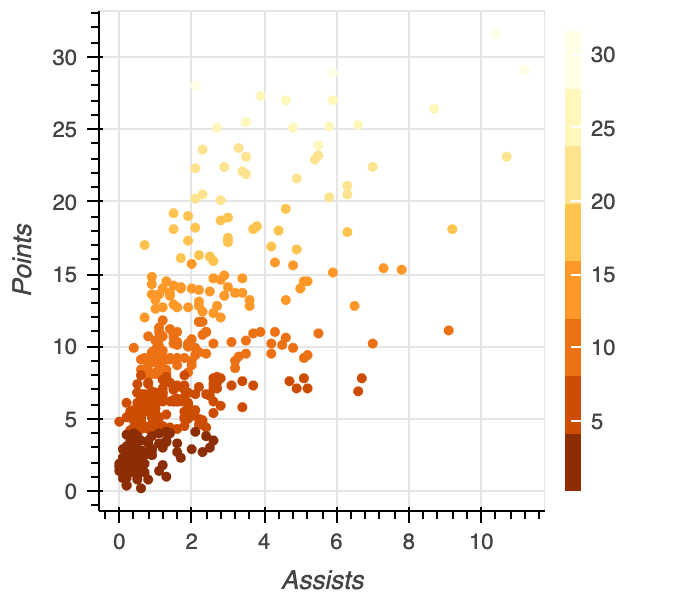
Linear color map scatter plot
Color categorized bar plot