Configuration tools
Interactive Data Visualization with Bokeh

George Boorman
Core Curriculum Manager, DataCamp
The default toolbar
- PanTool
pan
- BoxZoomTool
box_zoom
- WheelZoomTool
wheel_zoom
- Save
save
- Reset
reset
Pan/drag tools
PanTool
pan
BoxSelectTool
box_select
BoxZoomTool
box_zoom
LassoSelectTool
lasso_select

Click/tap tools
- PolySelectTool
poly_select
- TapTool
tap

Scroll/pinch tools
- WheelZoomTool
wheel_zoom
- WheelPanTool

xwheel_panywheel_pan
Customizing the toolbar
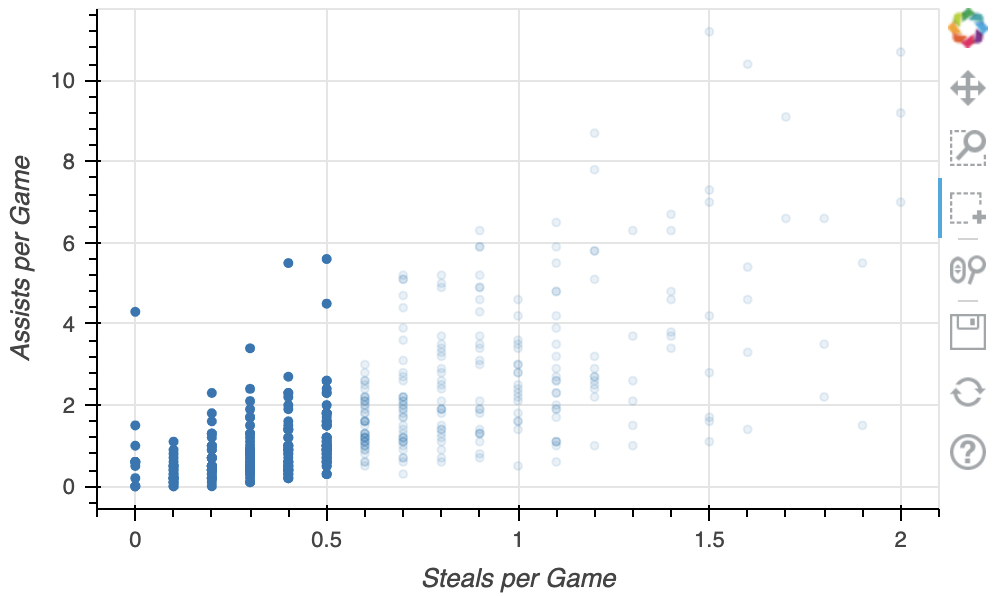
Custom list of tools
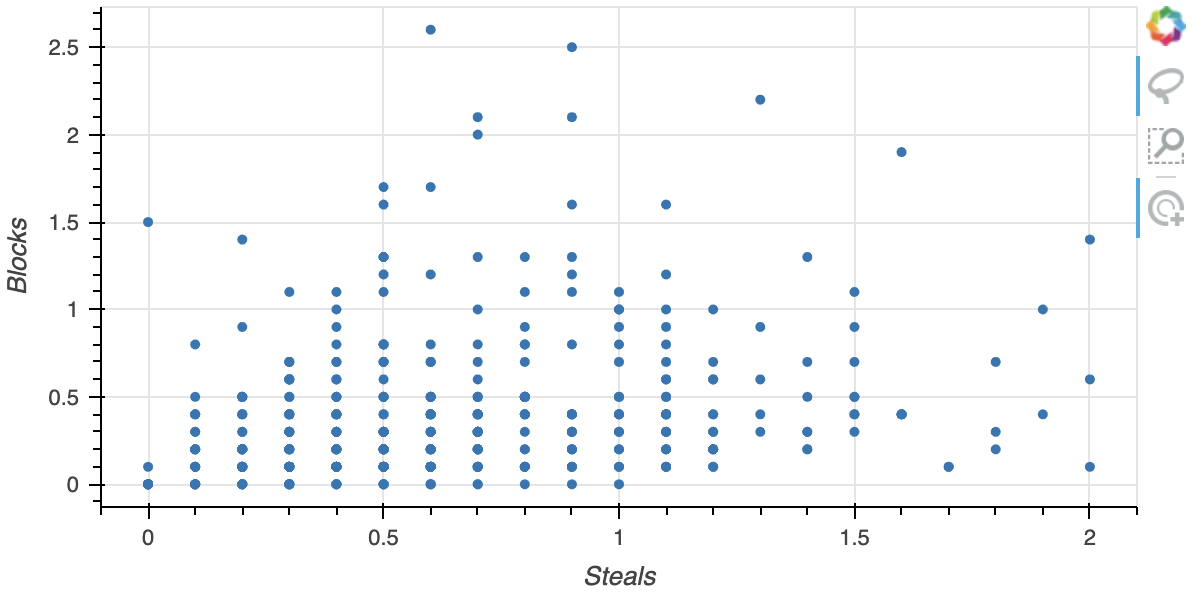
tools = ["lasso_select", "box_zoom", "tap"]fig = figure(x_axis_label="Steals", y_axis_label="Assists",tools=tools)fig.circle(x=nba["steals"], y=nba["assists"]) output_file(filename="custom_tools.html") show(fig)