Visualizing categorical data
Interactive Data Visualization with Bokeh

George Boorman
Core Curriculum Manager, DataCamp
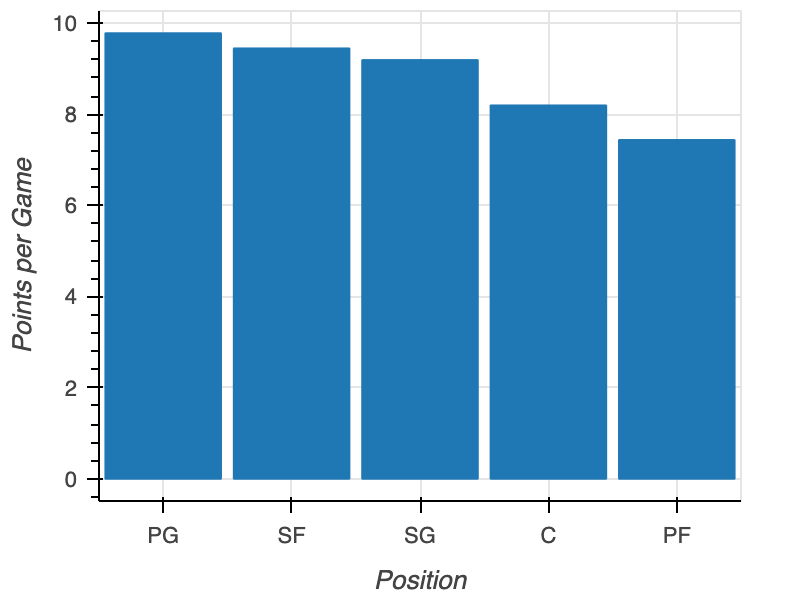
Sorting
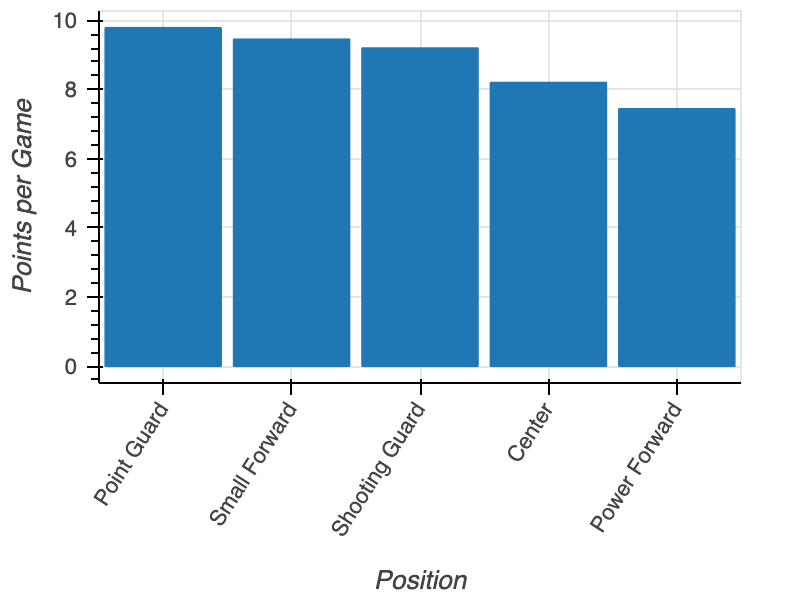
pos = nba.groupby("position")["points"].mean() pos = pos.sort_values("points", ascending=False)fig = figure(x_range=pos["position"], x_axis_label="Position", y_axis_label="Points per Game") fig.vbar(x=pos["position"], top=pos["points"]) output_file(filename="sorted_plot.html") show(fig)
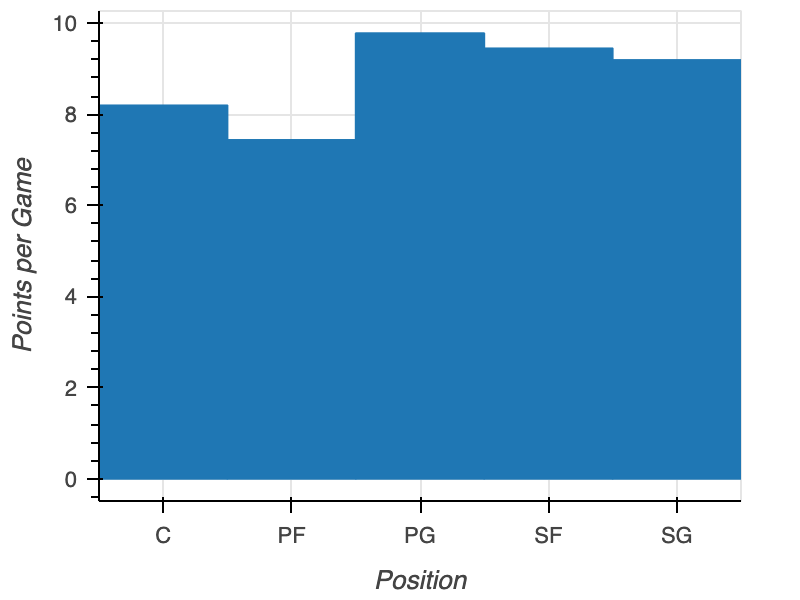
Padding
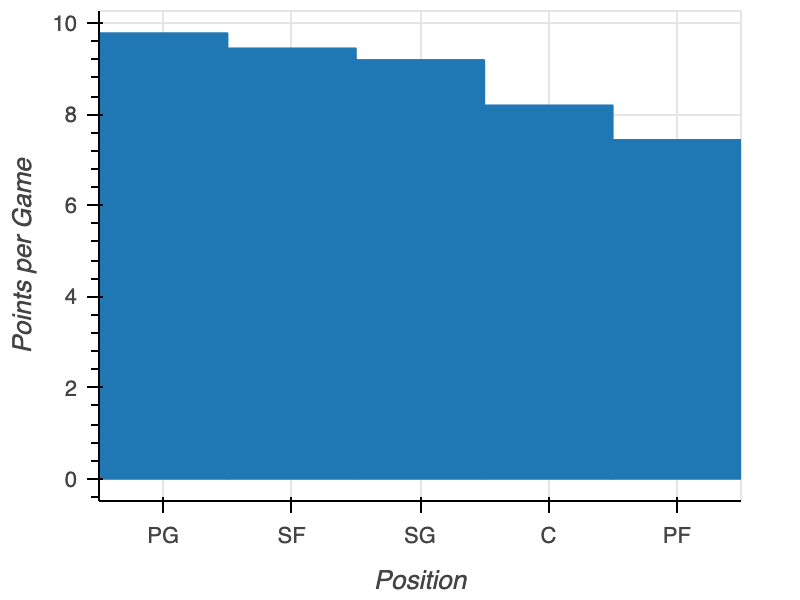
Rotated x-axis labels
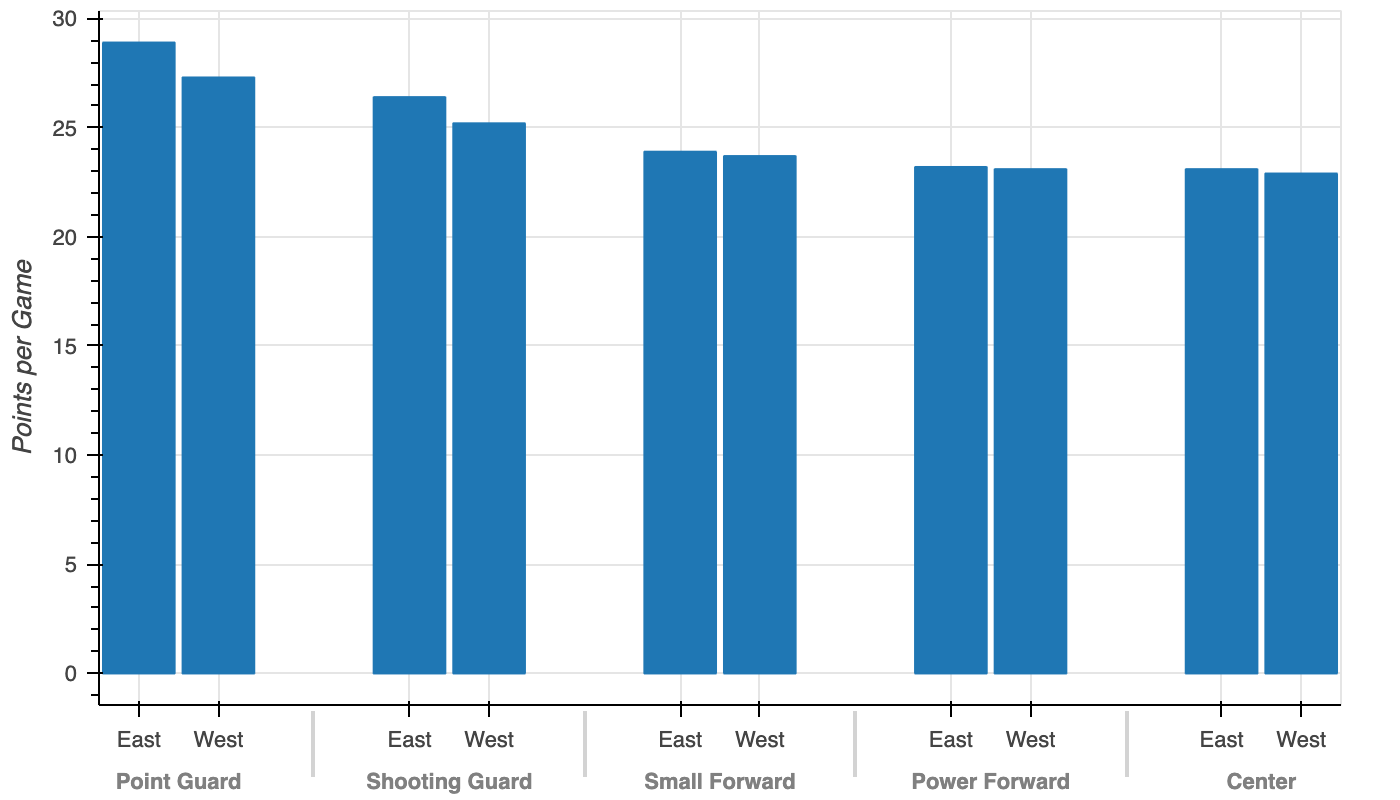
Grouped bar plot