Introduction to widgets
Interactive Data Visualization with Bokeh

George Boorman
Core Curriculum Manager, DataCamp
Widgets
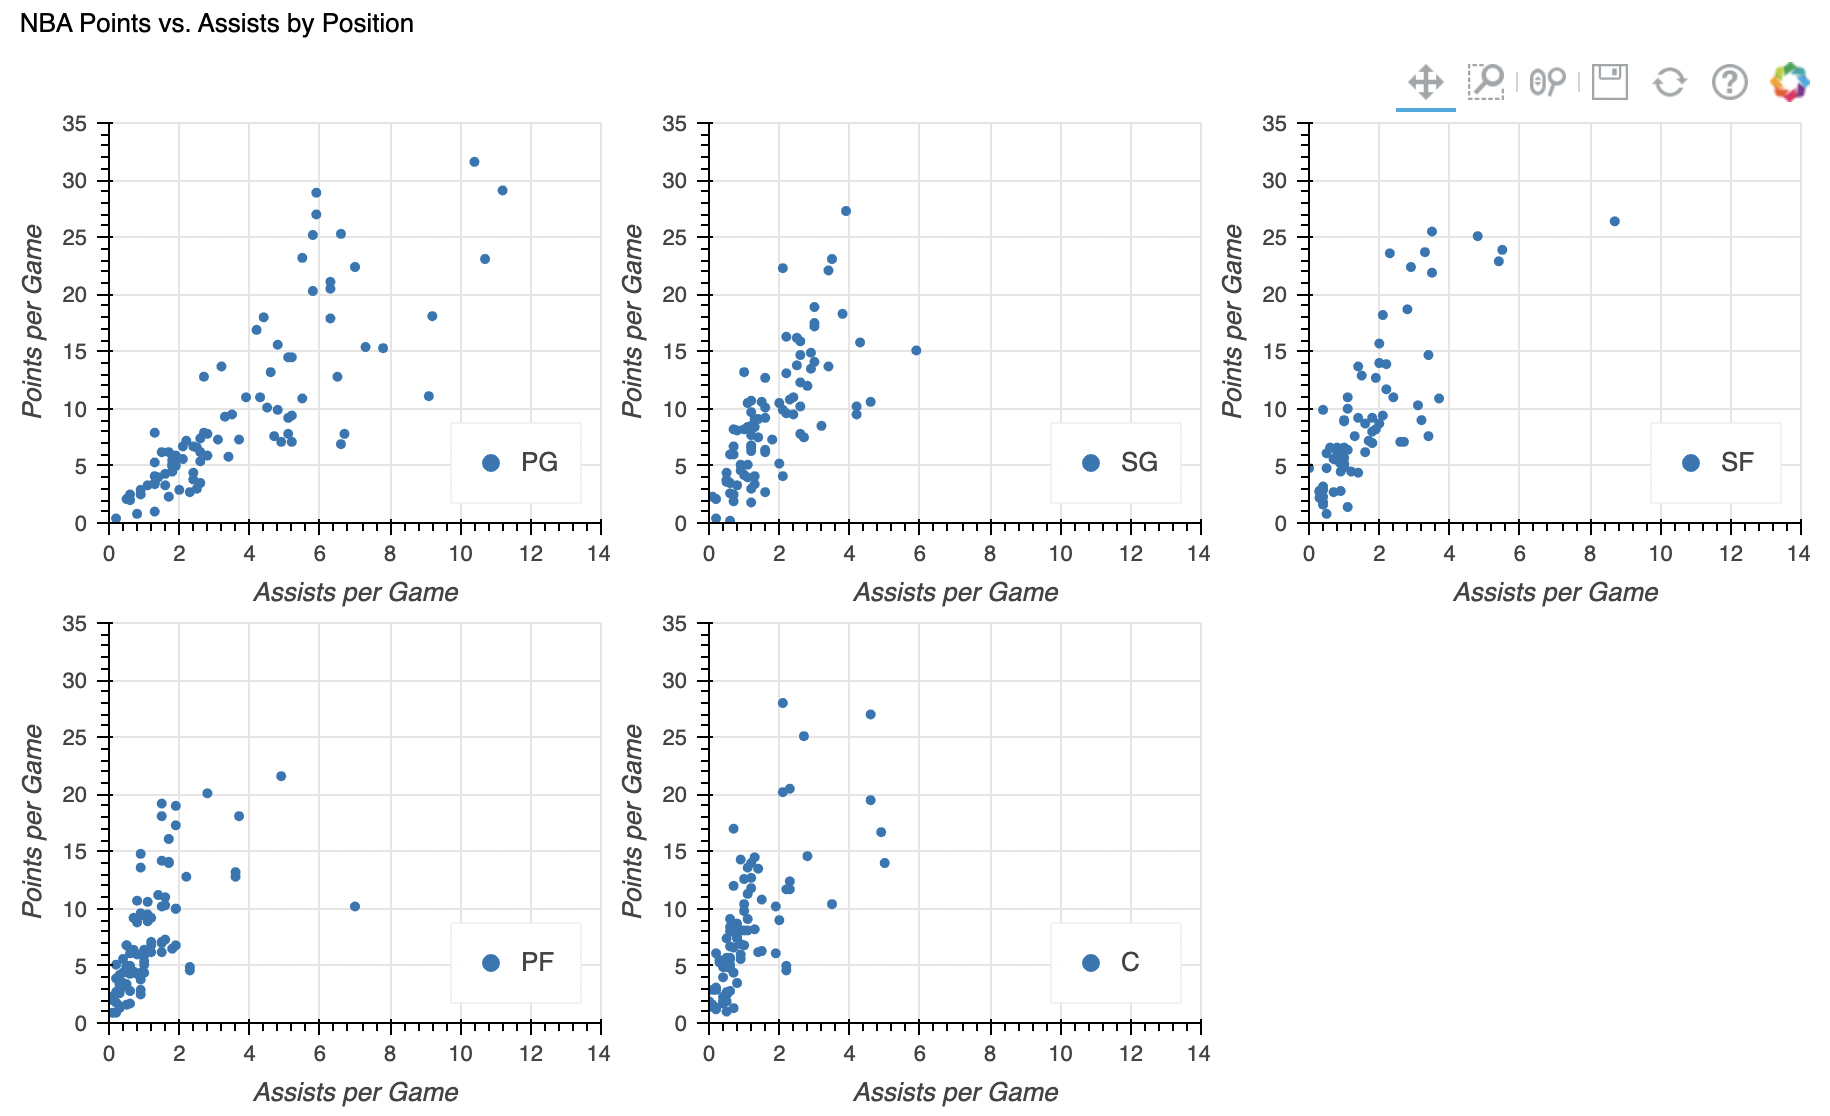
Gridplot with title
Spin into action
Interactive Data Visualization with Bokeh
George Boorman
Core Curriculum Manager, DataCamp

