Job market analysis with Power BI

Case Study: Analyzing Job Market Data in Power BI

Luke Barousse

Data Analyst & YouTuber

What is a case study?

  • Apply Power BI skills
  • Combine previously learned concepts
  • Solve an example real-world problem

$$

Prerequisite courses:

  • Introduction to Power BI
  • Data Visualization in Power BI
  • Introduction to Calculations with DAX in Power BI

casestudy.jpg

Case Study: Analyzing Job Market Data in Power BI

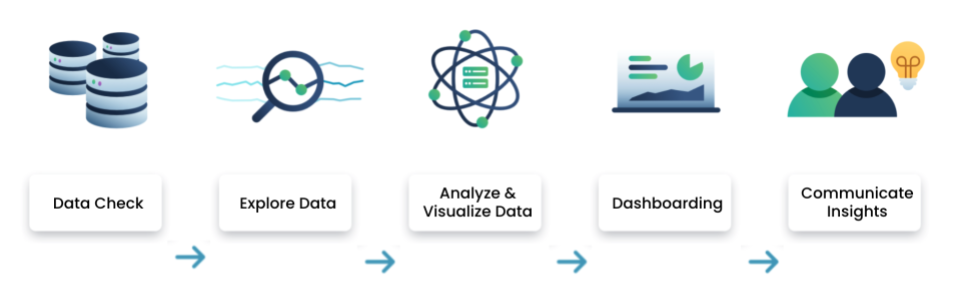
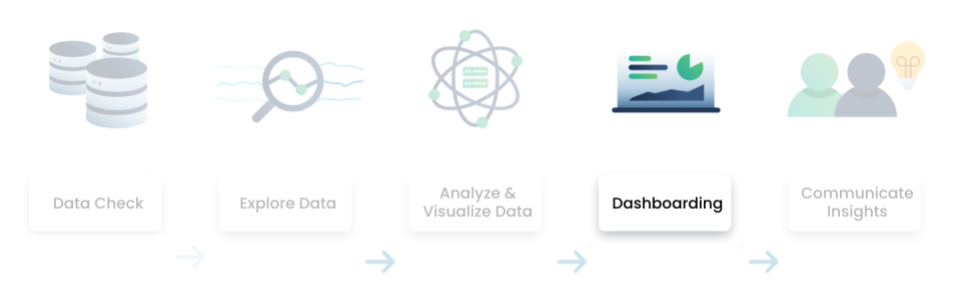
Data analytics pipeline with Power BI

data analysis flow

Case Study: Analyzing Job Market Data in Power BI

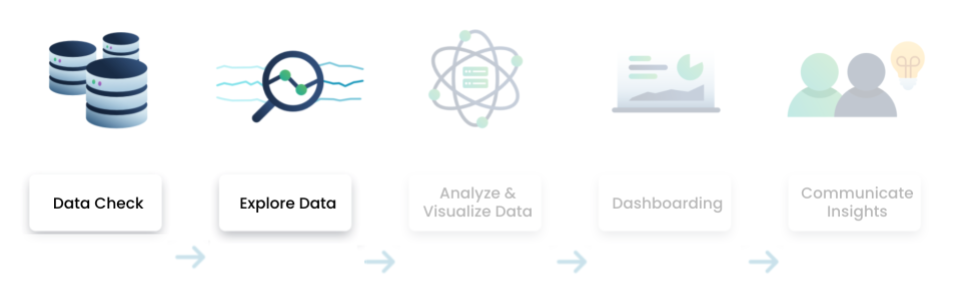
Data analytics pipeline - checking and exploring data

data analysis flow

  • Perform an integrity check of the dataset
  • Exploratory data analysis (EDA)
  • Apply business questions to start investigating the problem
Case Study: Analyzing Job Market Data in Power BI

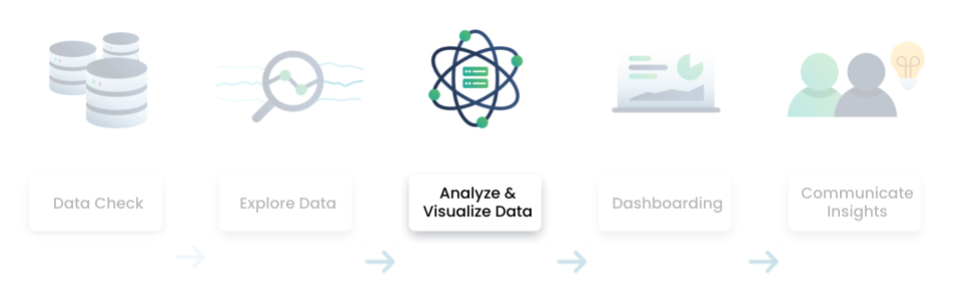
Data analytics pipeline - analyze & visualize

data analysis flow

  • Build overview tables and visualizations
  • Perform more in-depth analytics
Case Study: Analyzing Job Market Data in Power BI

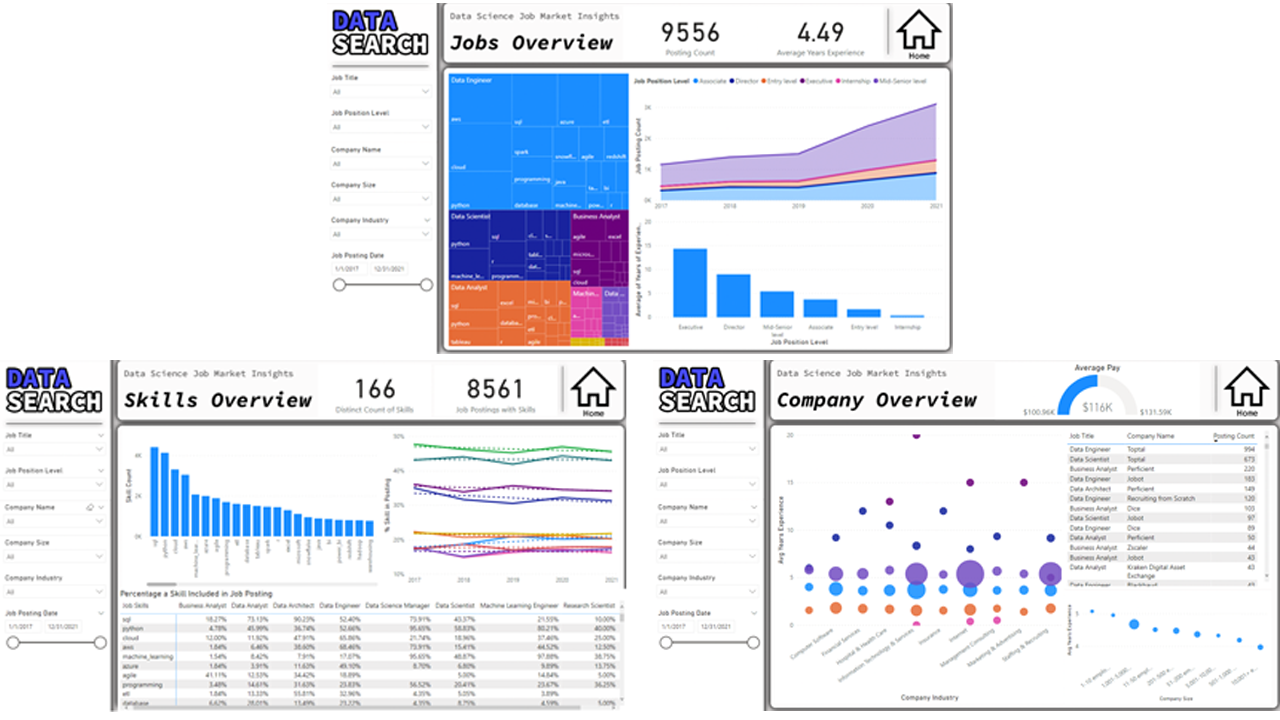
Data analytics pipeline - dashboarding

data analysis flow

  • Combine visualizations into a few dashboards
  • Design with the problem and audience in mind
Case Study: Analyzing Job Market Data in Power BI

Problem to solve

Investigate market trends for data science roles

  • The context: An employee recruiting firm, DataSearch, needs to uncover job trends
  • The task: Discover trends in jobs and skills within the data science industry
  • The dataset: A fictitious collection of key details from job postings

$$ job_market.jpg

Case Study: Analyzing Job Market Data in Power BI

Market trends to watch

The job market is a classic supply and demand problem.

  • Quantity: The number of job postings
  • Price: Corresponds to salary
  • Supply: Those looking for employment
  • Demand: The amount of employment opportunities

Supply vs Demand

Case Study: Analyzing Job Market Data in Power BI

The data

Key characteristics

  • Key details from job postings from 2017 to 2021 for jobs in the data science industry
  • Each row correlates to a specific job posting in time
  • One table containing 19 columns

job_postings.png

Case Study: Analyzing Job Market Data in Power BI

The data

Qualitative Columns

Column name Description
Job Posting Id The unique ID that identifies a job
Job Title Data Analyst, Data Scientist, ...
Job Position Type Full-time, Contract
Job Position Level Internship, Entry-level, Executive, ...
Job Skills ['powerbi, excel, sql'], ['python', 'databases'], ...
... ...
Case Study: Analyzing Job Market Data in Power BI

The data

Quantitative Columns

Column name Description
Job Posting Date The date of the job posting
Years of Experience Number of years minimum experience
Minimum Pay Minimum expected salary
Maximum Pay Maximum expected salary
Number of Applicants Number of applicants in first 24 hours of job posting
... ...
Case Study: Analyzing Job Market Data in Power BI

Final deliverable

Final_Dashboards

Case Study: Analyzing Job Market Data in Power BI

Let's practice!

Case Study: Analyzing Job Market Data in Power BI

Preparing Video For Download...