Approximate sampling distributions
Sampling in Python

James Chapman
Curriculum Manager, DataCamp
4 dice

dice = expand_grid(
  {'die1': [1, 2, 3, 4, 5, 6],
   'die2': [1, 2, 3, 4, 5, 6],
   'die3': [1, 2, 3, 4, 5, 6],
   'die4': [1, 2, 3, 4, 5, 6]
  }
)
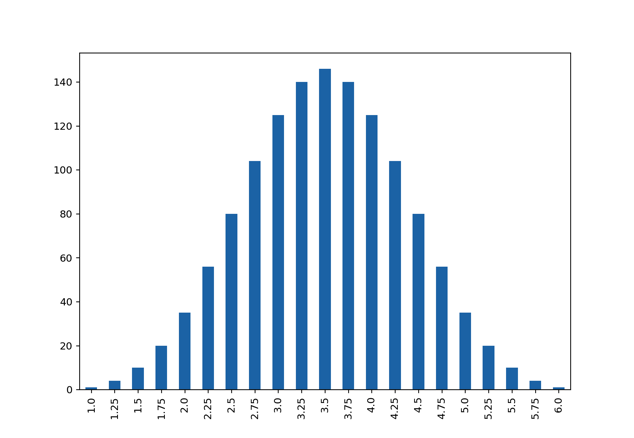
Exact sampling distribution
dice['mean_roll'] = dice['mean_roll'].astype('category')dice['mean_roll'].value_counts(sort=False).plot(kind="bar")
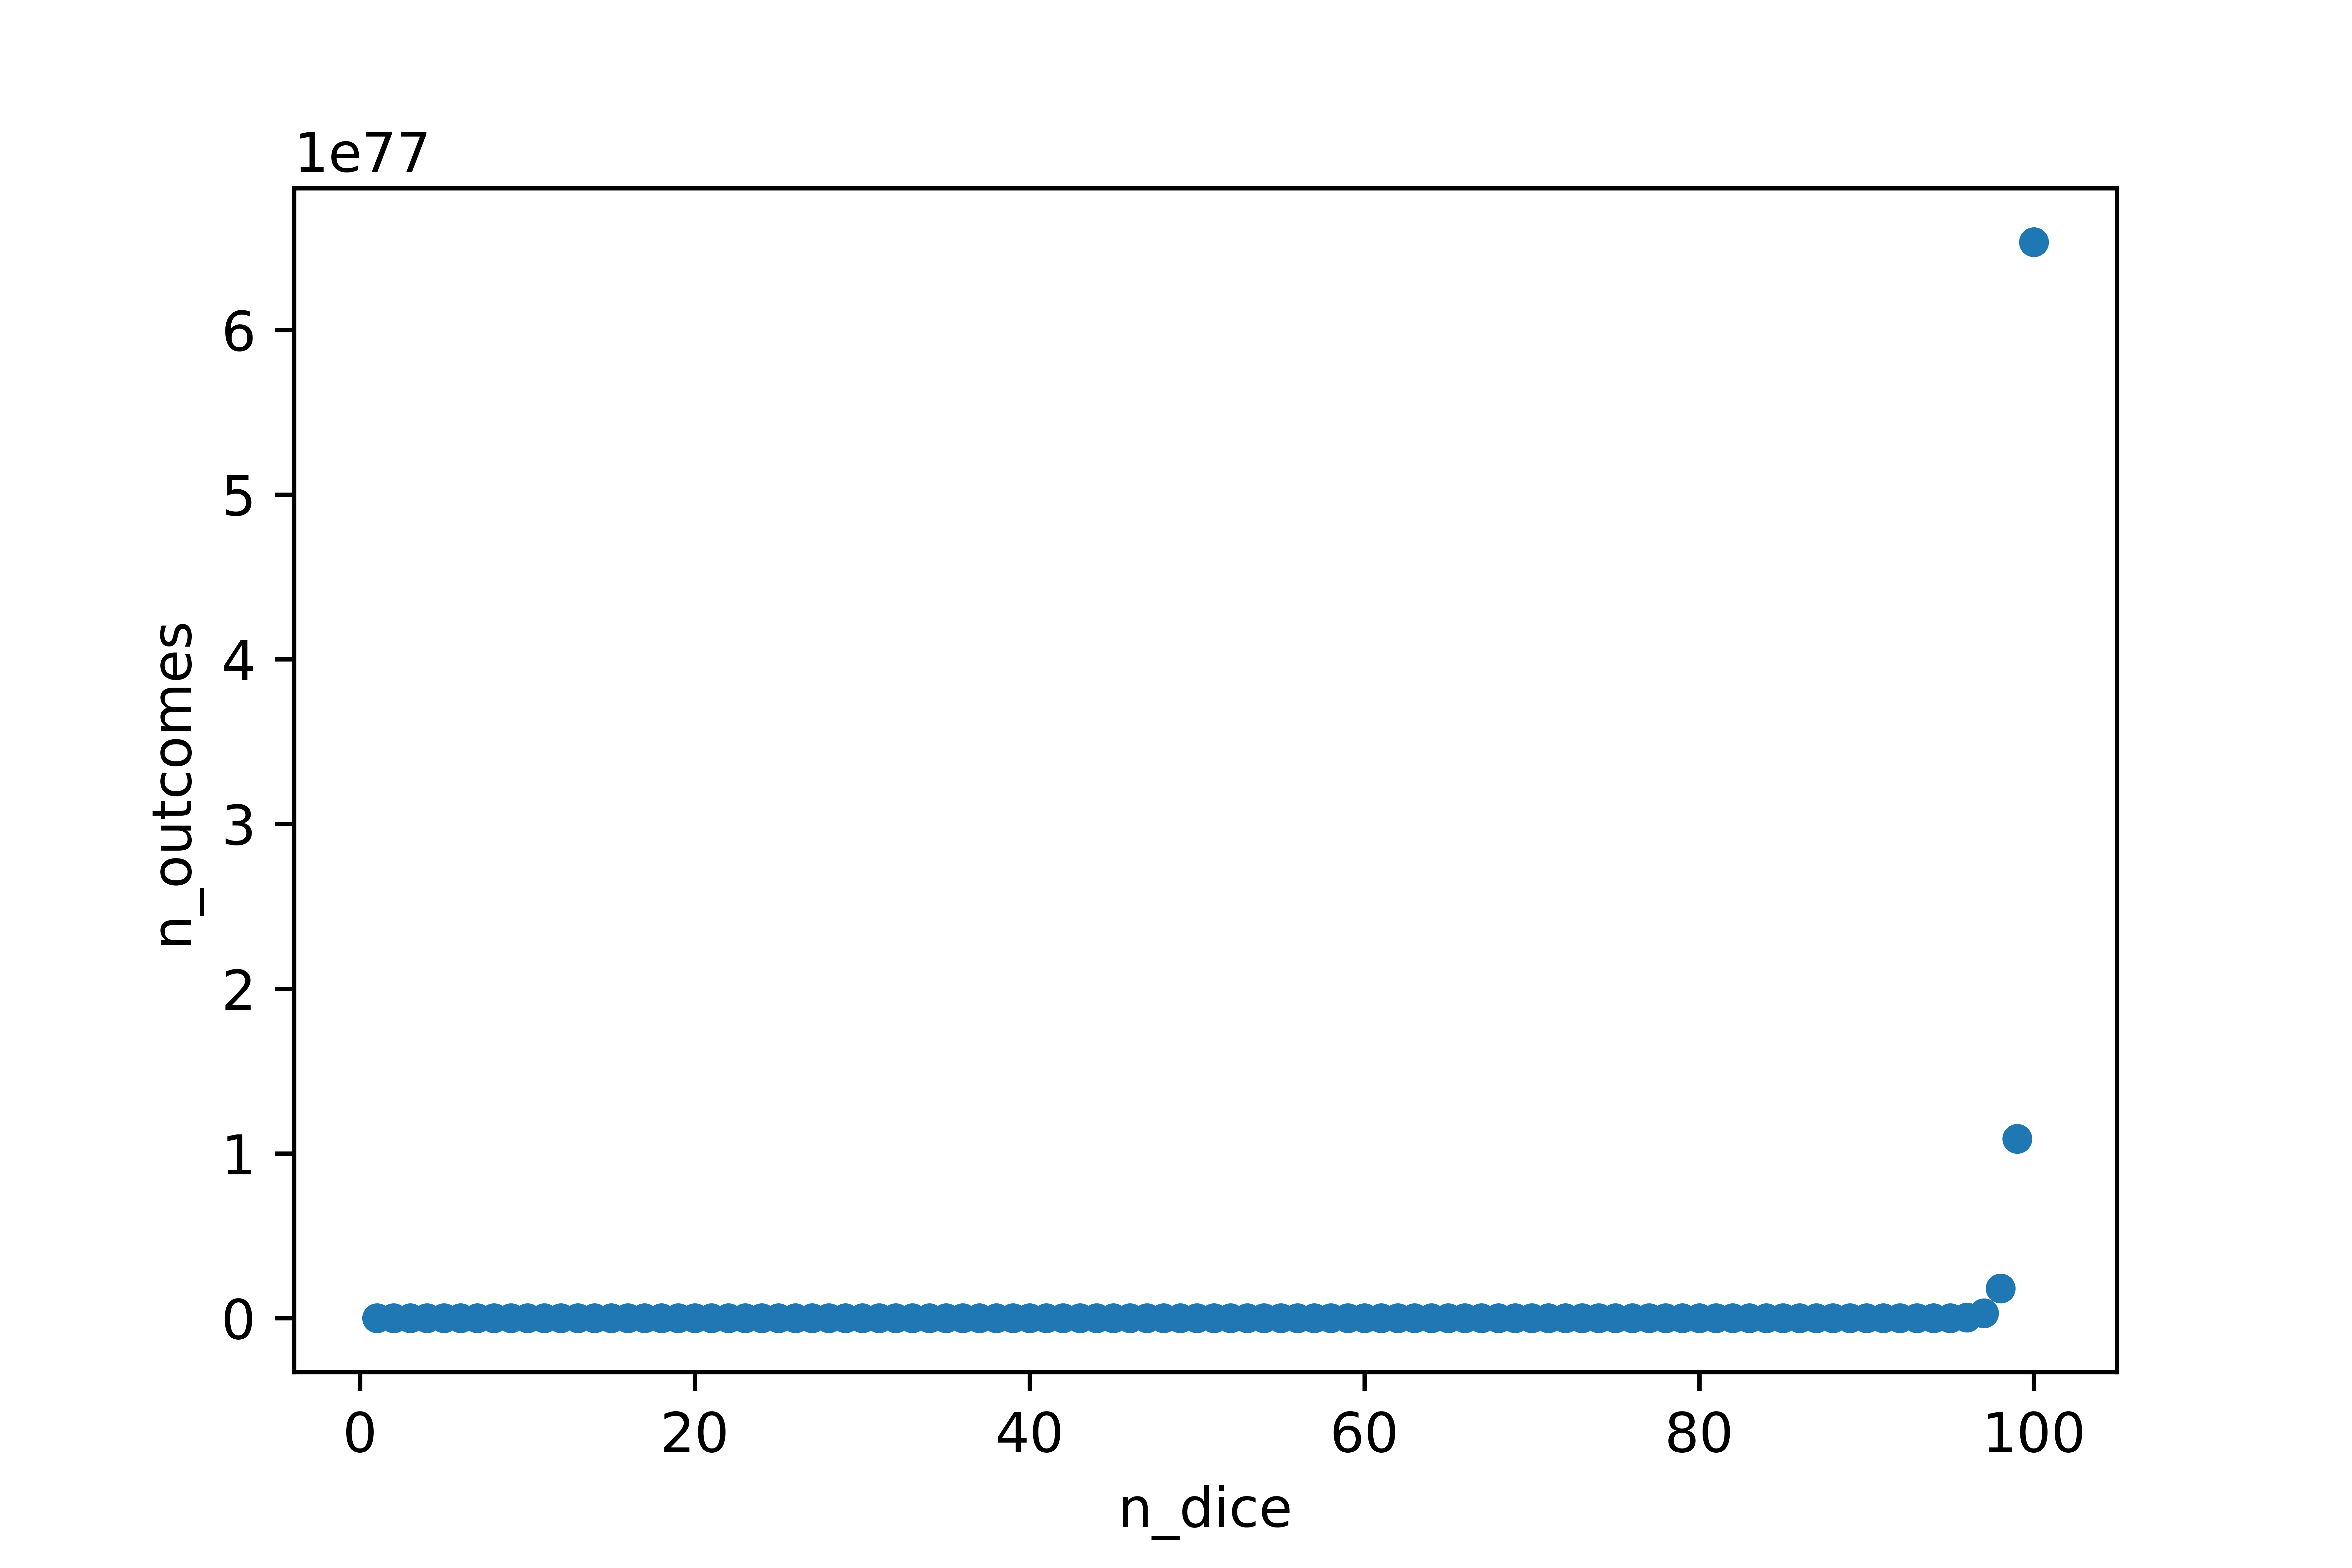
The number of outcomes increases fast
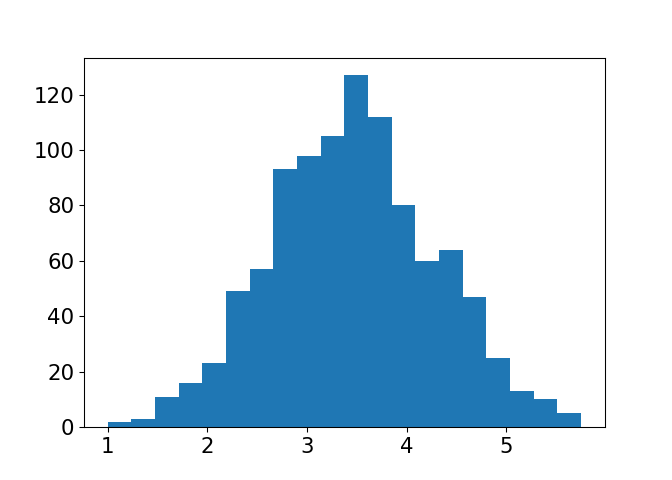
Approximate sampling distribution
plt.hist(sample_means_1000, bins=20)