Data preview features in Power Query

Data Preparation in Power BI

Khaled Choucri

Strategic Analyst - Trilogy

What is data preview?

  • Set of features that allow you to analyze your data in Power Query.
  • Can be found under the View ribbon of Power Query.
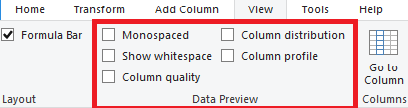
A screen shot of Power Query showing the view ribbon selected and highlighting the data preview features

  • Consists of:

    • Column distribution
    • Column quality
    • Column profile
  • By default, is based on top 1000 rows (but can be changed)

Data Preparation in Power BI

Why use data preview?

  • Helps diagnose errors and inconsistencies in your dataset
  • Shows how a transformation affected your dataset
  • Enables quick analysis of some columns and helps you decide what transformation(s) to use
Data Preparation in Power BI

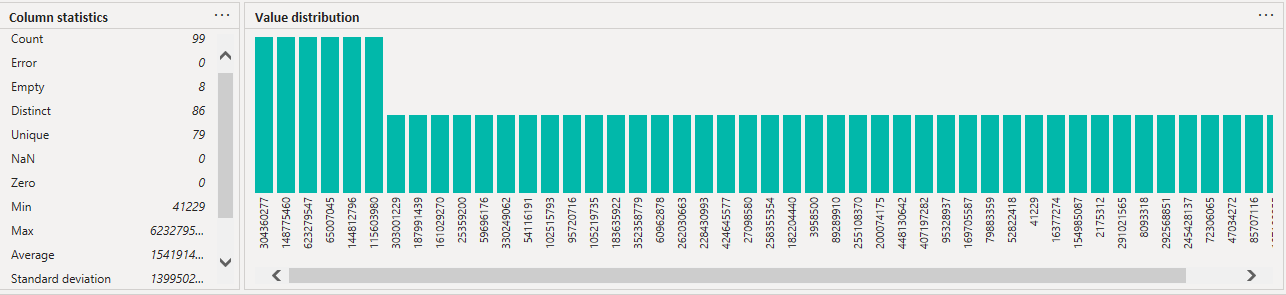
How to use data preview?
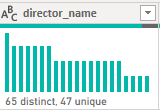
Column distribution
  • Preview the distribution of all columns
  • Count of unique and distinct values
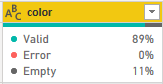
A screen shot showing the output of the column distribution feature.

Column quality
  • Evaluates the amount of valid, error, and missing values in all columns

A screens shot showing the output of the column quality feature.

Column profile
  • Provides statistics for a single column
  • Also shows distribution of data
  • Also shows number of unique and distinct values

Note: Column profile only appears when you select a column

A screen shot showing the output of the column distribution feature.

Data Preparation in Power BI

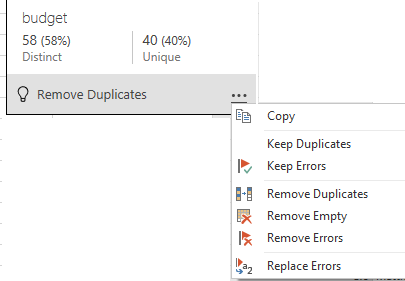
Additional uses for data preview

  • Data preview features also have a contextual menu that can be used to quickly apply some transformations
  • It can be accessed by hovering over the output of the data preview feature.

A screen shot of the contextual menu that appears after hovering over the column quality feature

Data Preparation in Power BI

Let's practice!

Data Preparation in Power BI

Preparing Video For Download...