Calculating p-values from t-statistics

Hypothesis Testing in Python

James Chapman

Curriculum Manager, DataCamp

t-distributions

  • t statistic follows a t-distribution
  • Have a parameter named degrees of freedom, or df
  • Look like normal distributions, with fatter tails

Graph showing the PDF of a standard normal distribution compared to a t-distribution with 1 degree of freedom. The t-distribution has fatter tails and a shorter peak in the middle.

Hypothesis Testing in Python

Degrees of freedom

  • Larger degrees of freedom $\rightarrow$ t-distribution gets closer to the normal distribution
  • Normal distribution $\rightarrow$ t-distribution with infinite df
  • Degrees of freedom: maximum number of logically independent values in the data sample

Graph showing the PDF of a standard normal distribution compared to a t-distribution with various degrees of freedom. As degrees of freedom increases, the tails get narrower and the peak gets higher, more closely resembling the normal distribution.

Hypothesis Testing in Python

Calculating degrees of freedom

  • Dataset has 5 independent observations
  • Four of the values are 2, 6, 8, and 5
  • The sample mean is 5
  • The last value must be 4
  • Here, there are 4 degrees of freedom


  • $df = n_{child} + n_{adult} - 2$
Hypothesis Testing in Python

Hypotheses

$H_{0}$: The mean compensation (in USD) is the same for those that coded first as a child and those that coded first as an adult

$H_{A}$: The mean compensation (in USD) is greater for those that coded first as a child compared to those that coded first as an adult


Use a right-tailed test

Hypothesis Testing in Python

Significance level

$\alpha = 0.1$

If $p \le \alpha$ then reject $H_{0}$.

Hypothesis Testing in Python

Calculating p-values: one proportion vs. a value

from scipy.stats import norm
1 - norm.cdf(z_score)

$SE(\bar{x}_{\text{child}} - \bar{x}_{\text{adult}}) \approx \sqrt{\dfrac{s_{\text{child}}^2}{n_{\text{child}}} + \dfrac{s_{\text{adult}}^2}{n_{\text{adult}}}}$

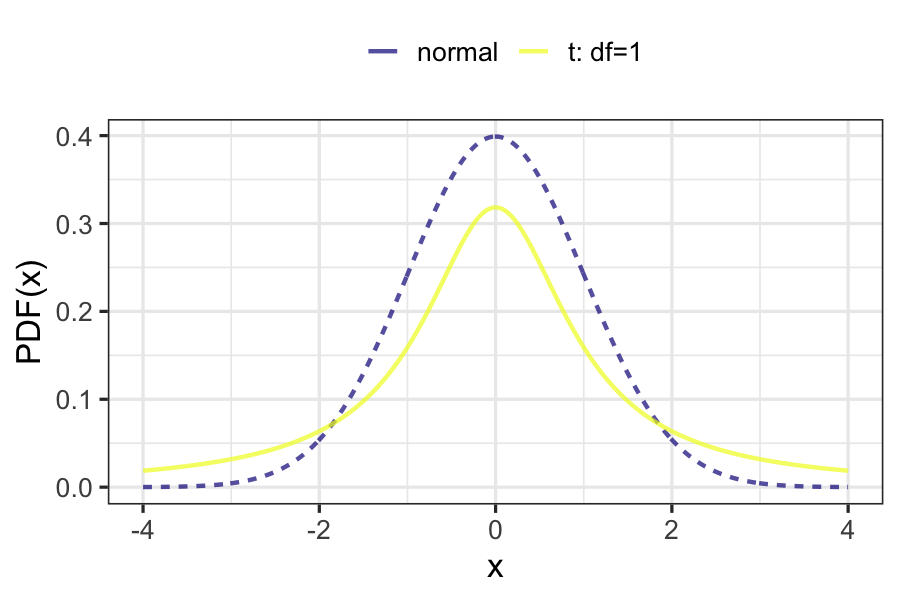
  • z-statistic: needed when using one sample statistic to estimate a population parameter

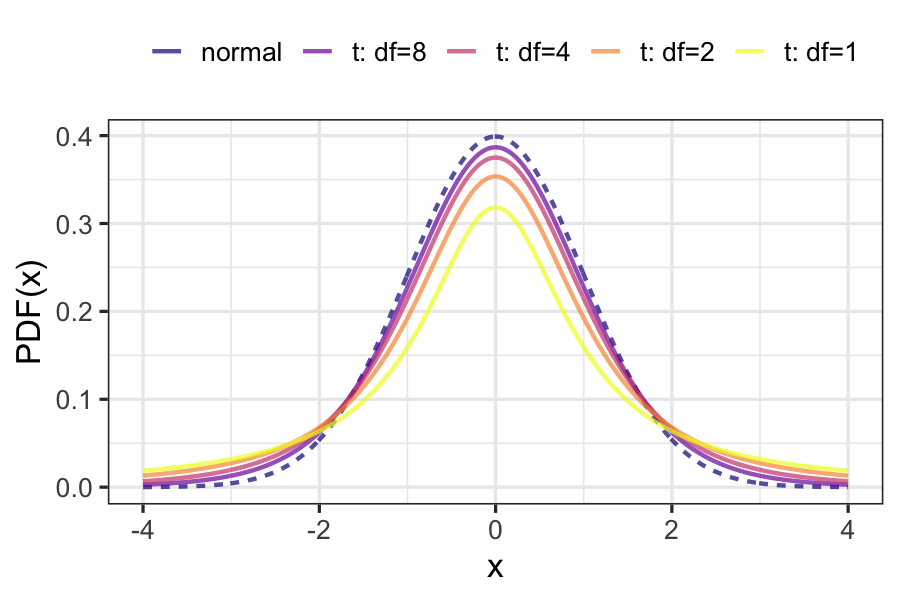
  • t-statistic: needed when using multiple sample statistics to estimate a population parameter

Hypothesis Testing in Python

Calculating p-values: two means from different groups

numerator = xbar_child - xbar_adult
denominator = np.sqrt(s_child ** 2 / n_child + s_adult ** 2 / n_adult)
t_stat = numerator / denominator
1.8699313316221844
degrees_of_freedom = n_child + n_adult - 2
2259
Hypothesis Testing in Python

Calculating p-values: two means from different groups

  • Use t-distribution CDF not normal CDF
from scipy.stats import t
1 - t.cdf(t_stat, df=degrees_of_freedom)
0.030811302165157595
  • Evidence that Stack Overflow data scientists who started coding as a child earn more.
Hypothesis Testing in Python

Let's practice!

Hypothesis Testing in Python

Preparing Video For Download...