Time series analysis
Calculations in Tableau

Maarten Van den Broeck
Content Developer at DataCamp
Seasonality and year-over-year analysis

Study of repetitive patterns in data
- Detect predictable trends
- Determine high and low seasons
- Improve forecasting decisions
Year-over-year comparison:
- Comparison of results per discrete date intervals (e.g., months) across various years.
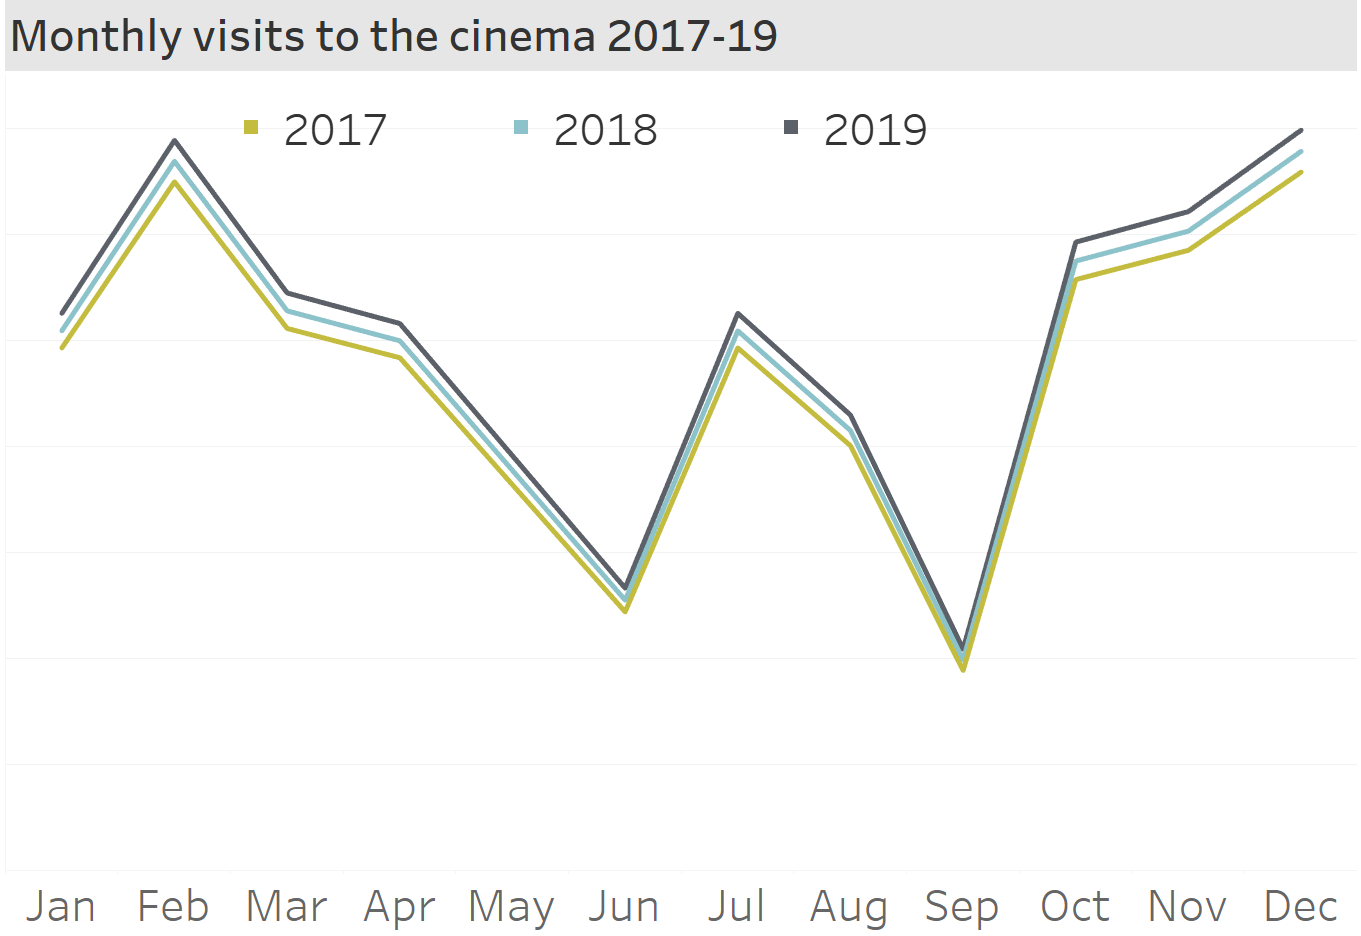
Seasonality of cinema visits, year-over-year:
Year-to-date and custom fiscal years
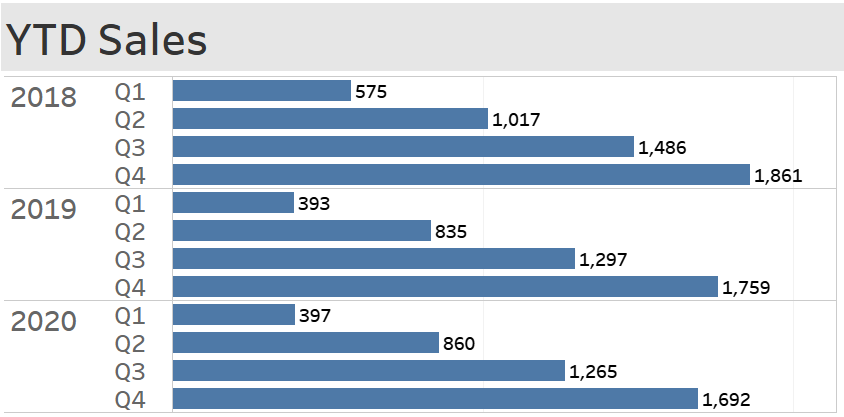
Year-to-date (YTD):
- A Quick Table Calculation
- Calculates from the start of the year to the last known data point in that year
- Also possible as MTD, QTD etc.
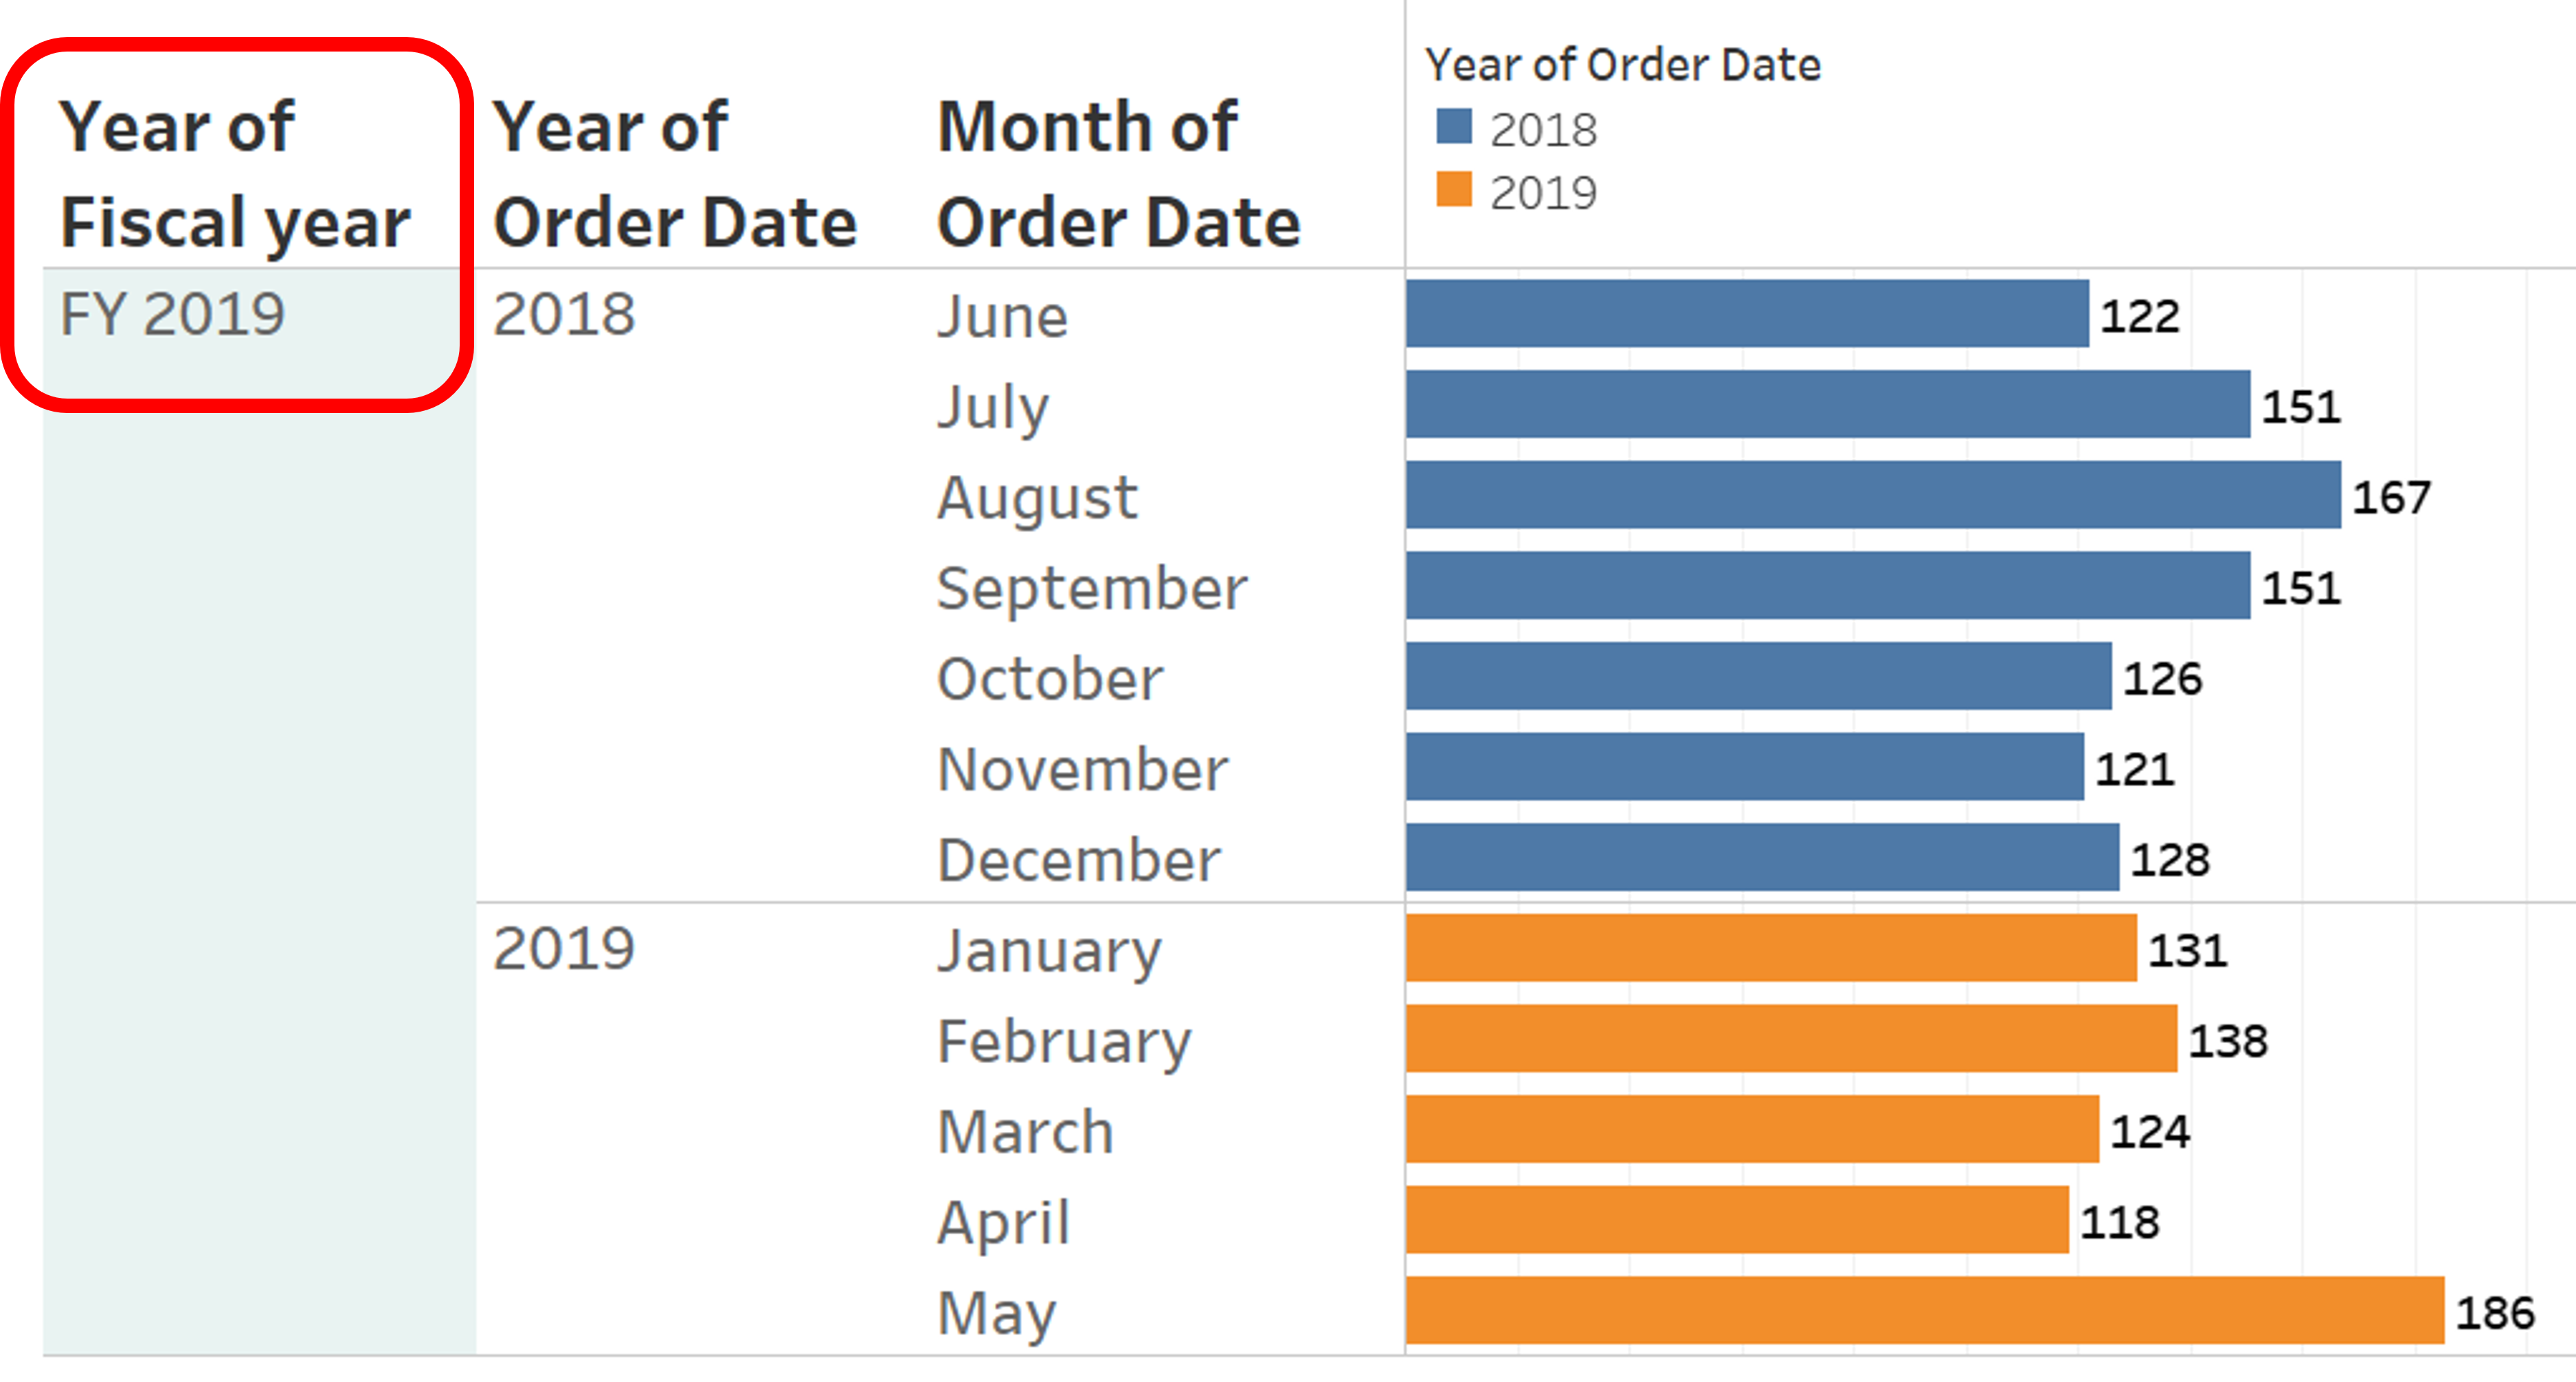
Custom Fiscal Year
- Built-in date property
- Possible to work with various year types in one workbook
Calculating growth
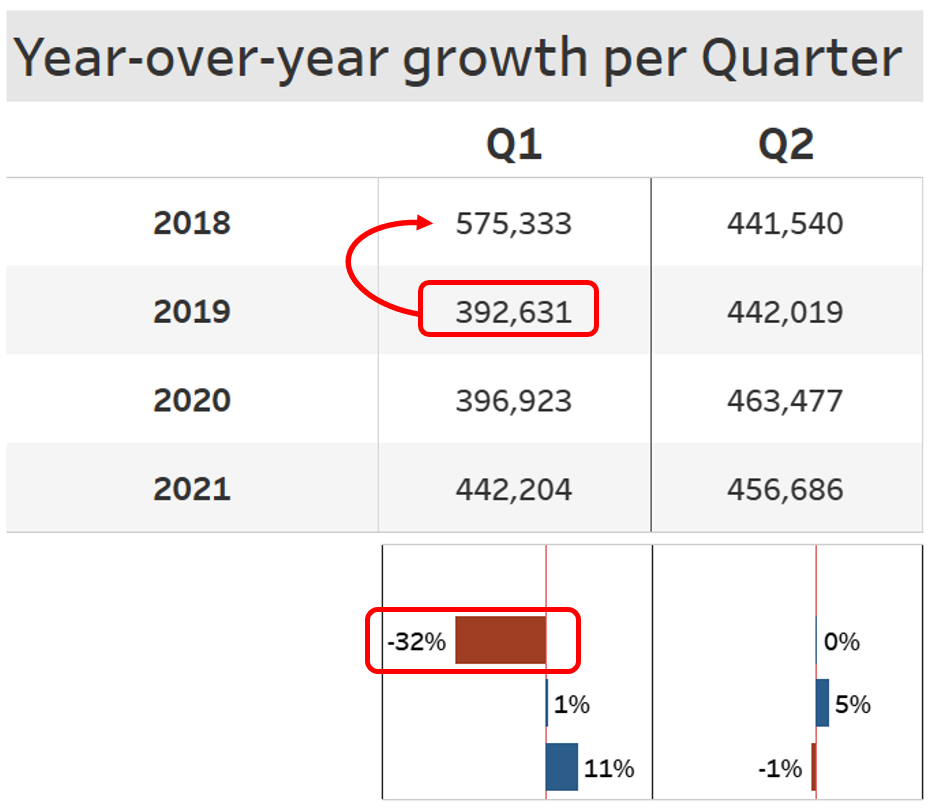
Year over Year Growth :
- A Quick Table Calculation
- Comparing change in a measure to the same period last year (e.g. Q1'19 to Q1'18)
- Requires discrete date dimensions
Calculation behind YoY growth:
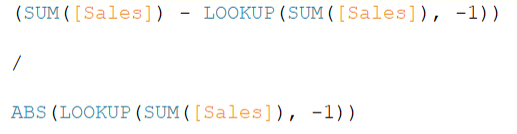
- Table (down) calculation
Year over Year Growth in Tableau:
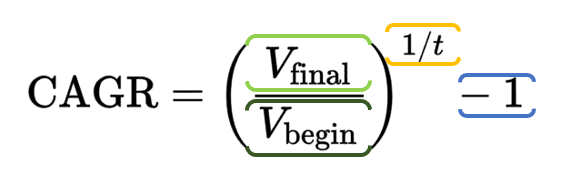
Compound Annual Growth Rate - CAGR
CAGR - mean annual growth rate of a measure over a specified period of time longer than one year (1)
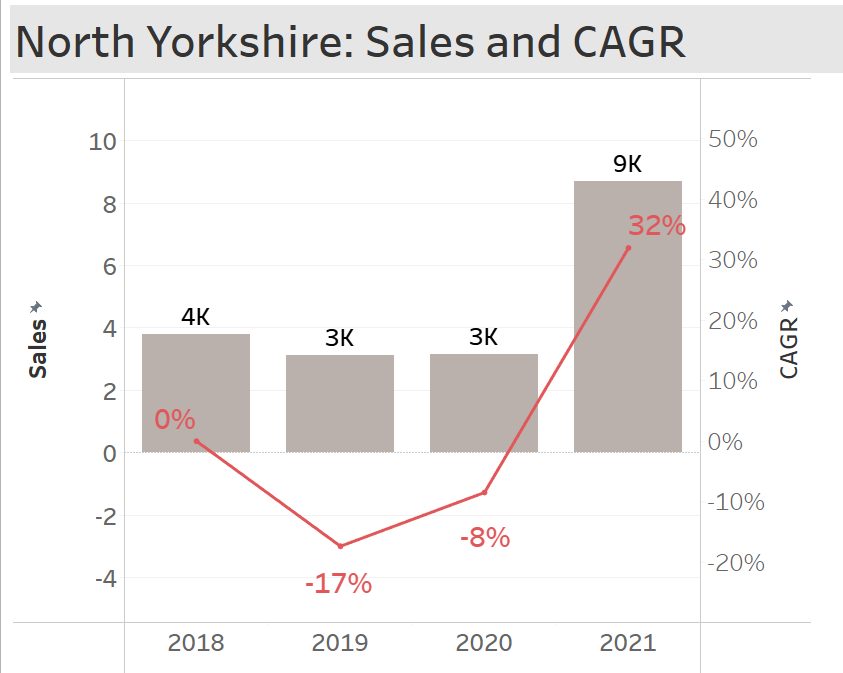
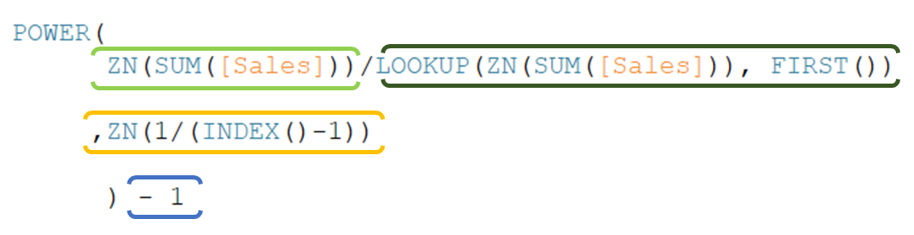
CAGR as a mathematical calculation:
CAGR in Tableau:
1 https://www.investopedia.com/investing/compound-annual-growth-rate-what-you-should-know/
Moving (rolling) calculations
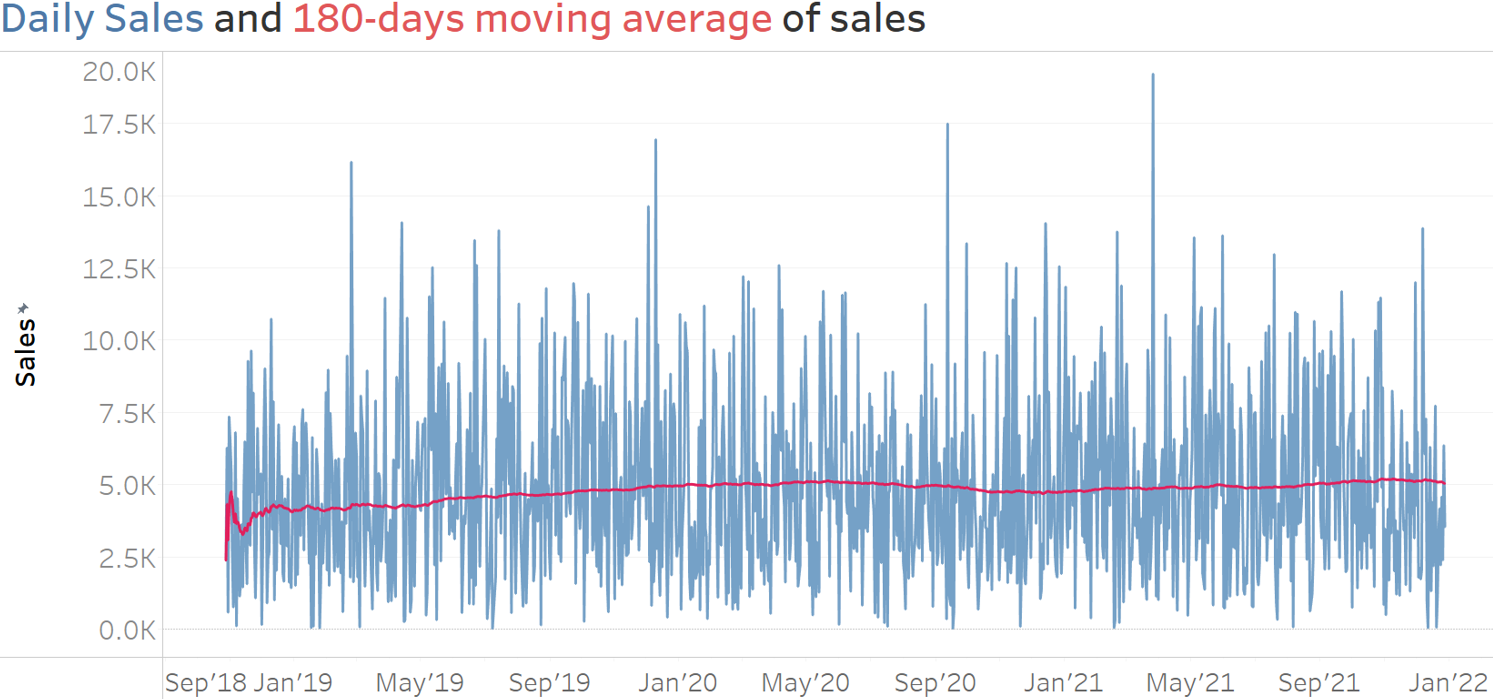
Smoothing fluctuations with moving average
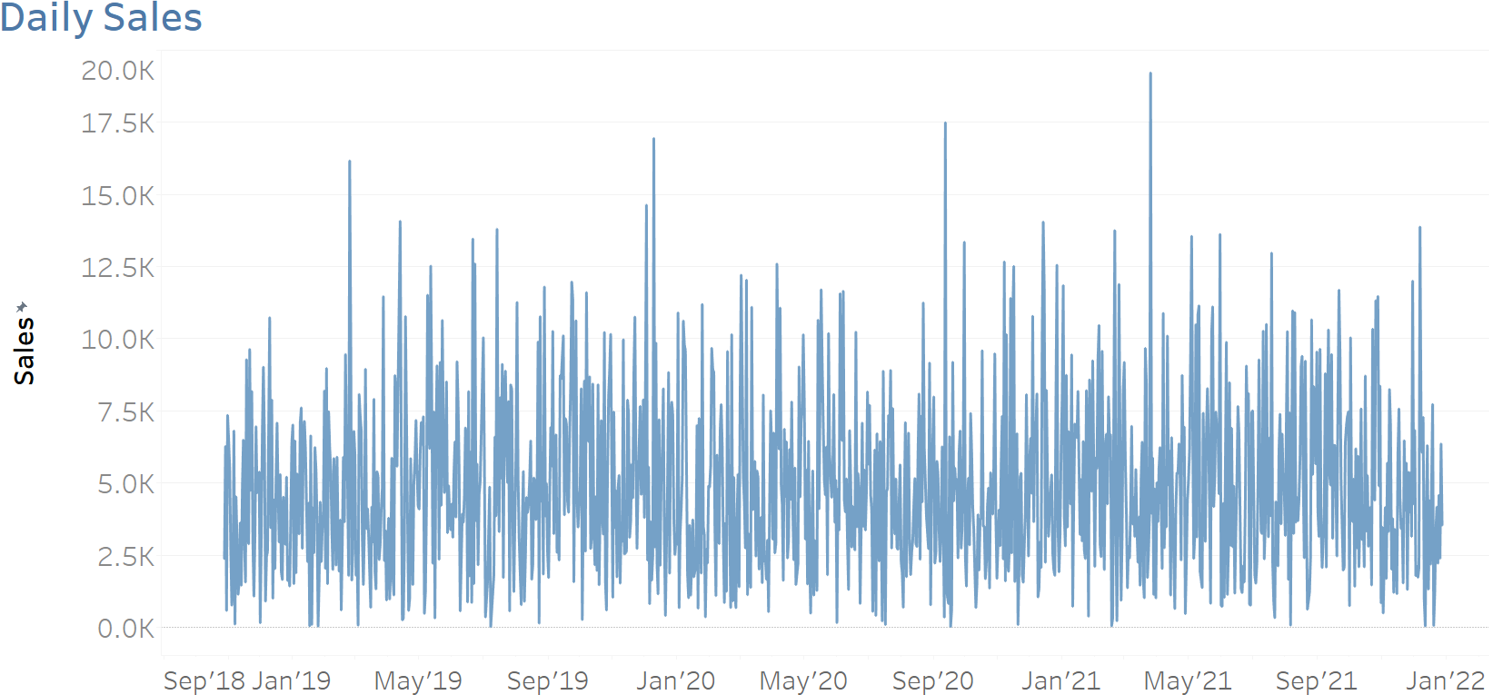
Moving (rolling) calculations
- Calculations across a specified number of values before and/or after the determined point in time
- Used for smoothing fluctuations in data
Used for the long-term trends ("The Big Picture")
E.g., moving
AVG(Sales)over the last 180 days

Smoothing fluctuations with moving average
Keeping it organized
Example of a time-series dashboard
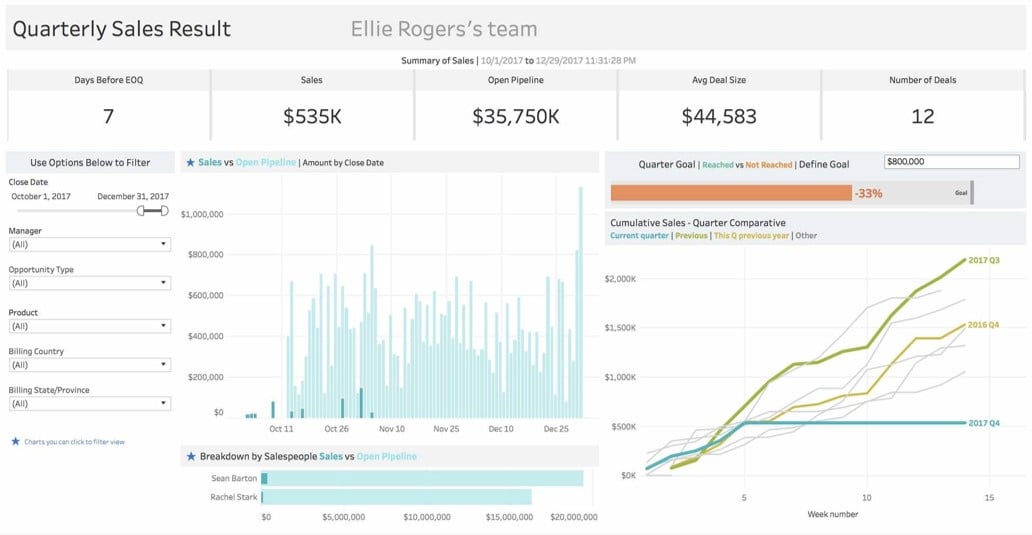
1 https://www.tableau.com/products/accelerators

