Introduction to Table Calculations

Calculations in Tableau

Agata Bak-Geerinck

Senior Data Analyst, Telenet

What are Table Calculations?

A Table Calculation is a transformation to the values in a visualization based only on what is currently on the canvas.

White spacing

  • Disregard measures or dimensions that are filtered out or not present on the canvas

White spacing

  • Computed on the local data in Tableau

White spacing

  • Virtual table of what's in the view versus the underlying data source
Calculations in Tableau

Table Calculations vs. data source

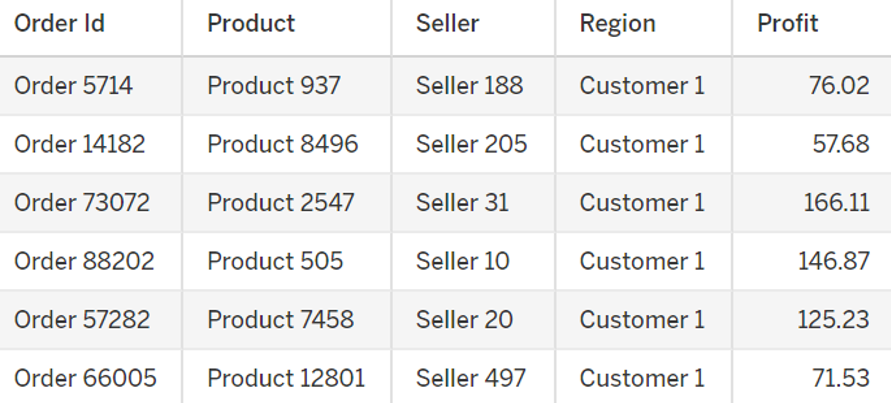
Underlying dataset:

An example of the dataset, with orders, products, sellers, region and profit

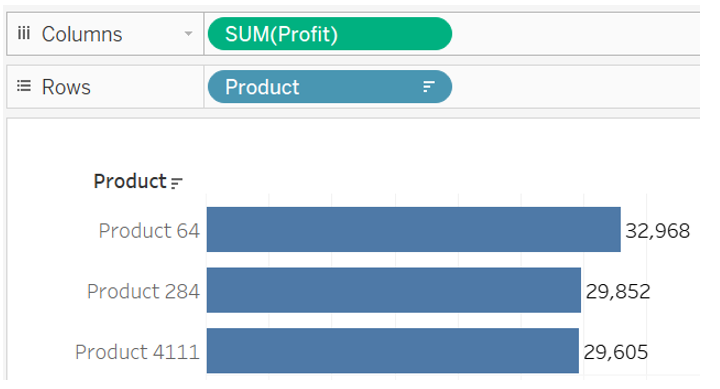
Visualization:

An example of a bar chart, with products in rows and summed profit in columns

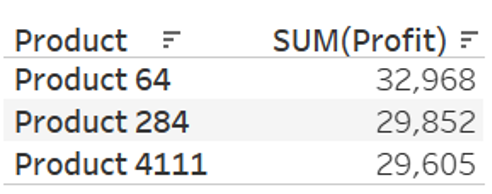
Virtual table:

An example of a virtual table, with product and sum of profit.

Calculations in Tableau

Examples of Table Calculations

White space

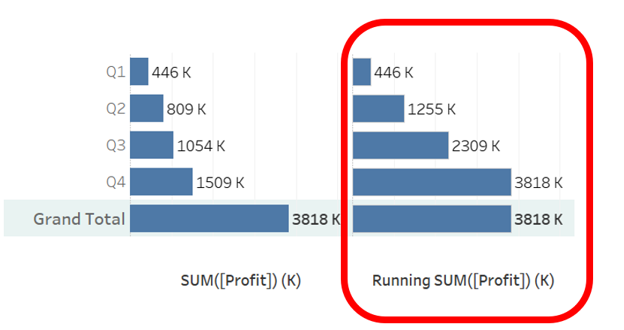
Running (cumulative):

Two bar charts, left one presenting sum of profit per quarter, right one presenting running total of this summed profit, per quarter

White space

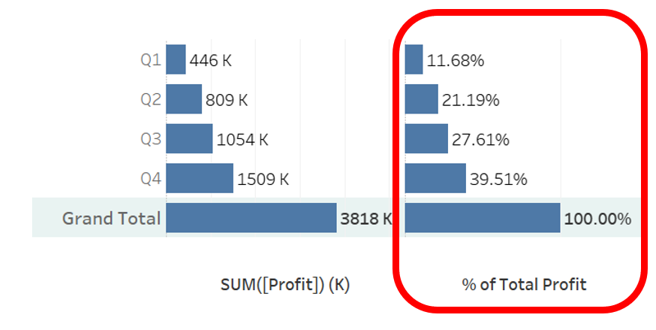
Percentage of total:

Two bar charts, left one presenting sum of profit per quarter, right one presenting percentage of quarterly profit in a year

Calculations in Tableau

Examples of Table Calculations

White space

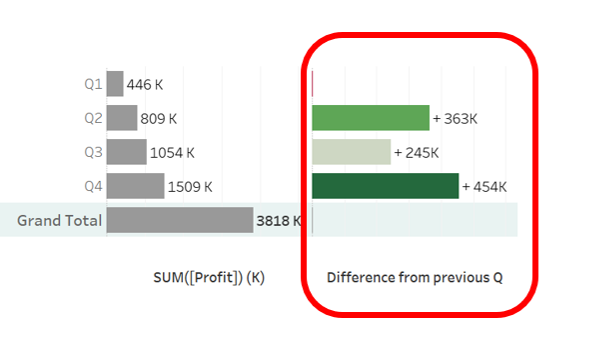
Difference from:

Two bar charts, left one presenting sum of profit per quarter, right one presenting a difference of the sum of profit from the preceding quarter

White space

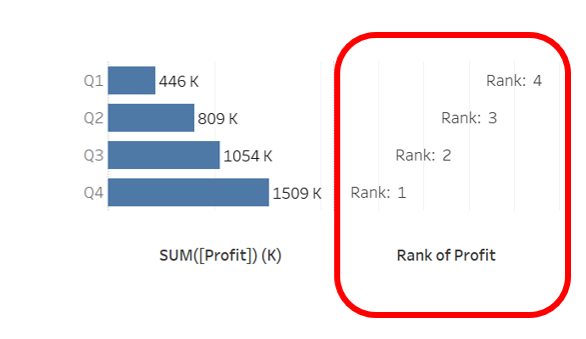
Ranking:

Two bar charts, left one presenting sum of profit per quarter, right one presenting ranking of quarters based on the sum of profit

Calculations in Tableau

Quick Table Calculations in Tableau

White space

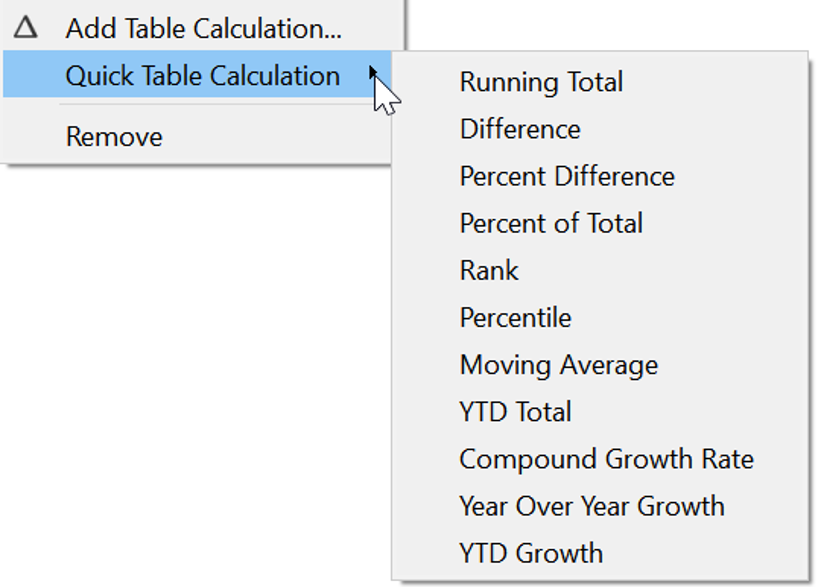
Tableau UI screenshot, presenting how to access Quick Table Calculations

1 Tableau makes most common calculations easy with built-in Quick Table Calculations.
Calculations in Tableau

Multiple dimensions: addressing and partitioning

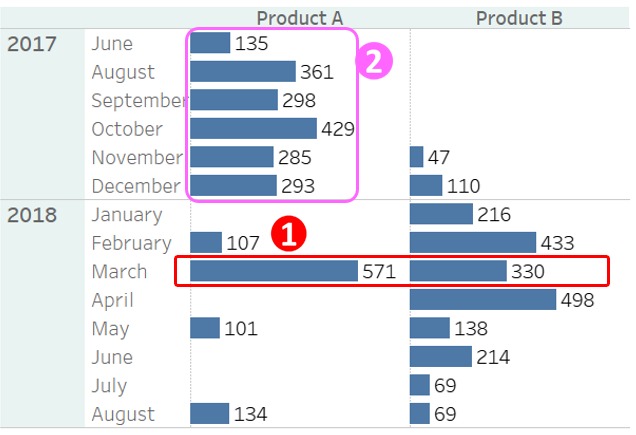
Profit per product per year

A table presenting profit for two products, per month and year

Partitions:

  • Dimension(s) defining how to group = the scope
    • E.g. 1) by year and month
    • E.g. 2) by product and year

Remaining dimensions = addressing fields:

  • Determine in which direction the calculation moves:
    • E.g. 2) month is an addressing field: ordering it from newest to oldest will change the calculation
Calculations in Tableau

Formulas behind Table Calculations

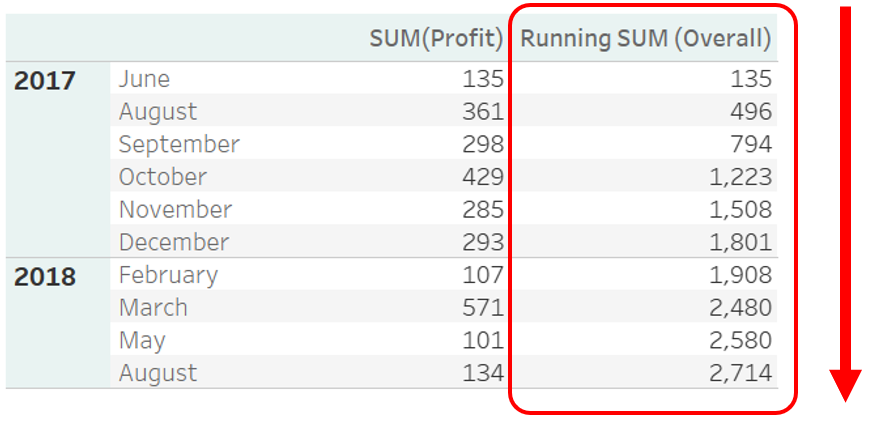
Running functions:

E.g. RUNNING_SUM(),RUNNING_AVG()...

Example of a running sum formula

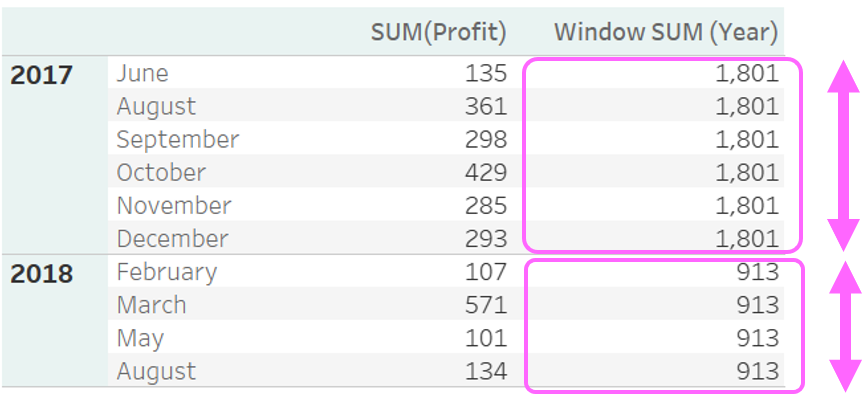
Window functions:

E.g. WINDOW_SUM(),WINDOW_AVG()...

Example of a window sum formula

Profit per product per year

Table of profit per product, month and year, with a running sum calculation

Profit per product per year

Table of profit per product, month and year, with a window sum calculation

Calculations in Tableau

Tableau's Table Calculations assistant

A visual of Tableau's Table Calculations assistant

Calculations in Tableau

The dataset: UK clothing business

A visual with a silhouette of the United Kingdom and examples of textile products sold, e.g. a sweater

Calculations in Tableau

Let's practice!

Calculations in Tableau

Preparing Video For Download...