Introduction to LOD Expressions and FIXED
Calculations in Tableau

Maarten Van den Broeck
Content Developer at DataCamp
Granularity of the data
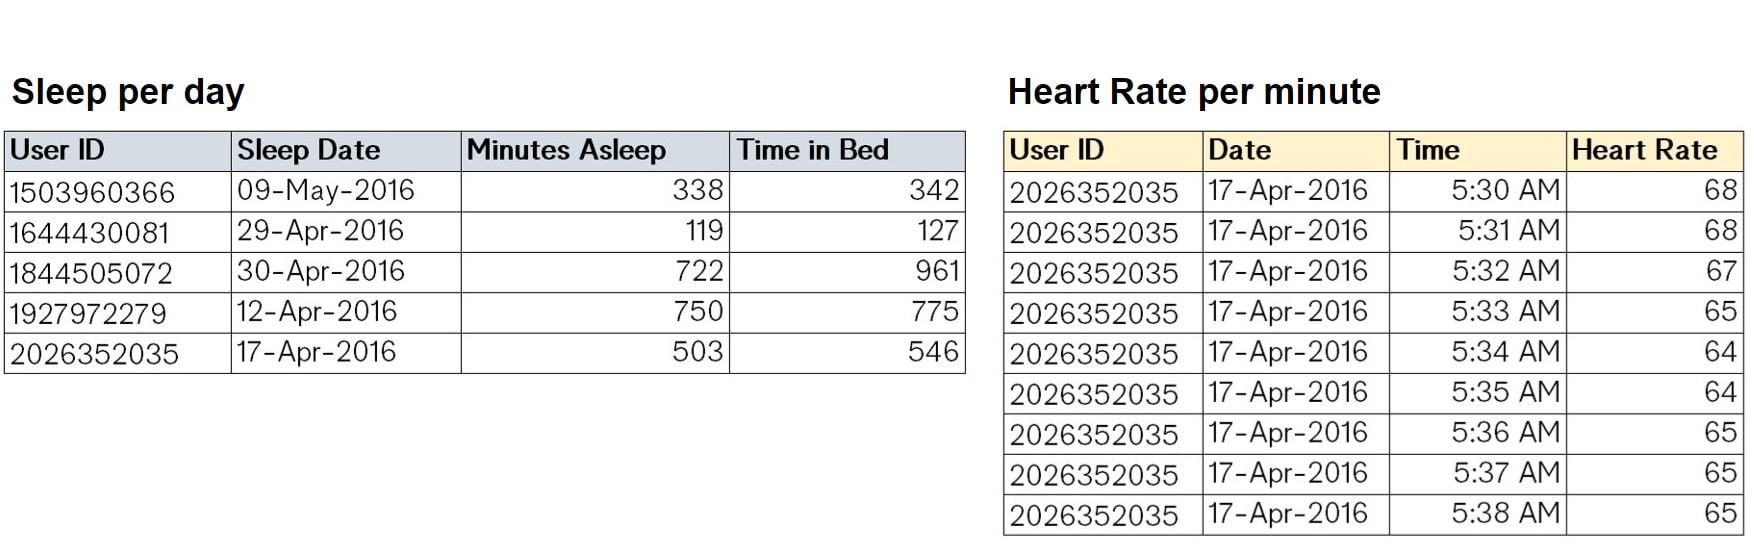
1 Ponniah, P. (2004). Data Warehousing Fundamentals: A Comprehensive Guide for IT Professionals. Wiley.
Granularity of the view
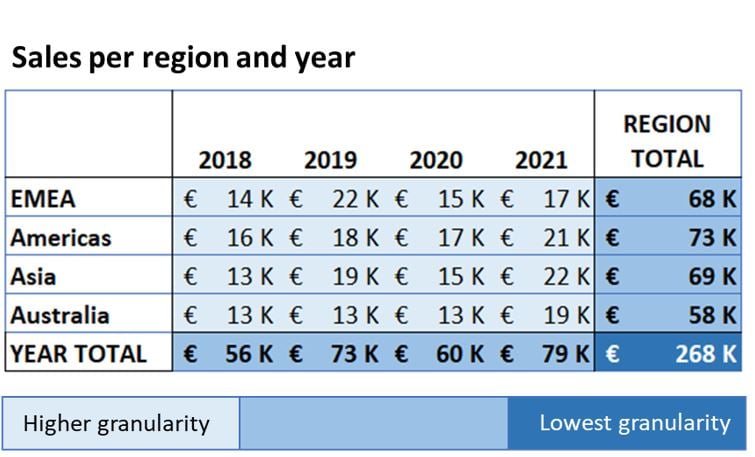
- Add dimensions = increase the data granularity, e.g.
SUM(Sales)per region and per year
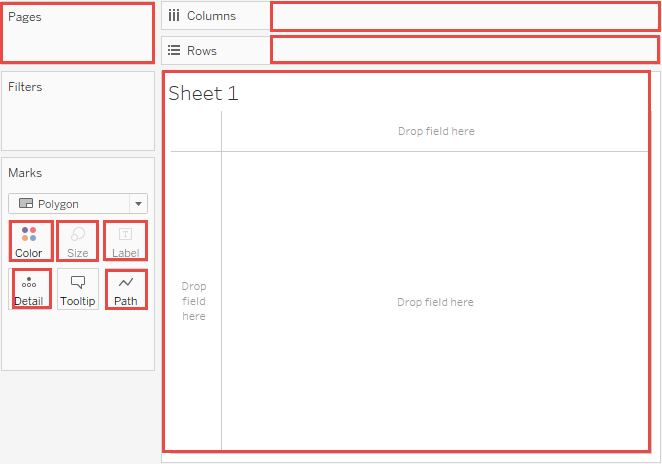
Managing granularity in Tableau worksheet
FIXED LOD Expressions
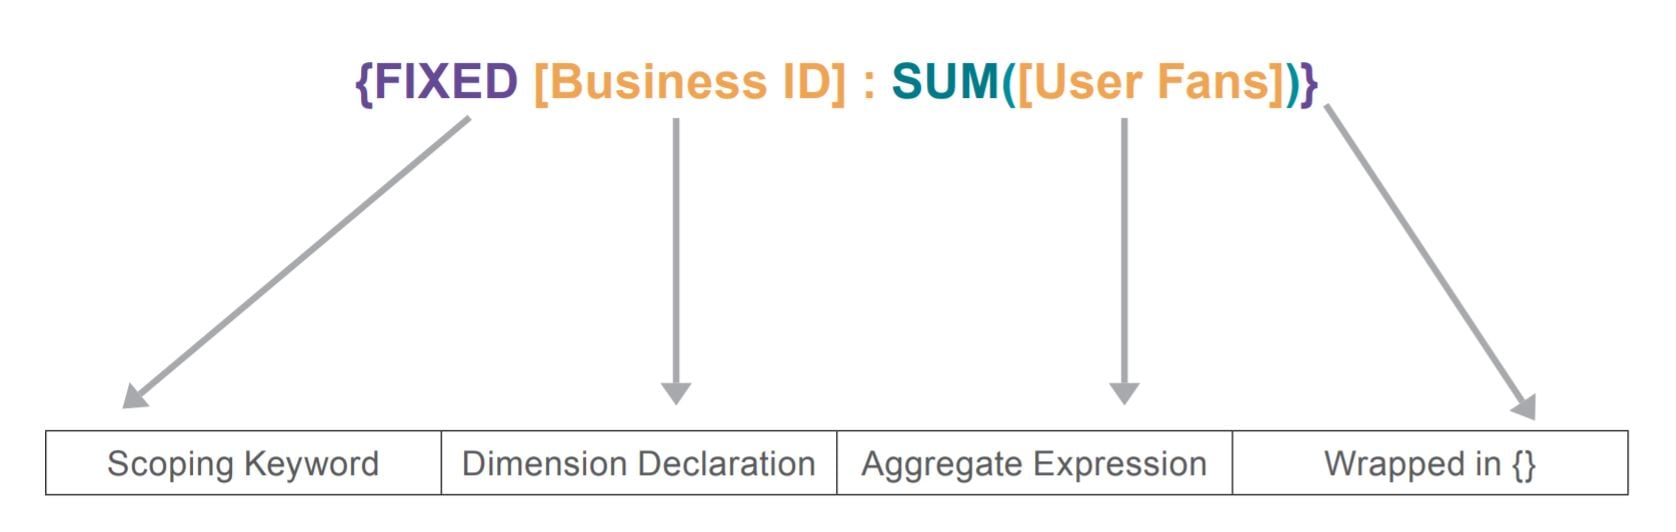
- Works with 0, 1, 2 or more dimensions, in any order
- Result of the LOD calculation can be either a dimension or a measure
- Dimensions of interest are contained in the calculation and do not clutter the view
Cohort and survival analysis
Cohort analysis:
- Analyzing repetitive behavior of a group
- e.g. Usage of a product by various client groups (cohorts)
Survival analysis:
- Analyzing how many subject remain in dataset on a given day
- e.g. Who still keeps the New Year resolutions in February?
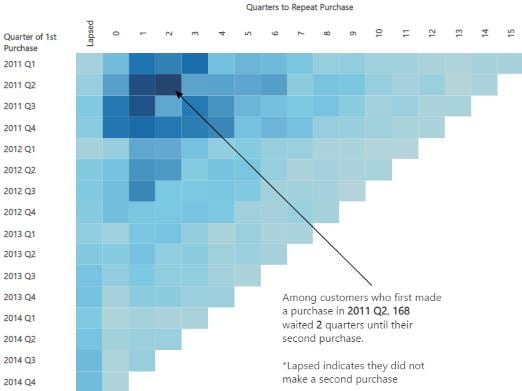
Cohort and Survival analysis - FIXED
Cohort analysis:
- Analyzing repetitive behavior of a group.
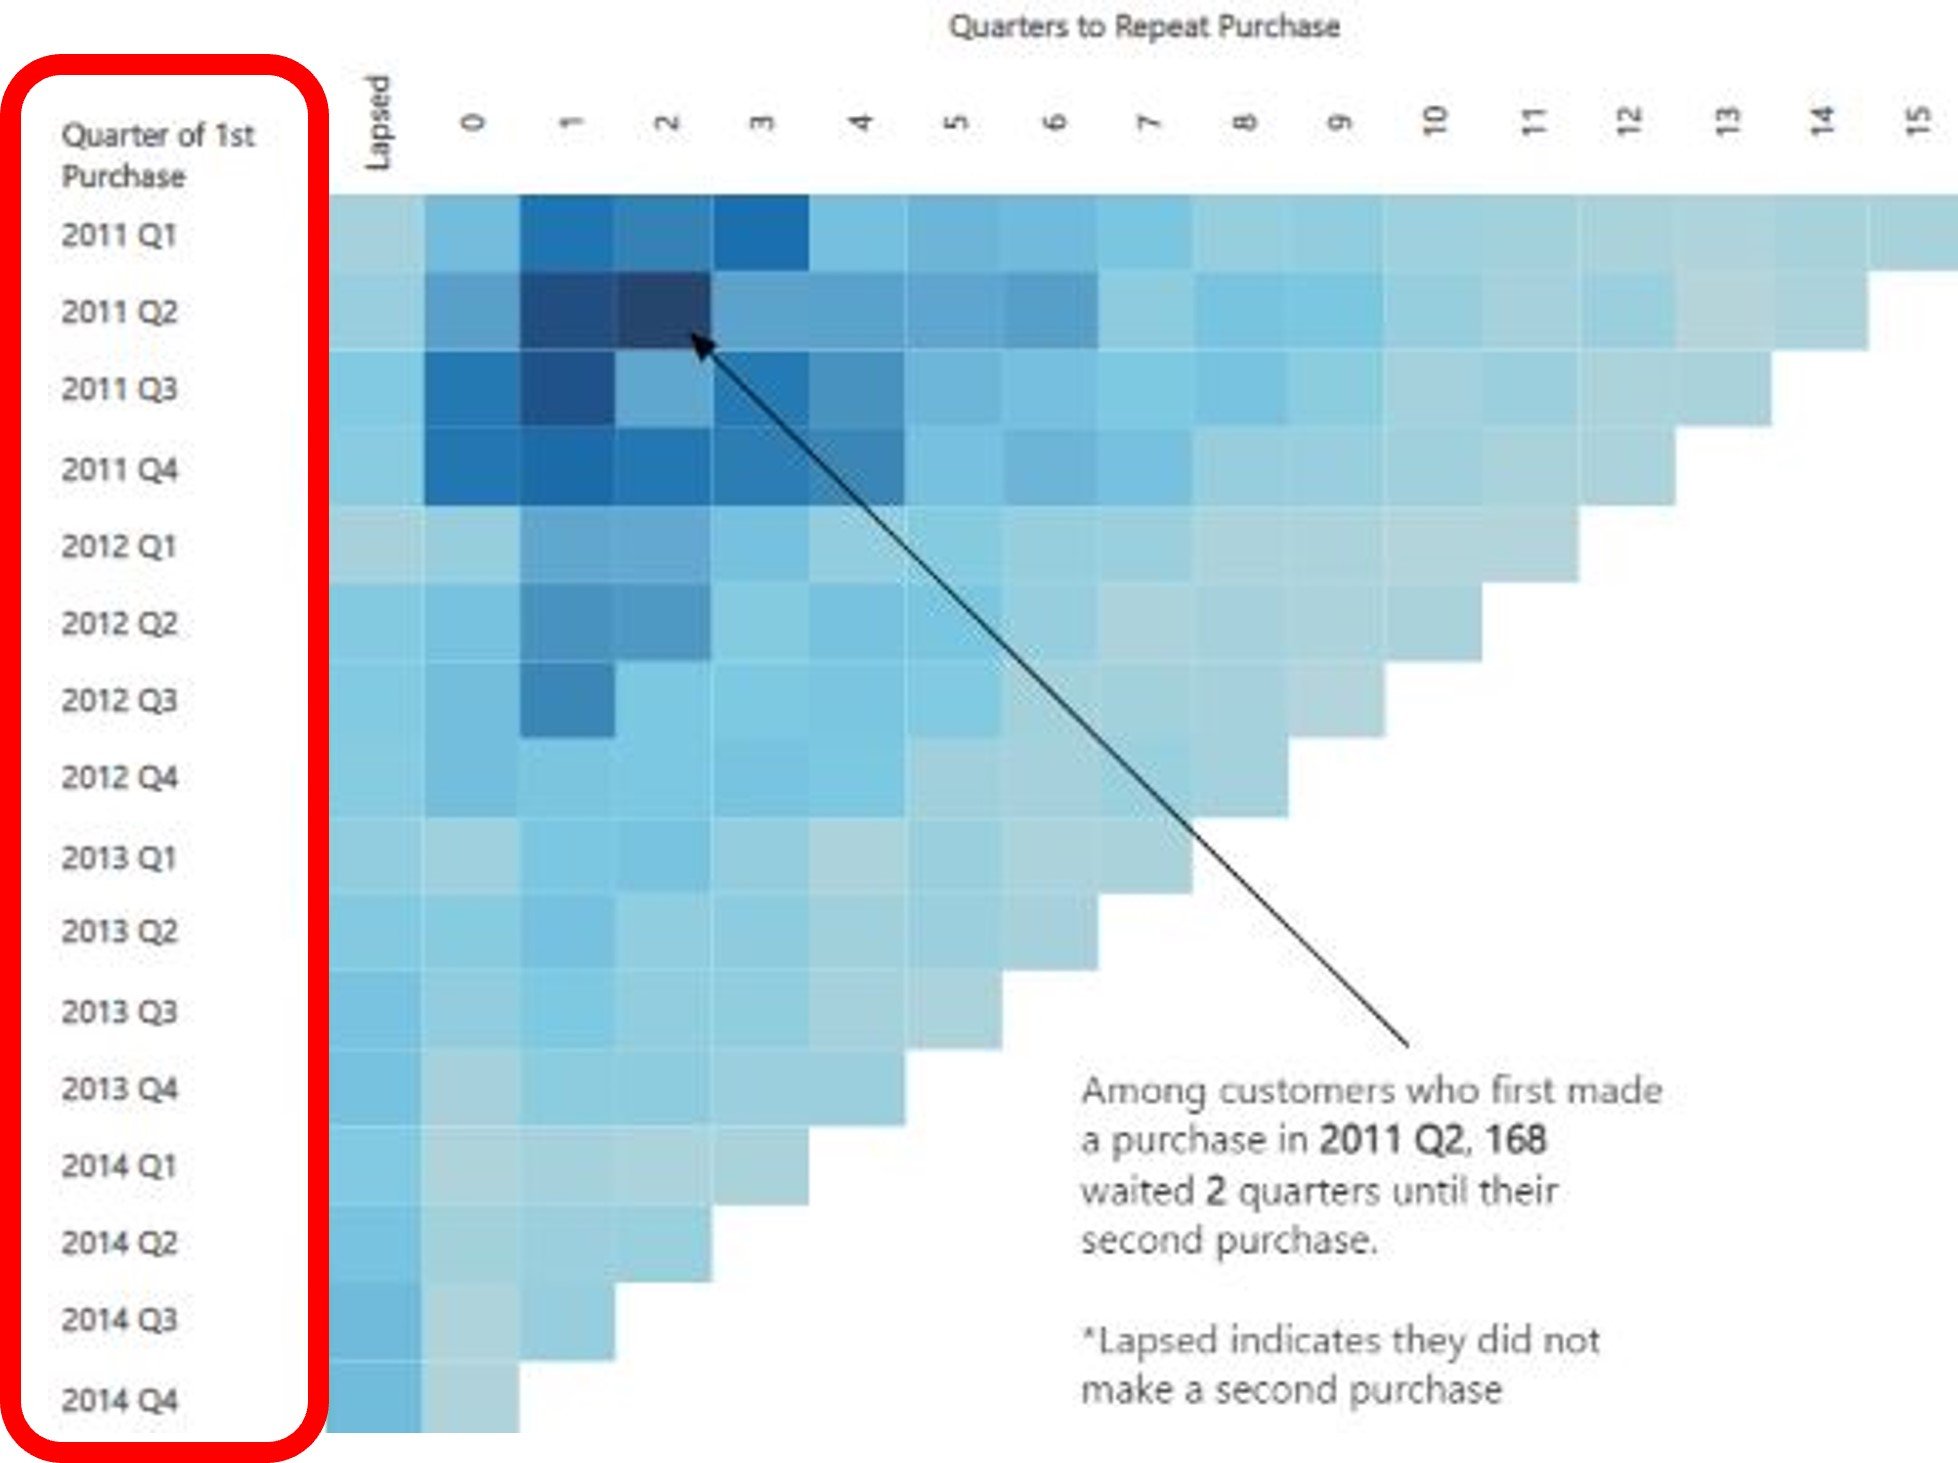
- e.g. Usage of a product by various client groups
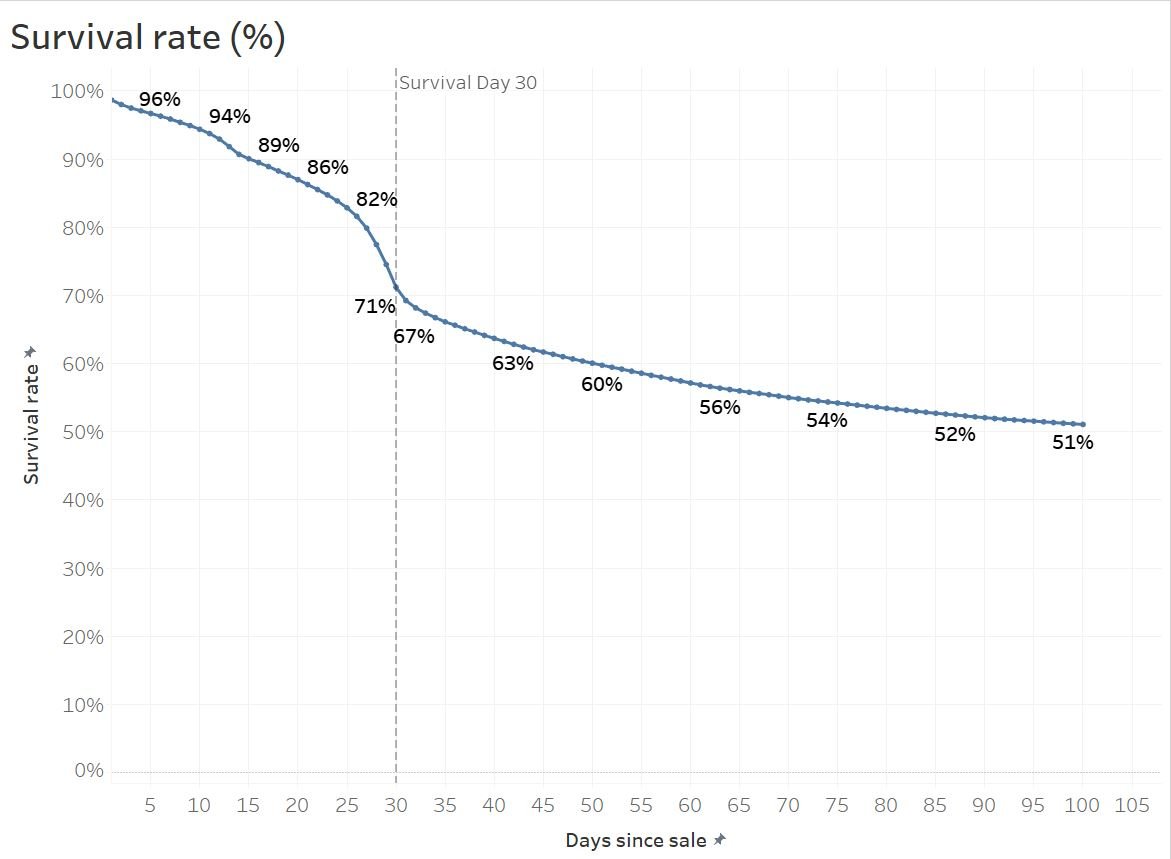
Survival analysis:
- Analyzing how many subject remain in dataset on a given day.
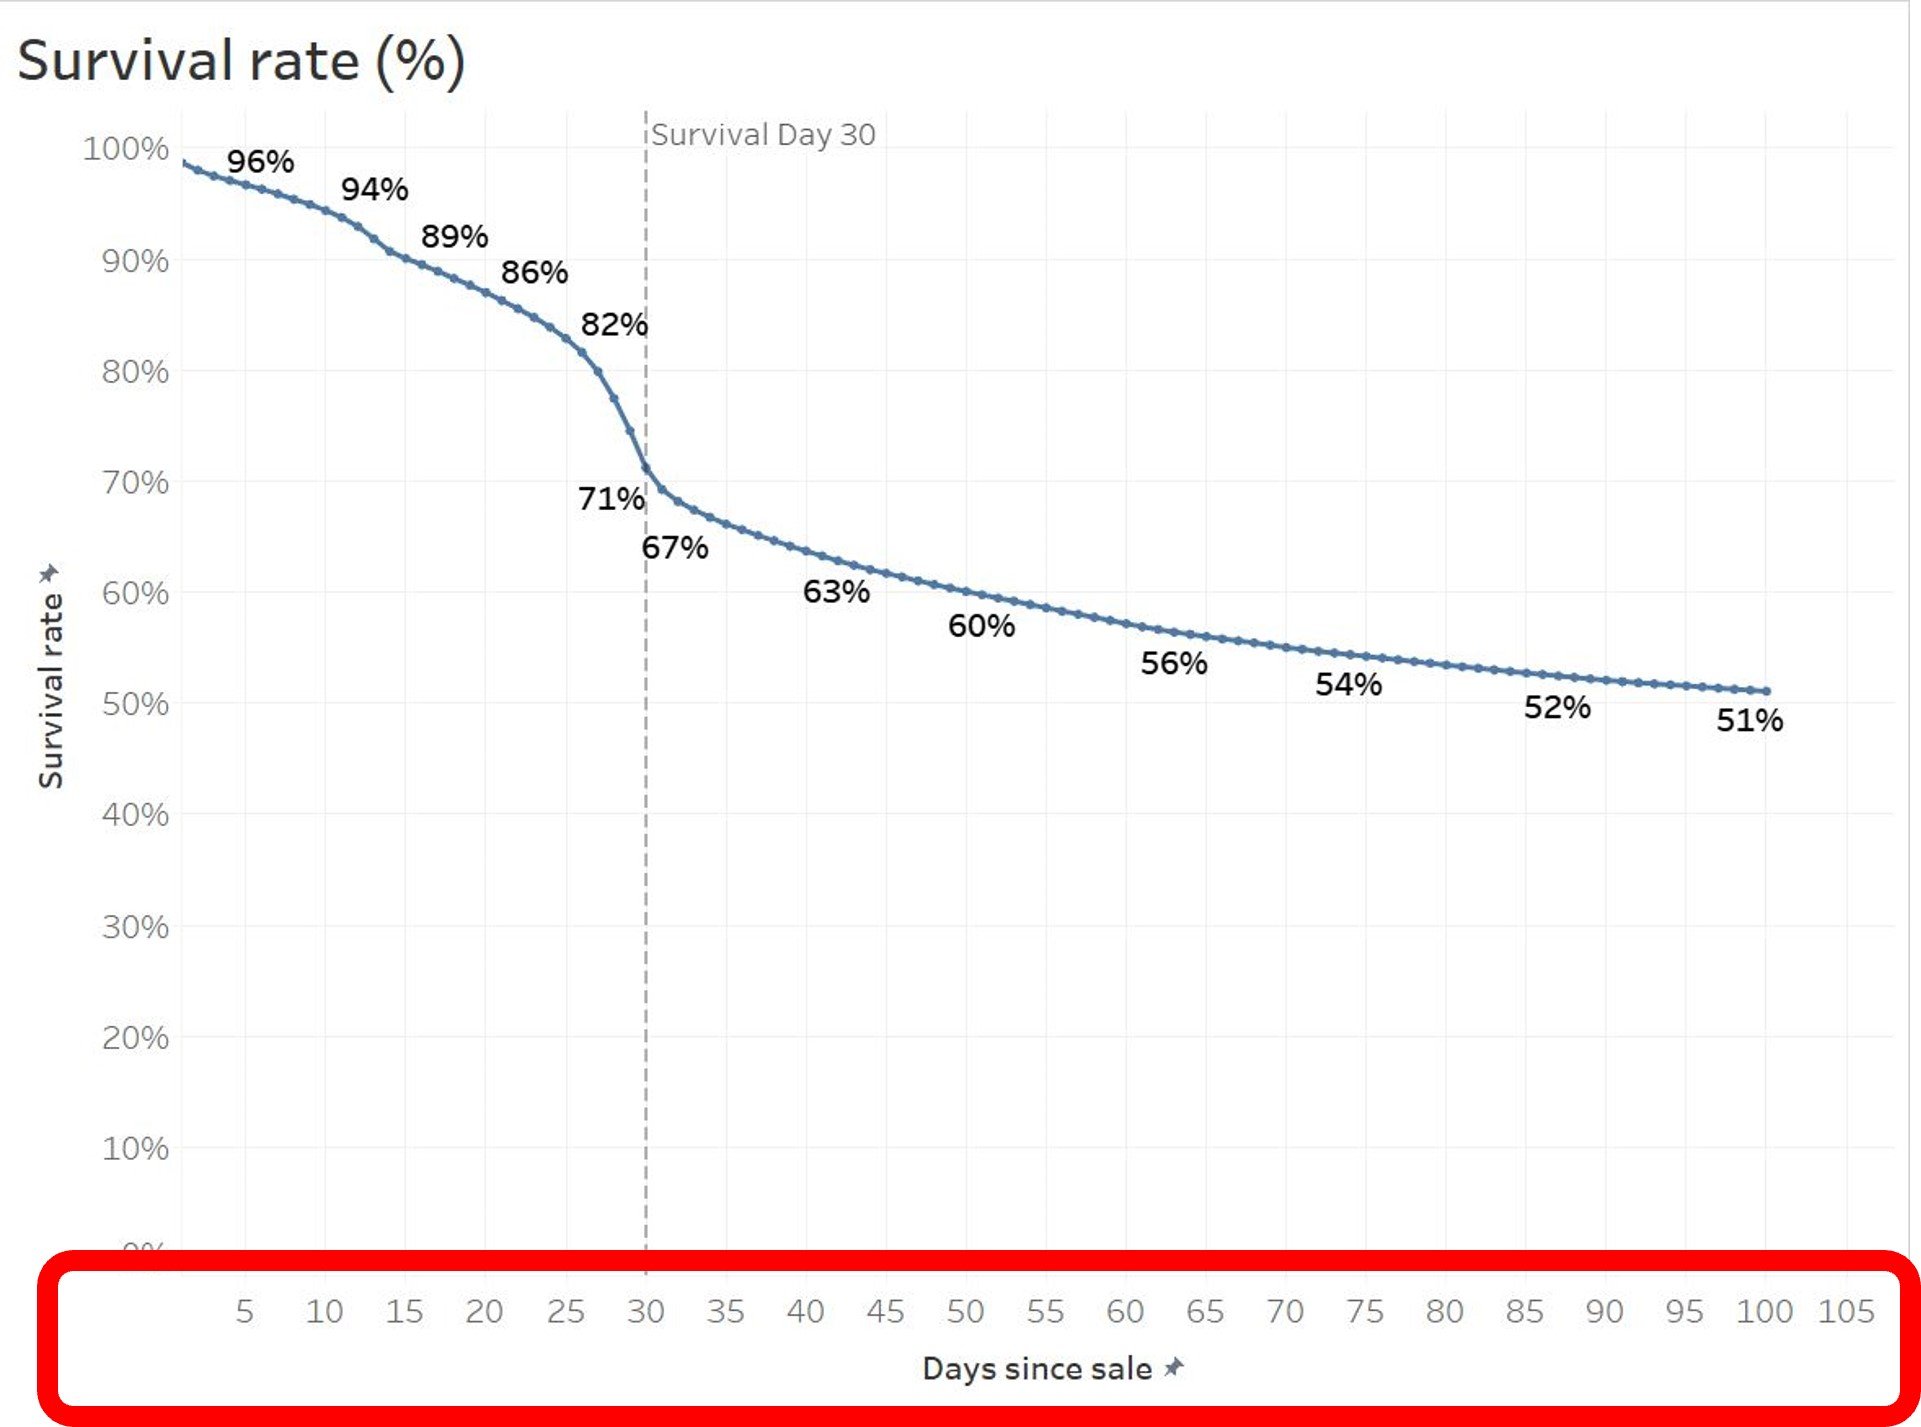
- e.g. Who still keeps the New Year resolutions in February?

