Measures of center
Introduction to Statistics

George Boorman
Curriculum Manager, DataCamp
Why are measures of center useful?


1 Image credits: https://unsplash.com/@arnosenoner; https://unsplash.com/@brenoassis;
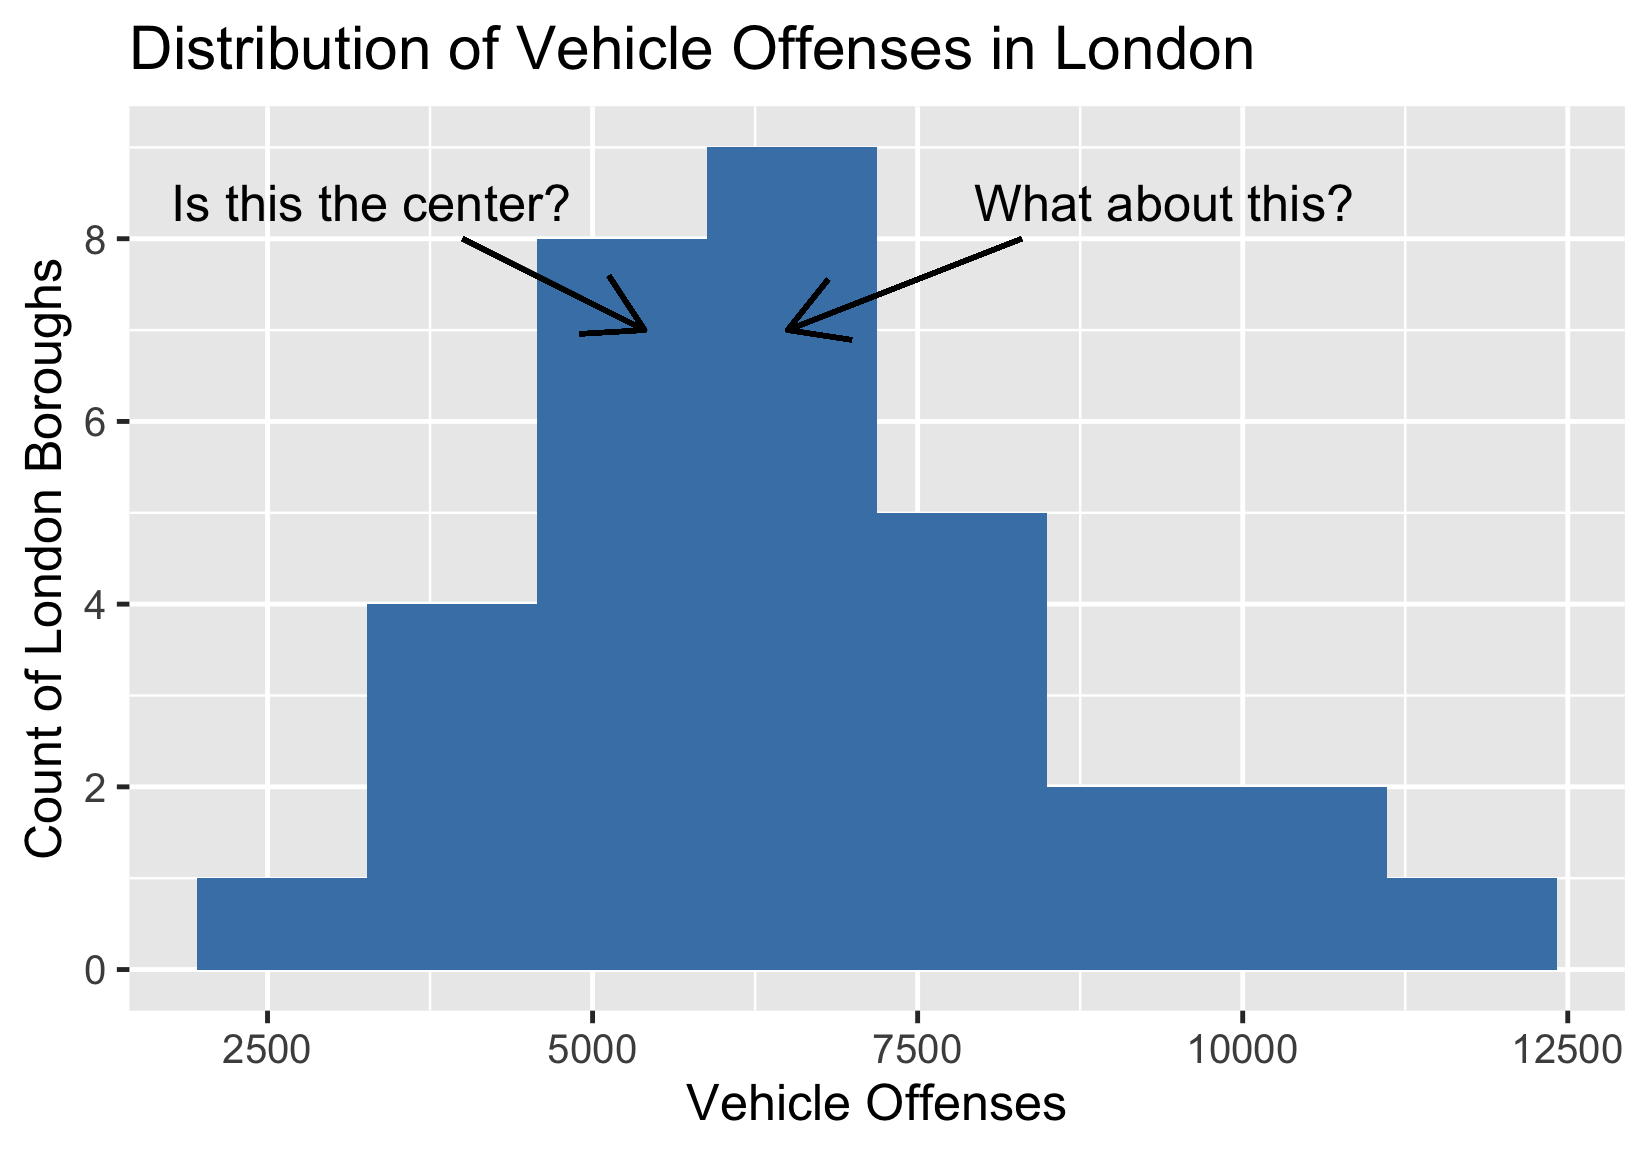
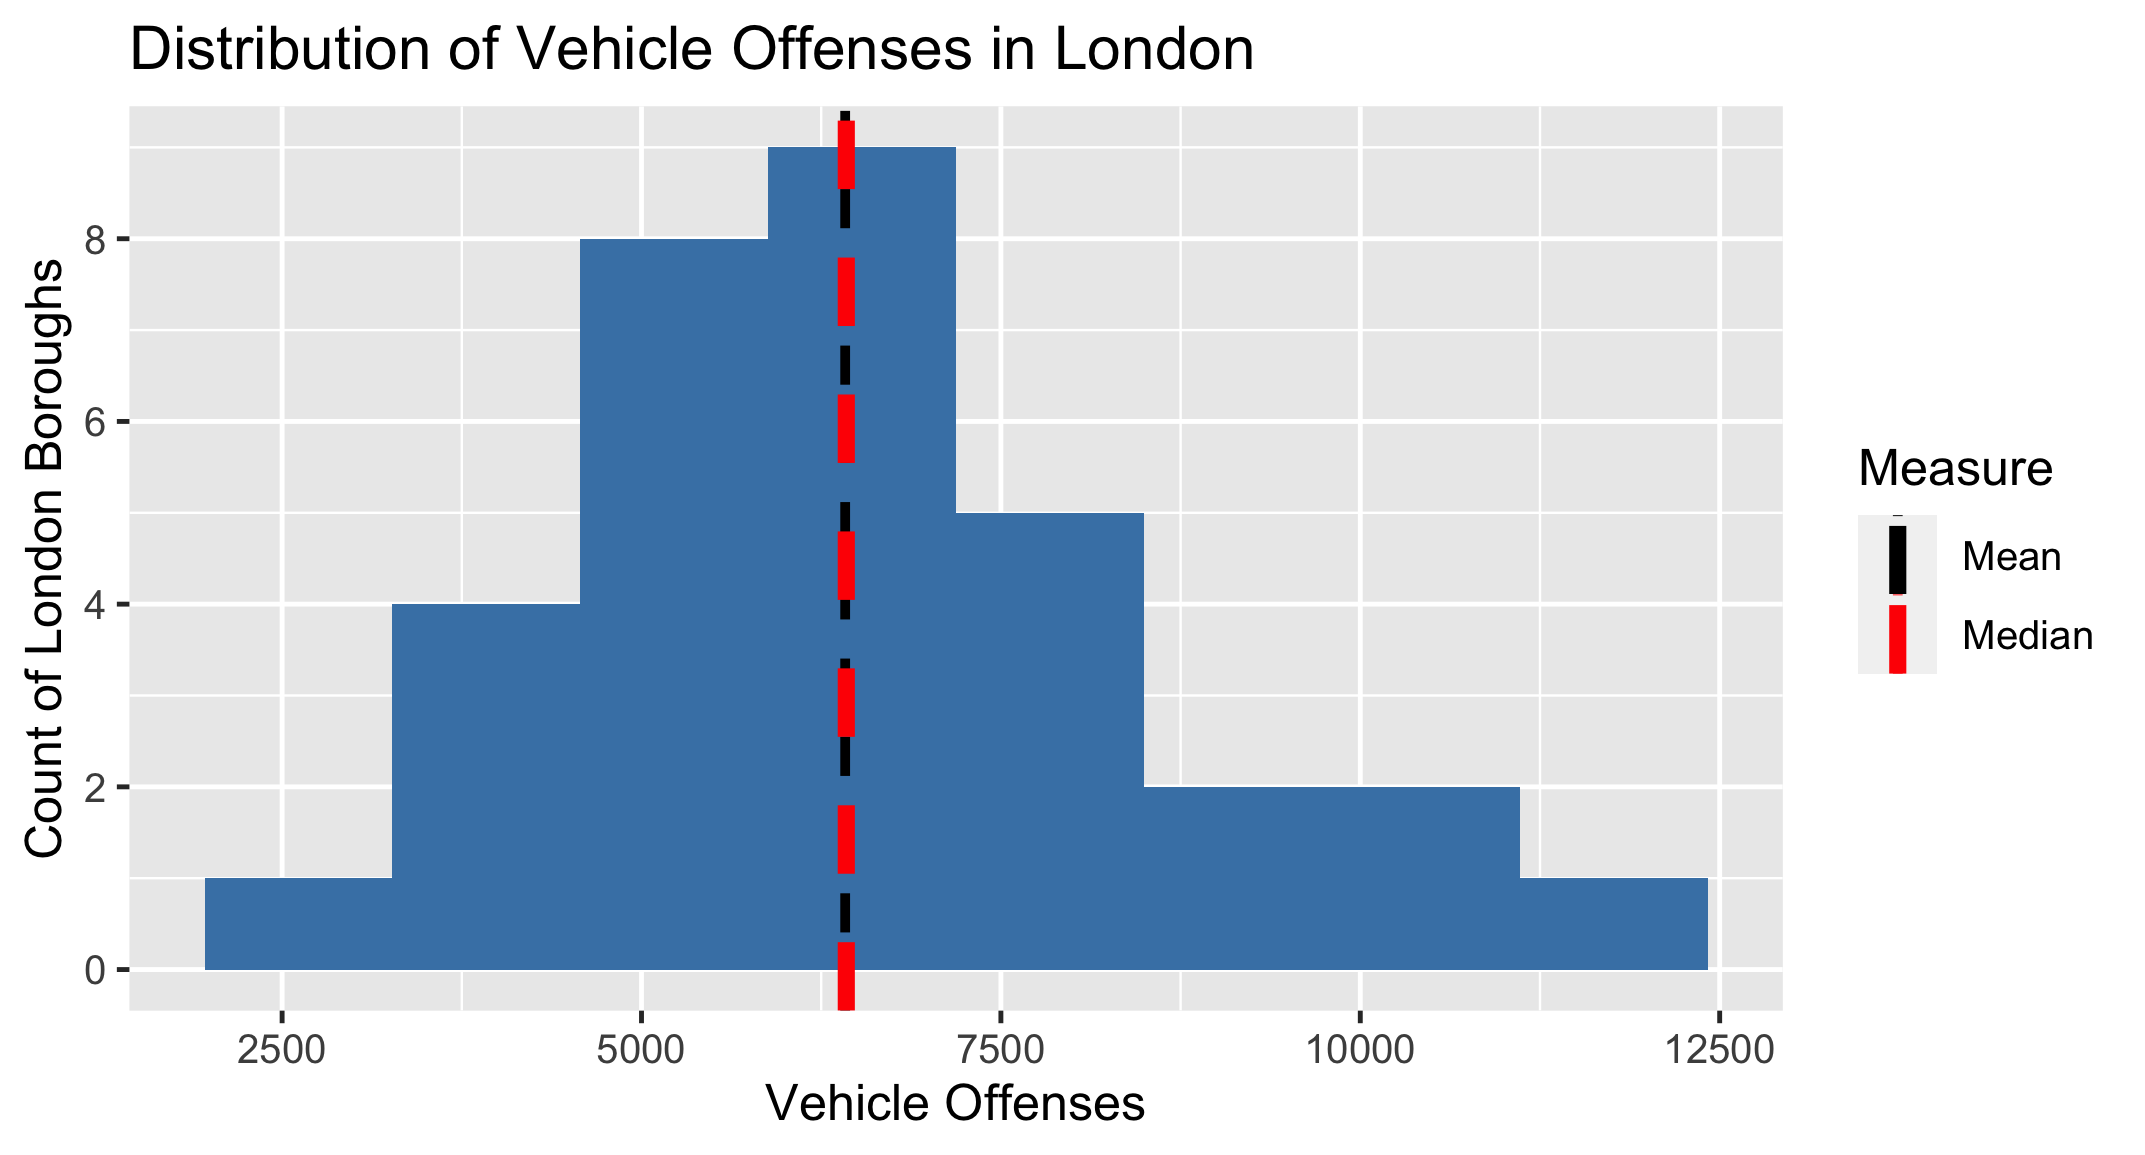
Histograms
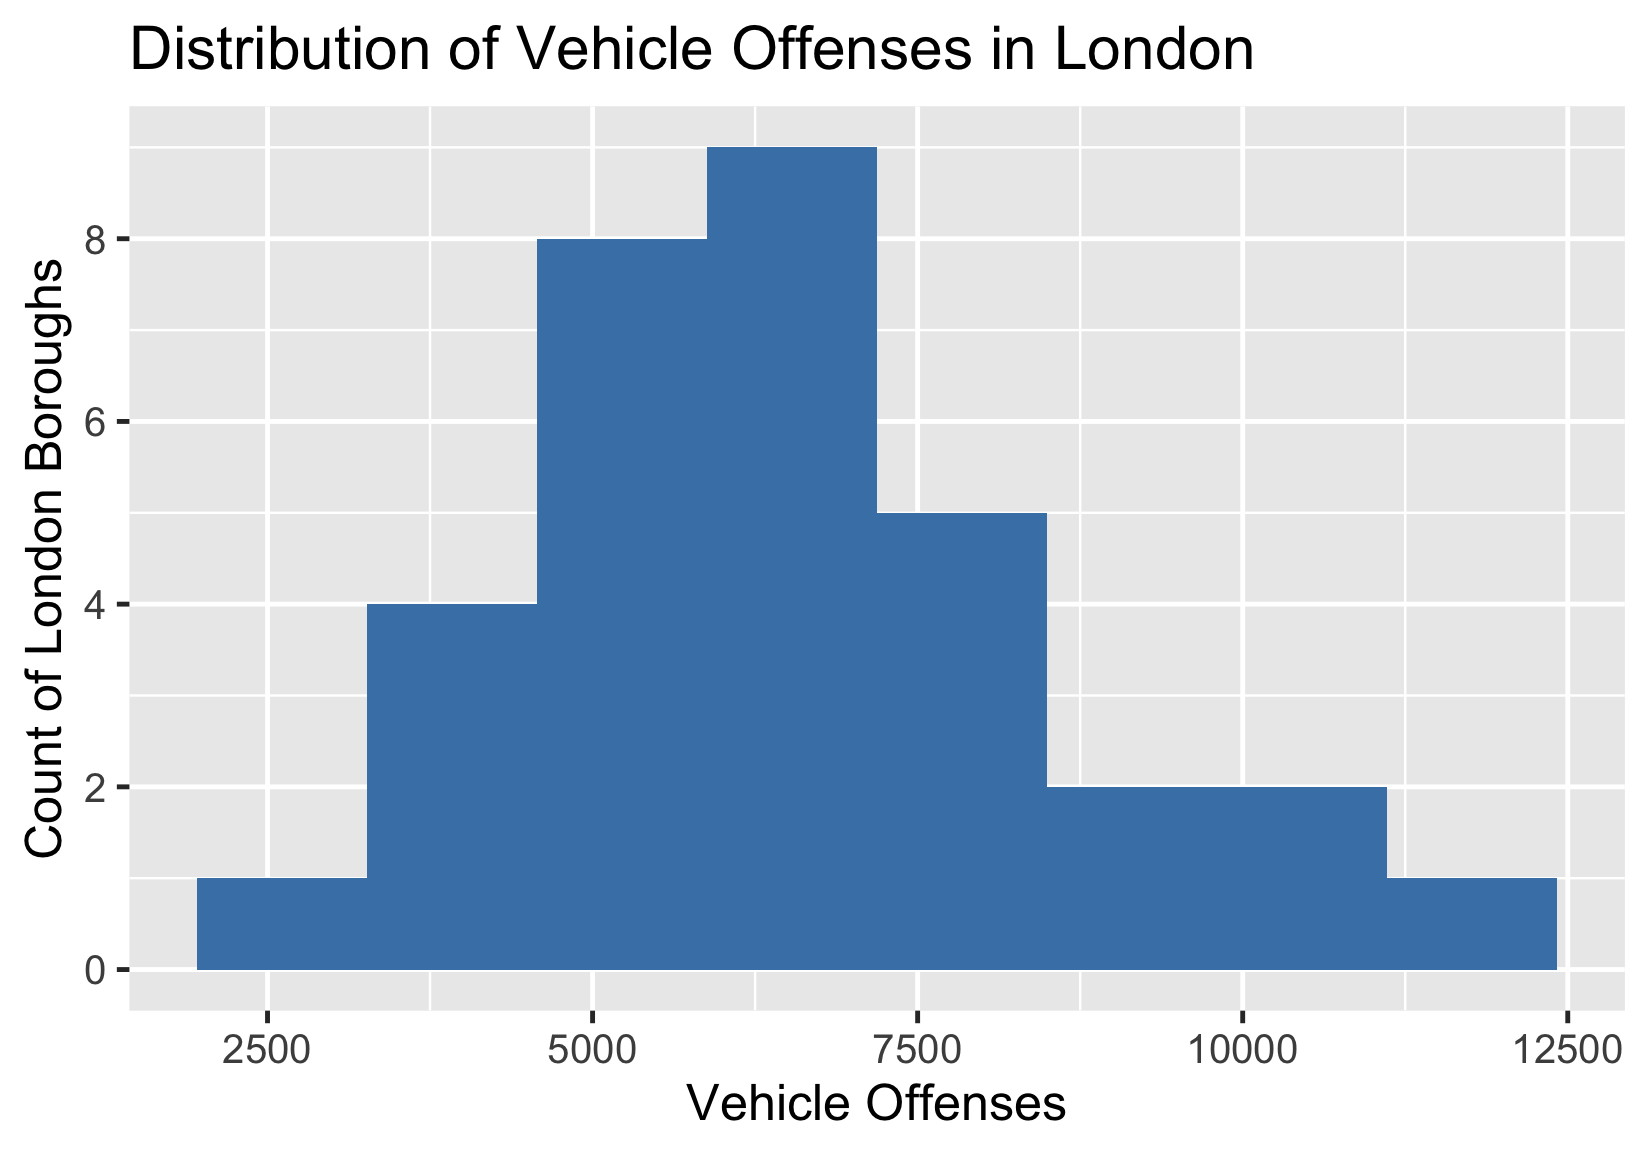
What is the typical amount of vehicle crime in London?
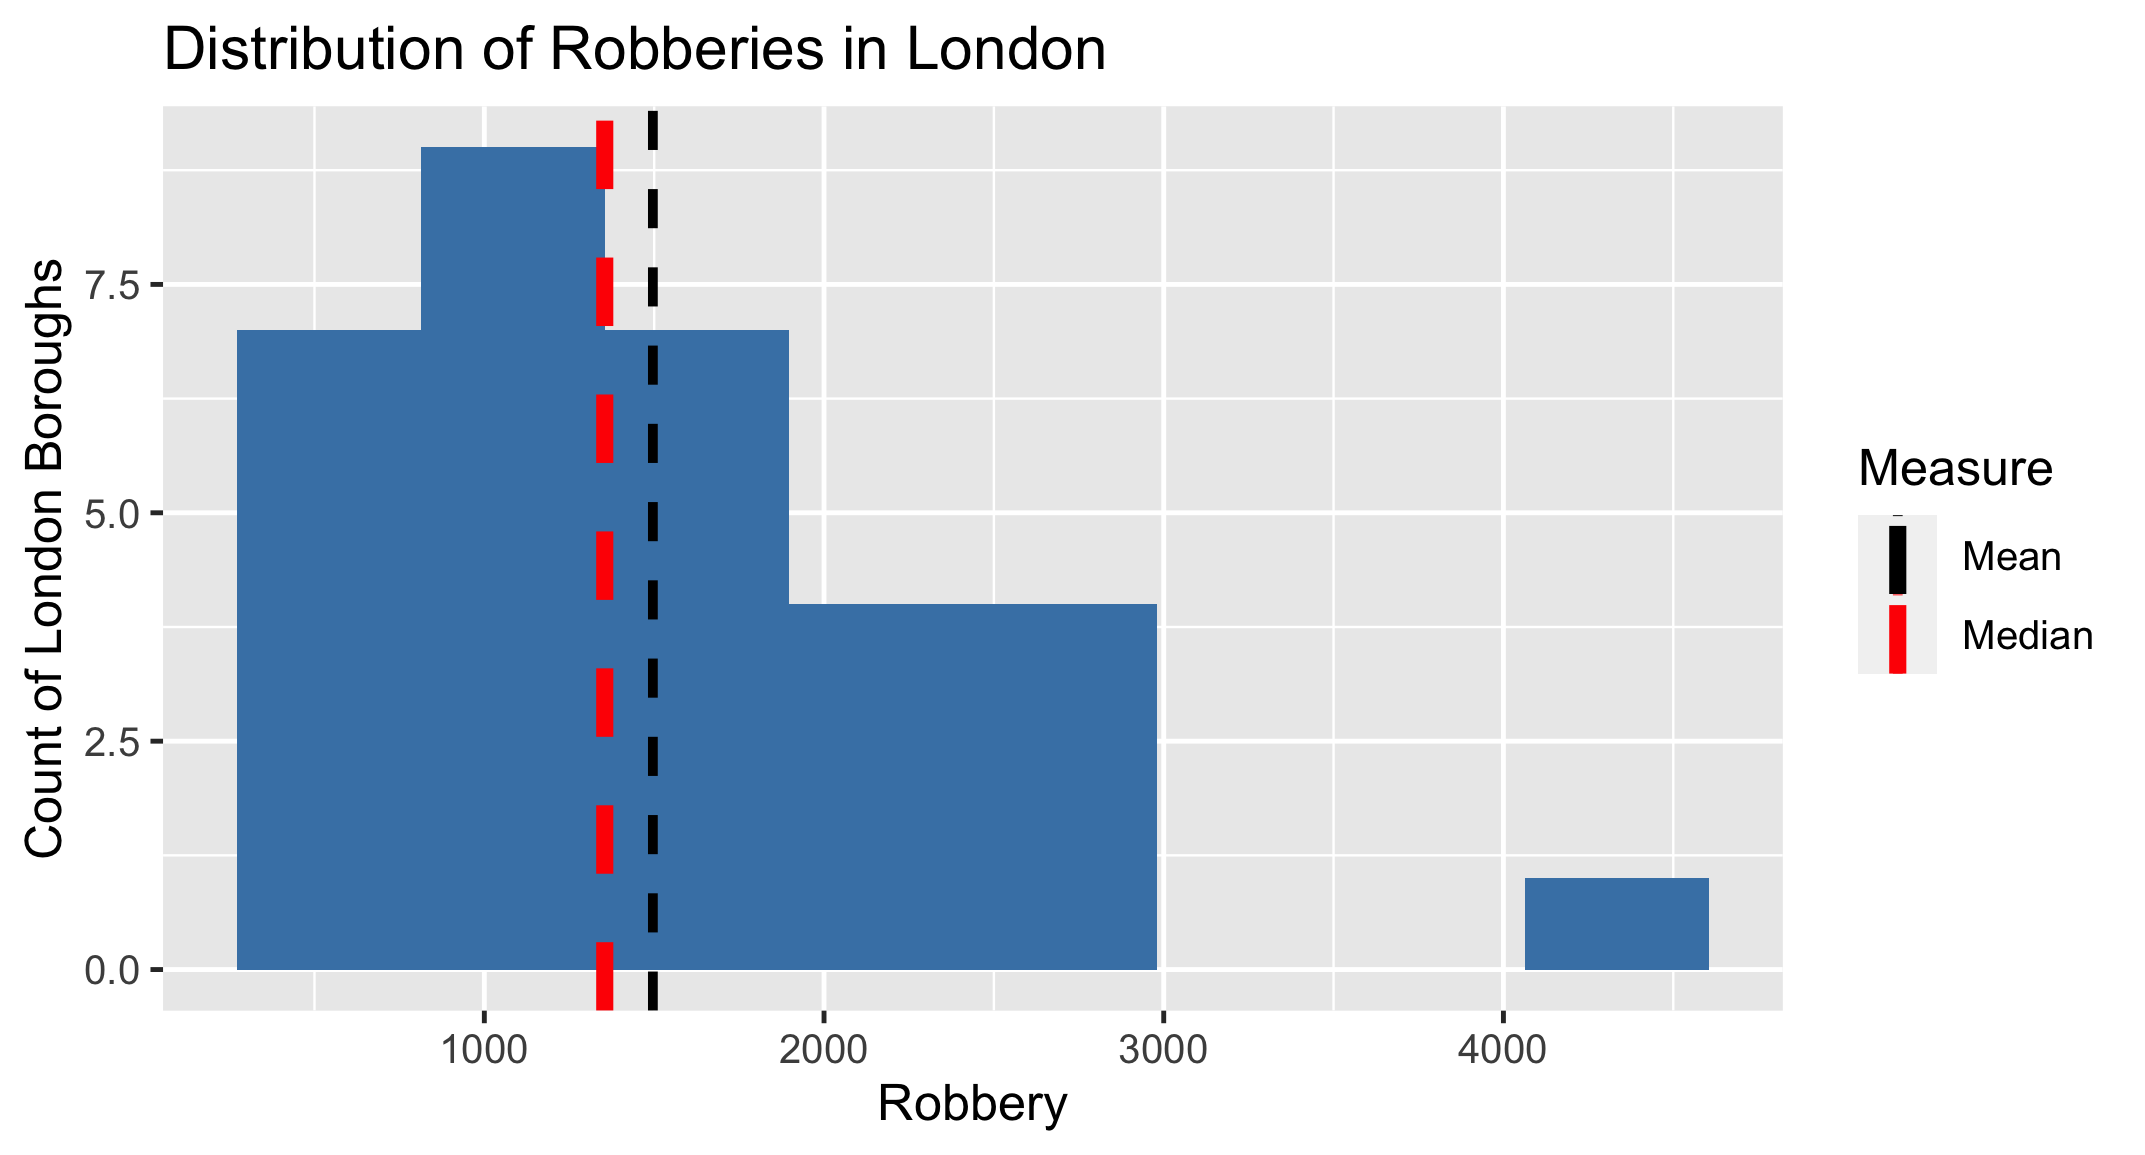
Measures of center: median
- Median - middle value for a given variable
Measures of center: median
Which measure to use?
Which measure to use?