The central limit theorem
Introduction to Statistics

George Boorman
Curriculum Manager, DataCamp
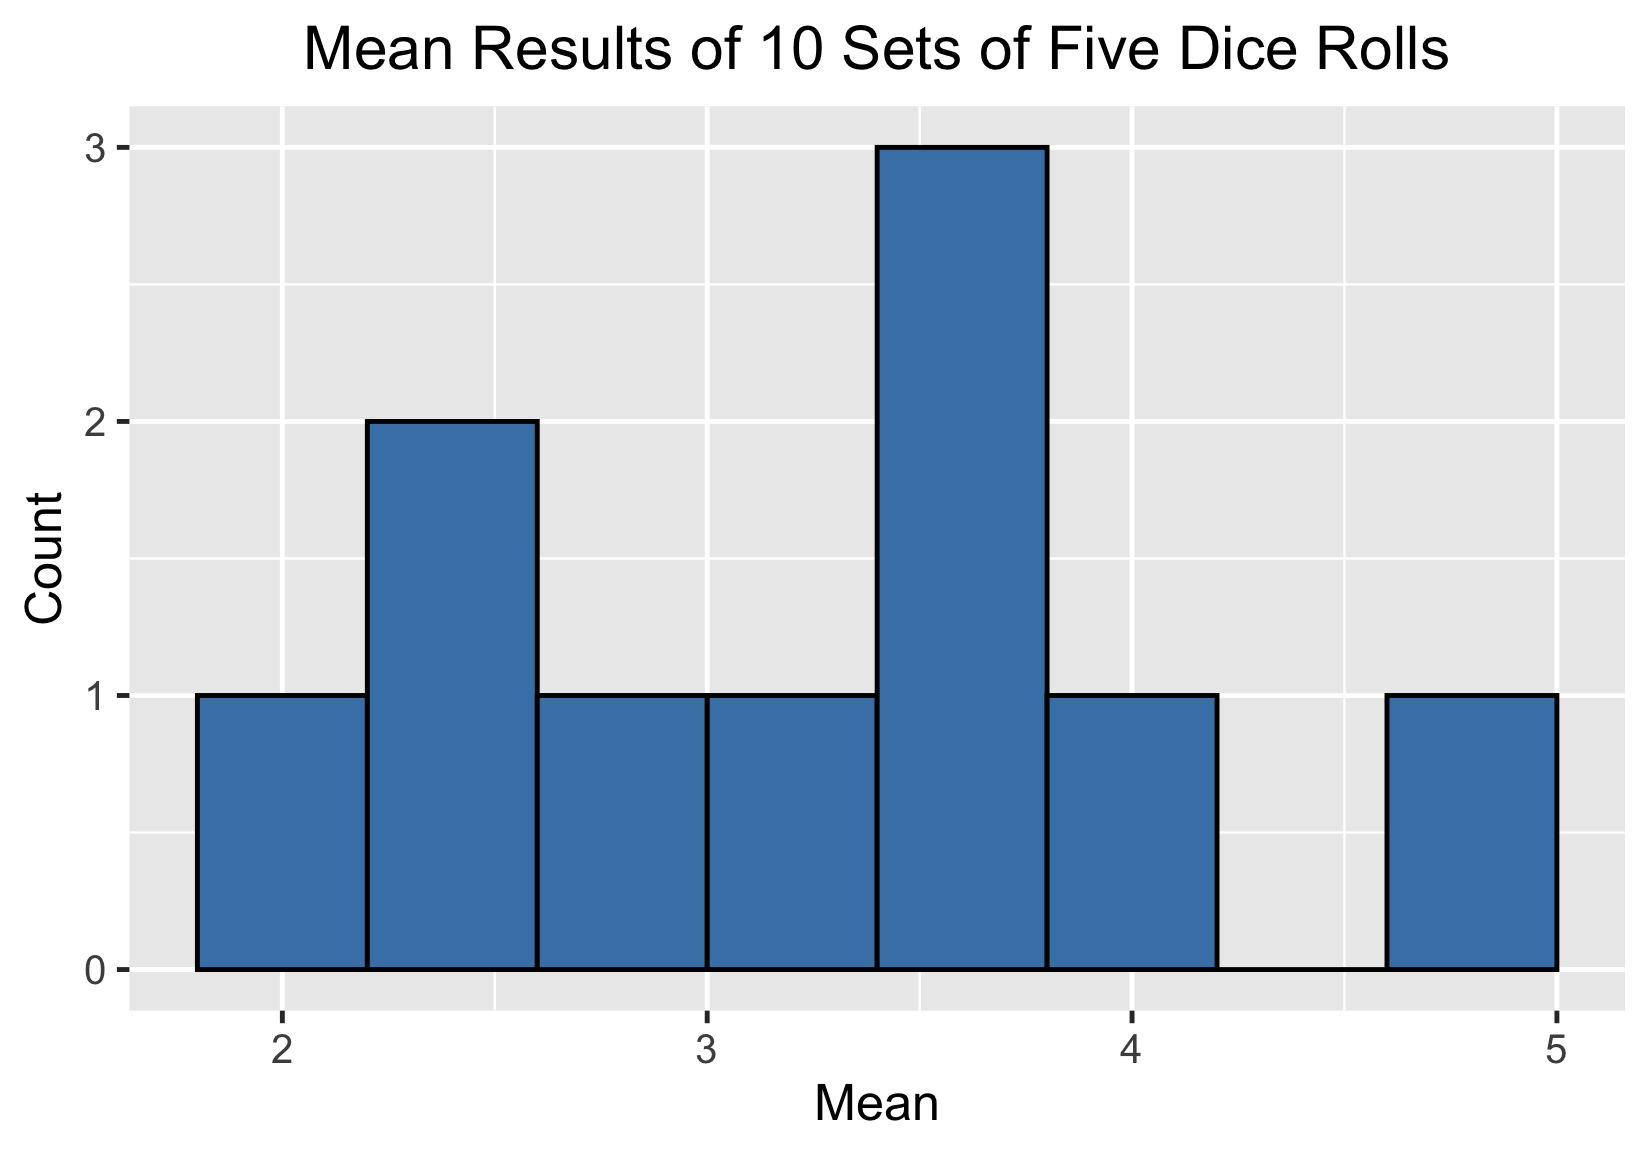
Rolling a die five times

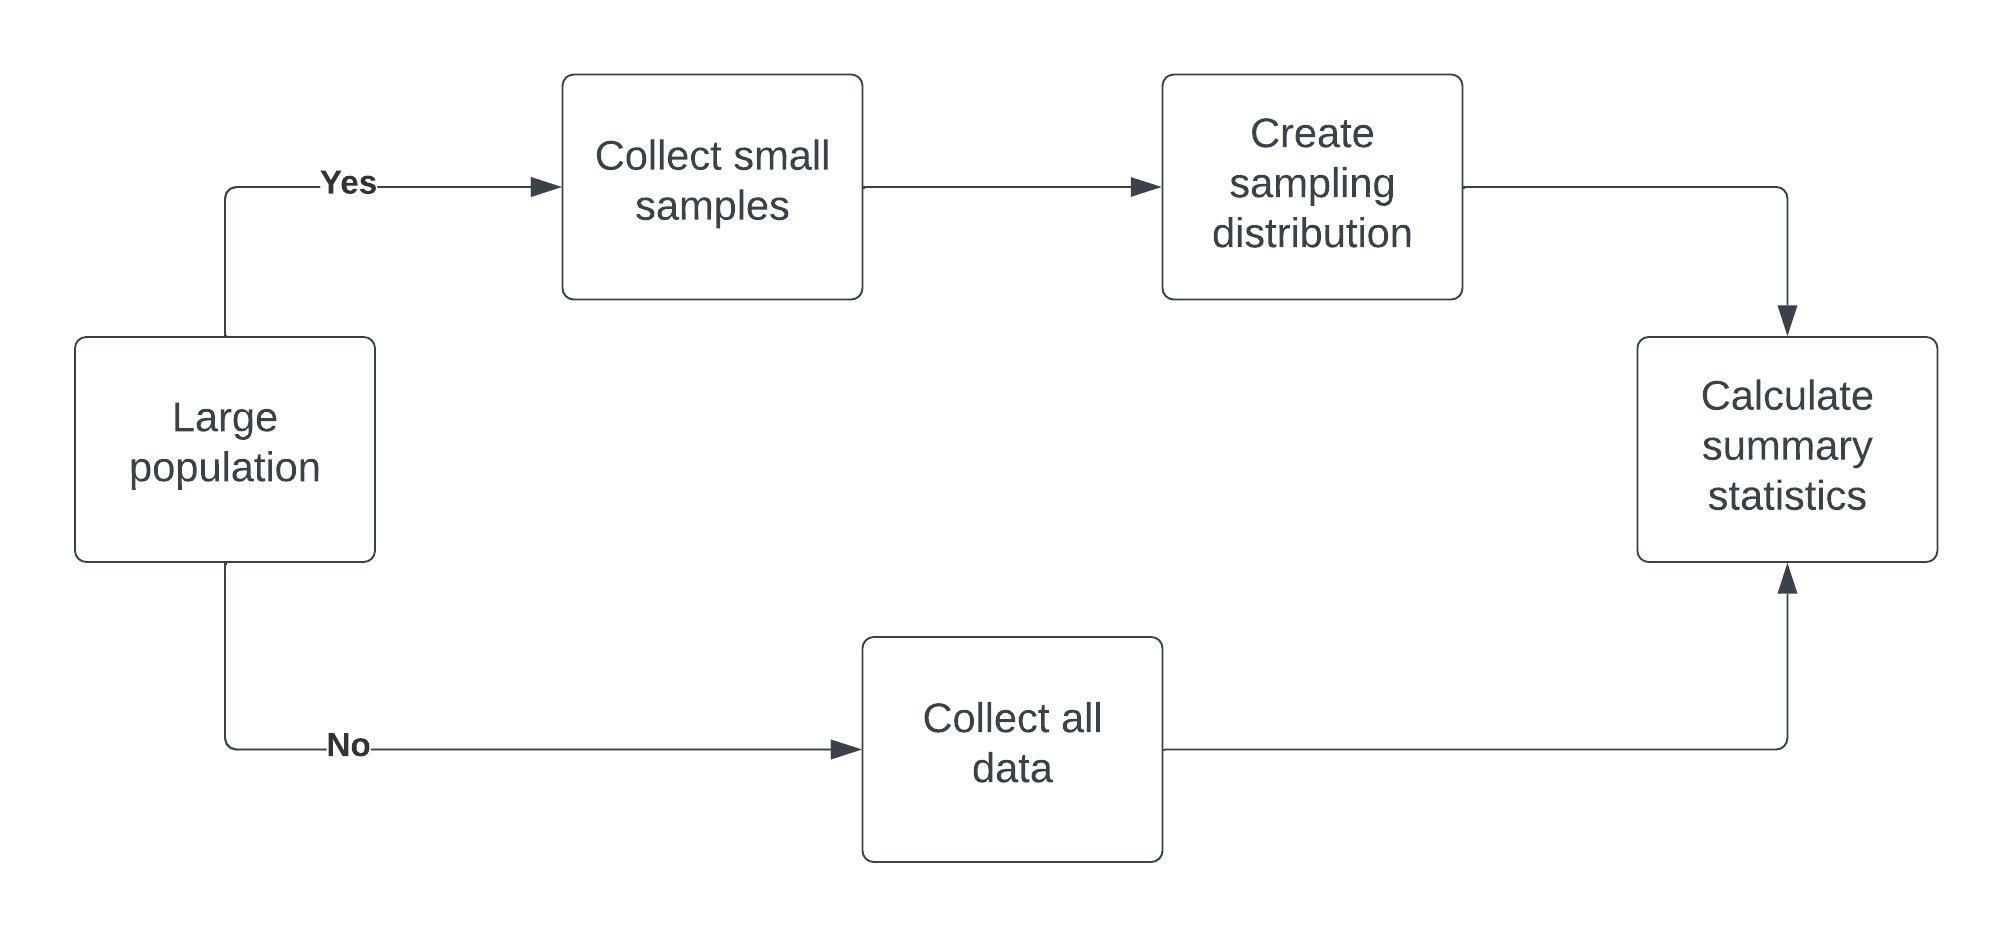
Sampling distributions
Sampling distribution of the sample mean
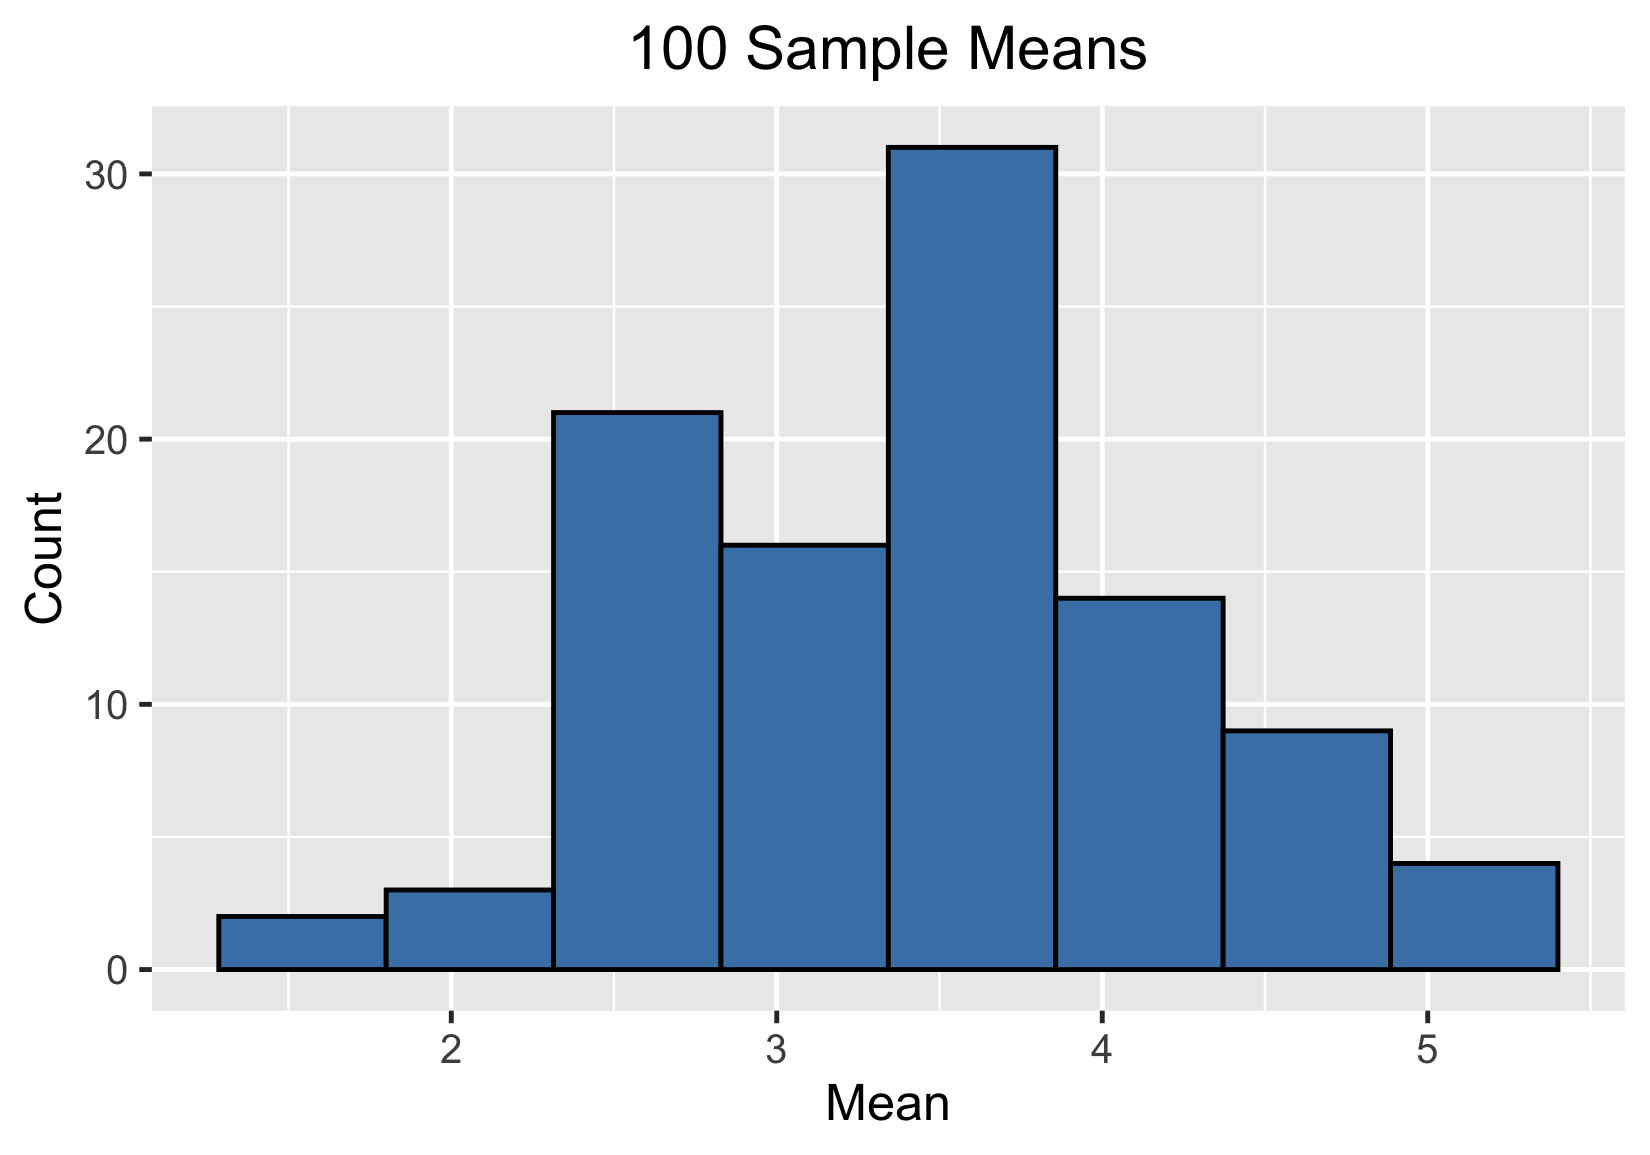
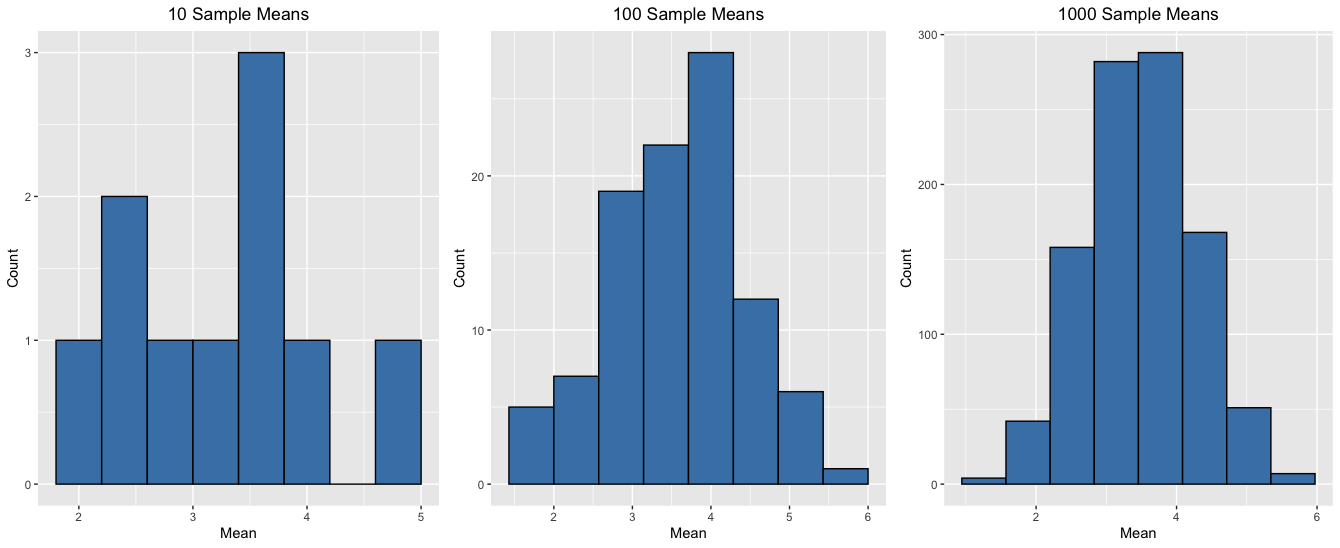
100 sample means
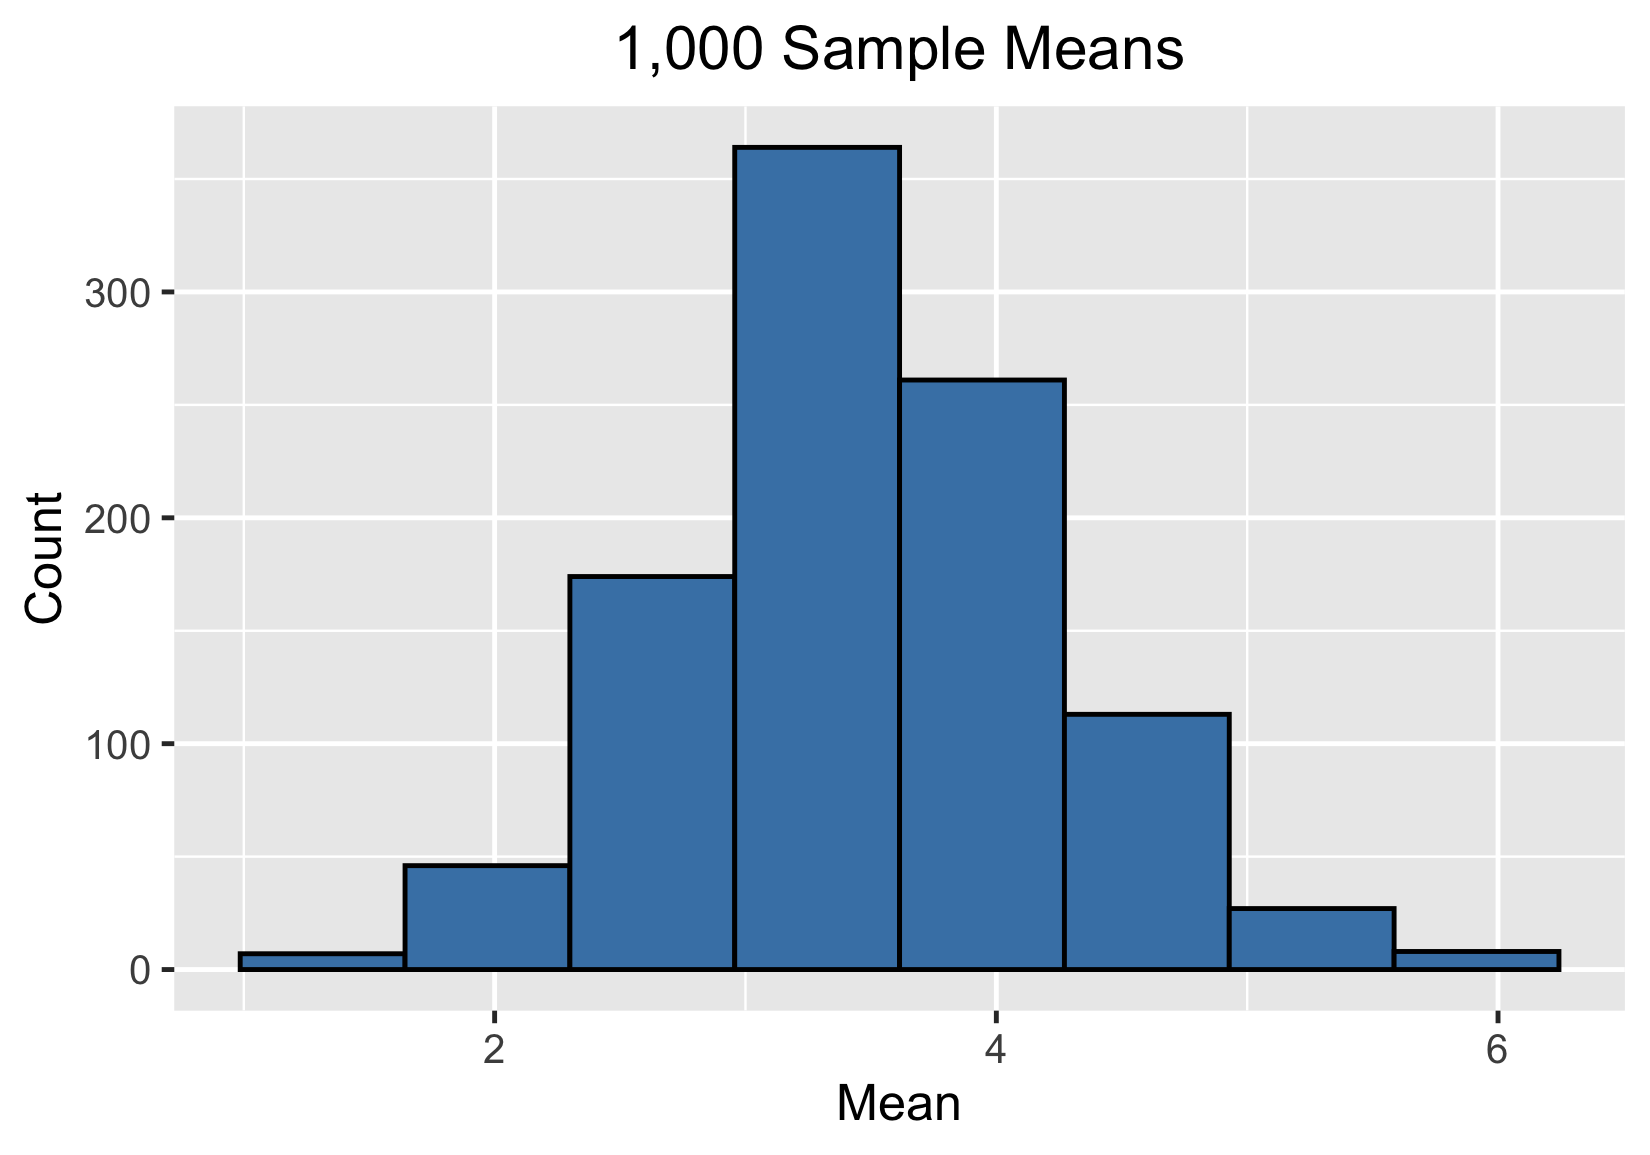
1000 sample means
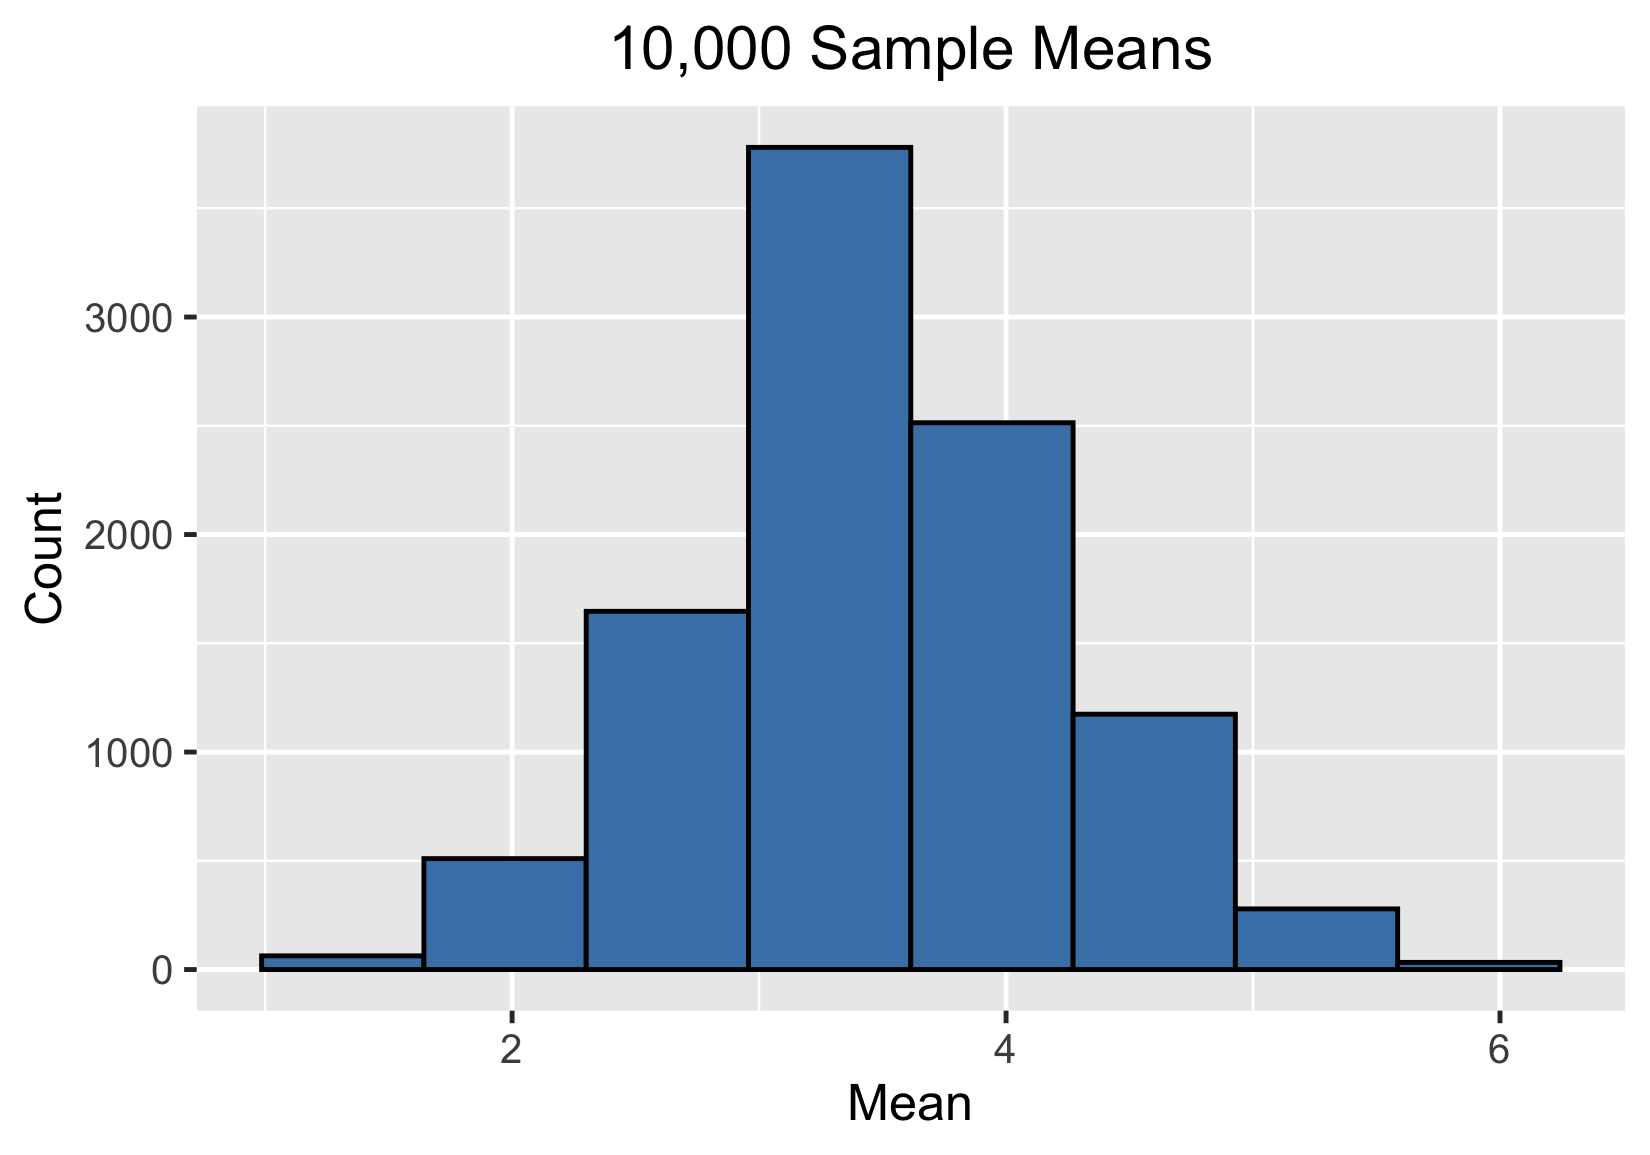
10000 sample means
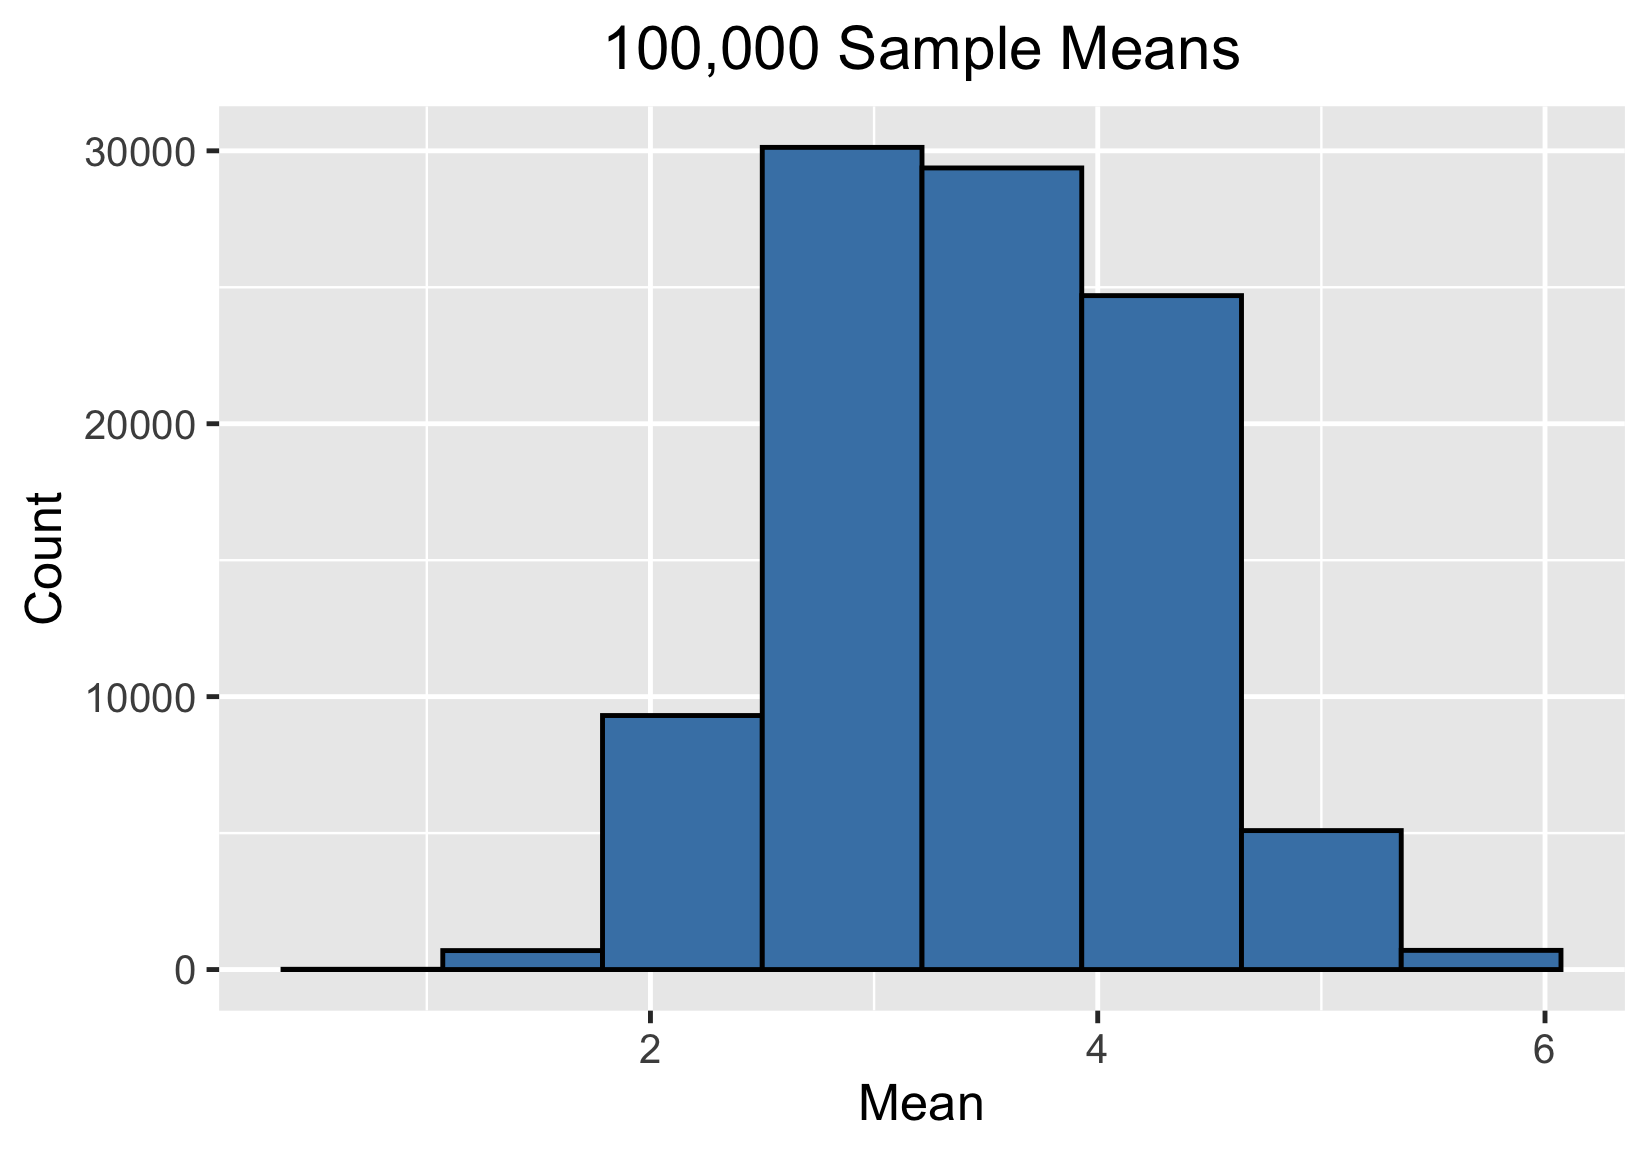
100000 sample means
One million sample means
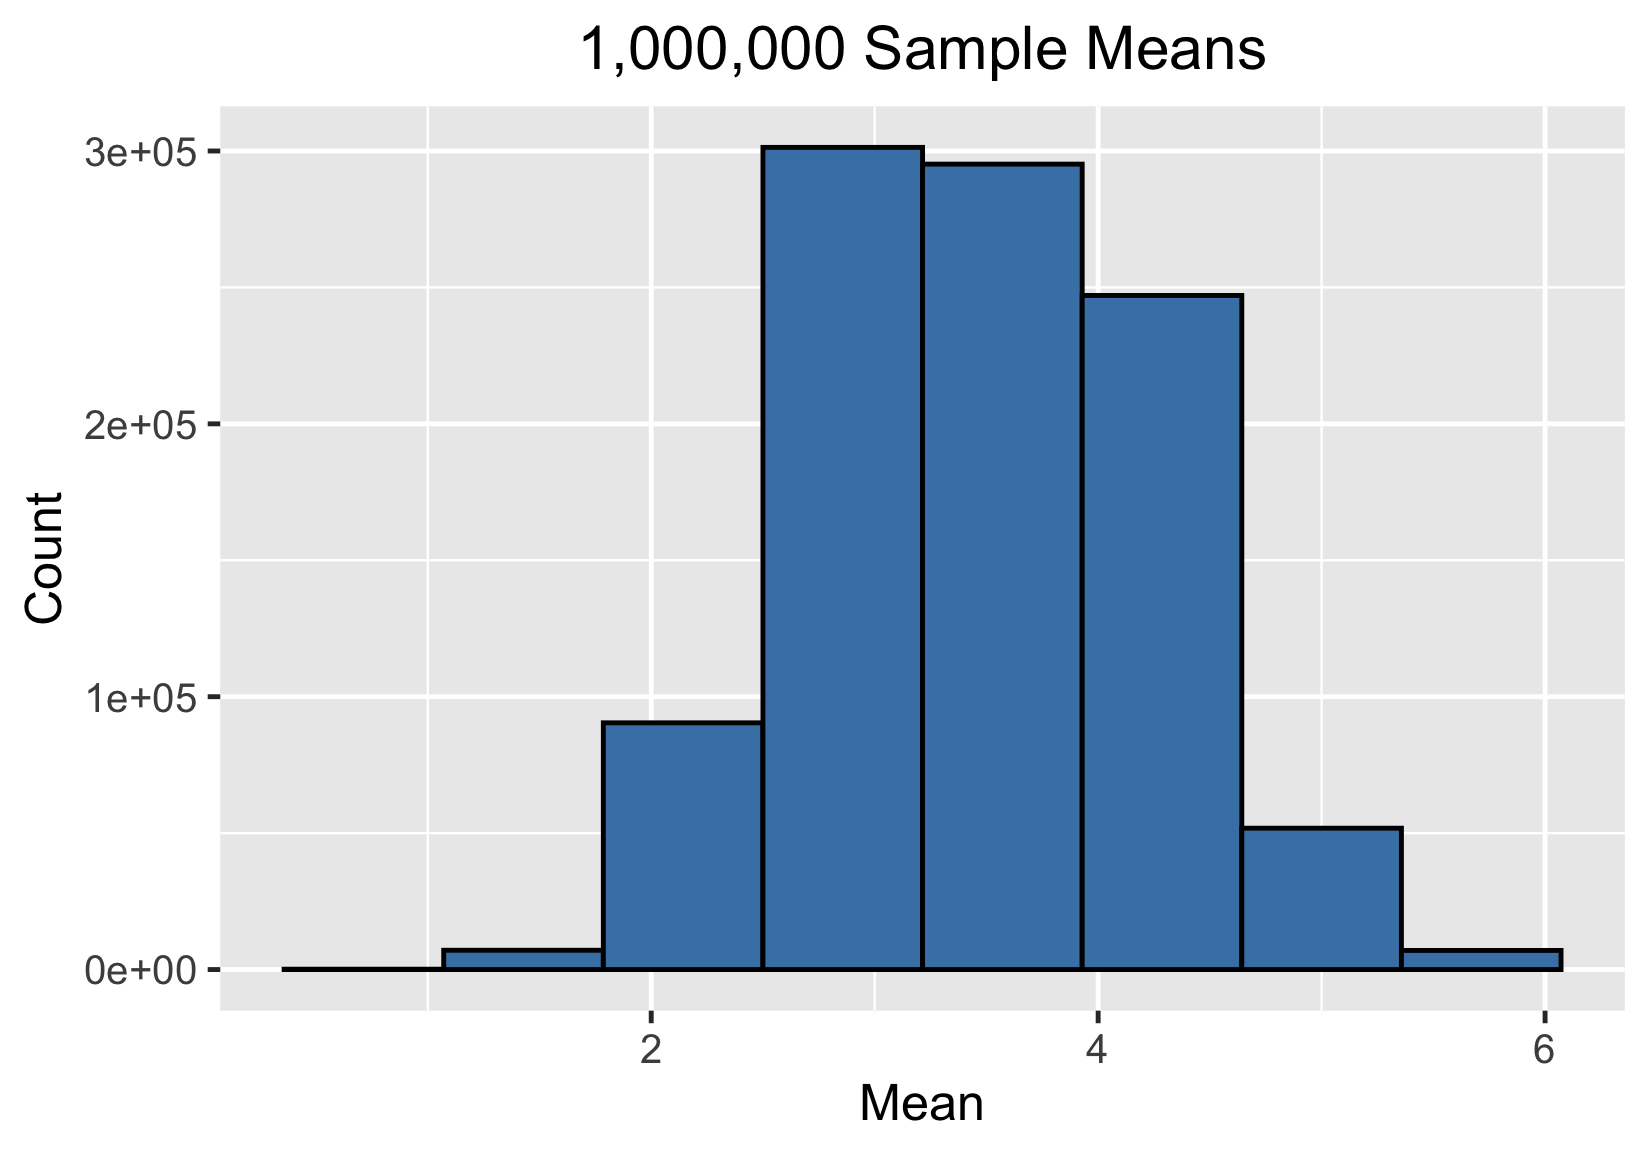
Central limit theorem
The sampling distribution of a statistic becomes closer to the normal distribution as the size of the sample increases.
* Samples should be random and independent
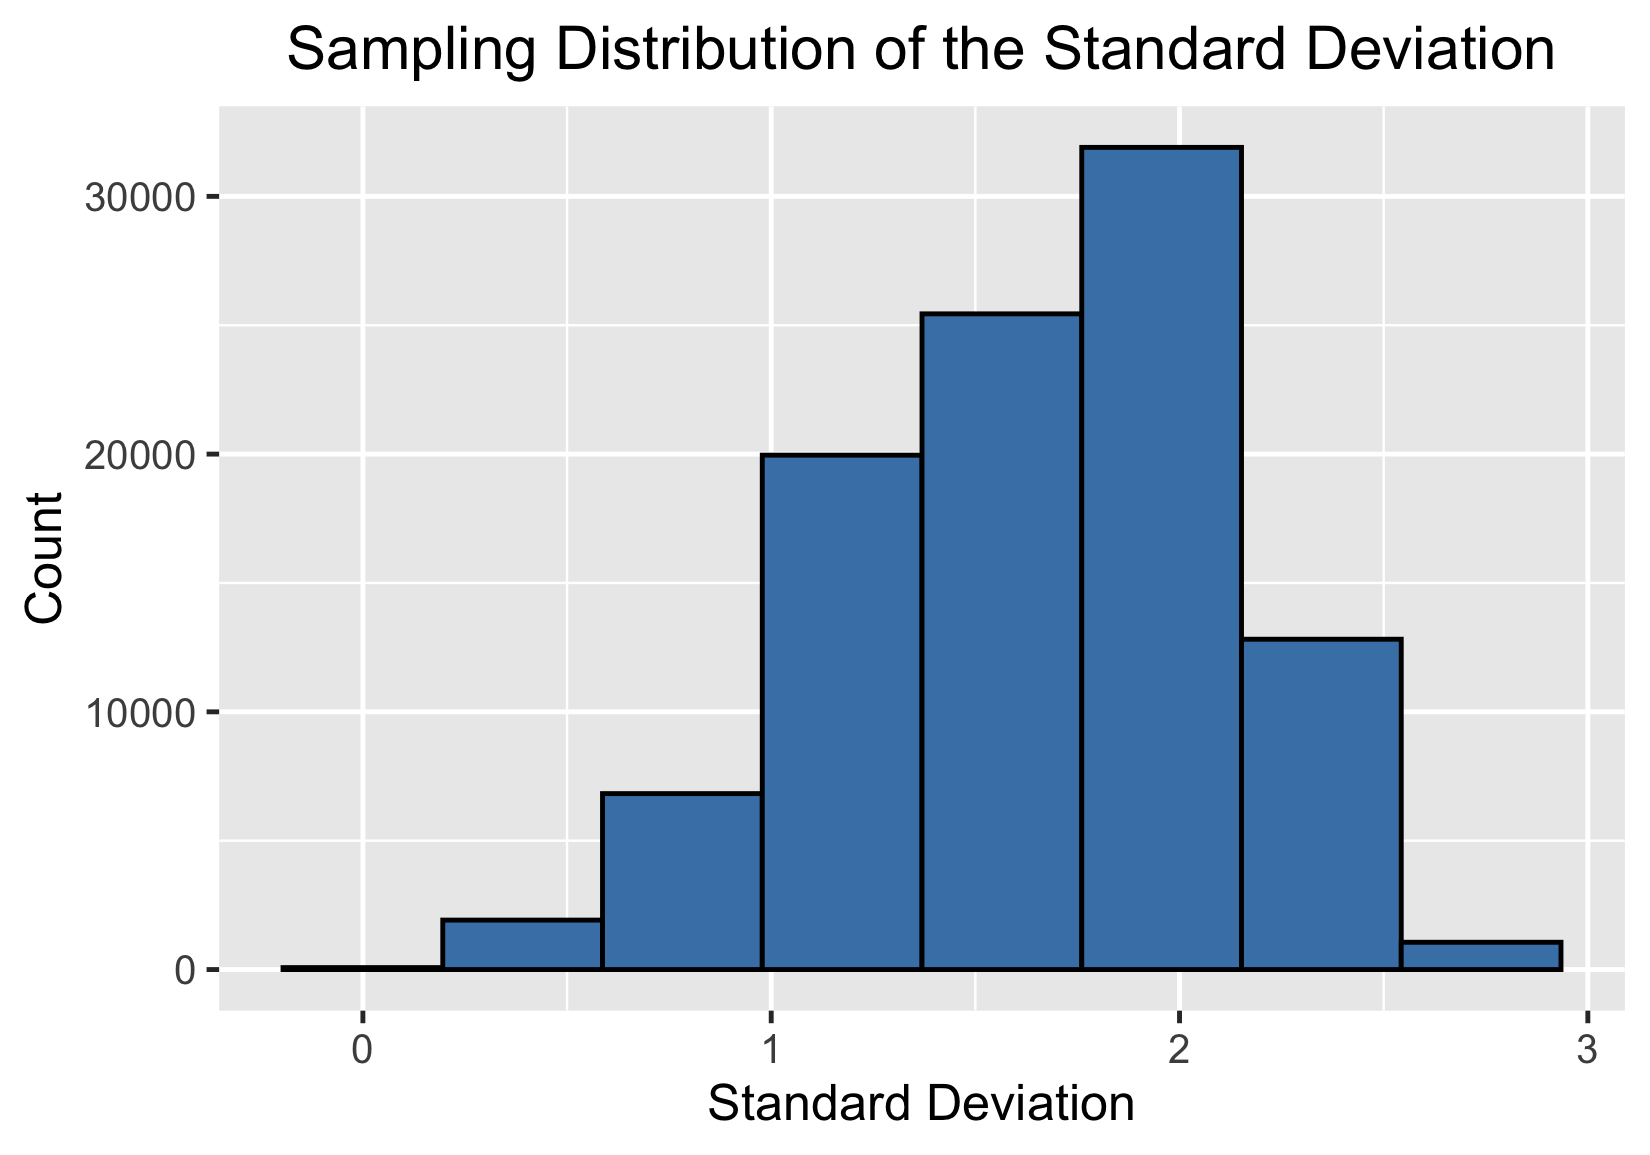
Standard deviation and the CLT
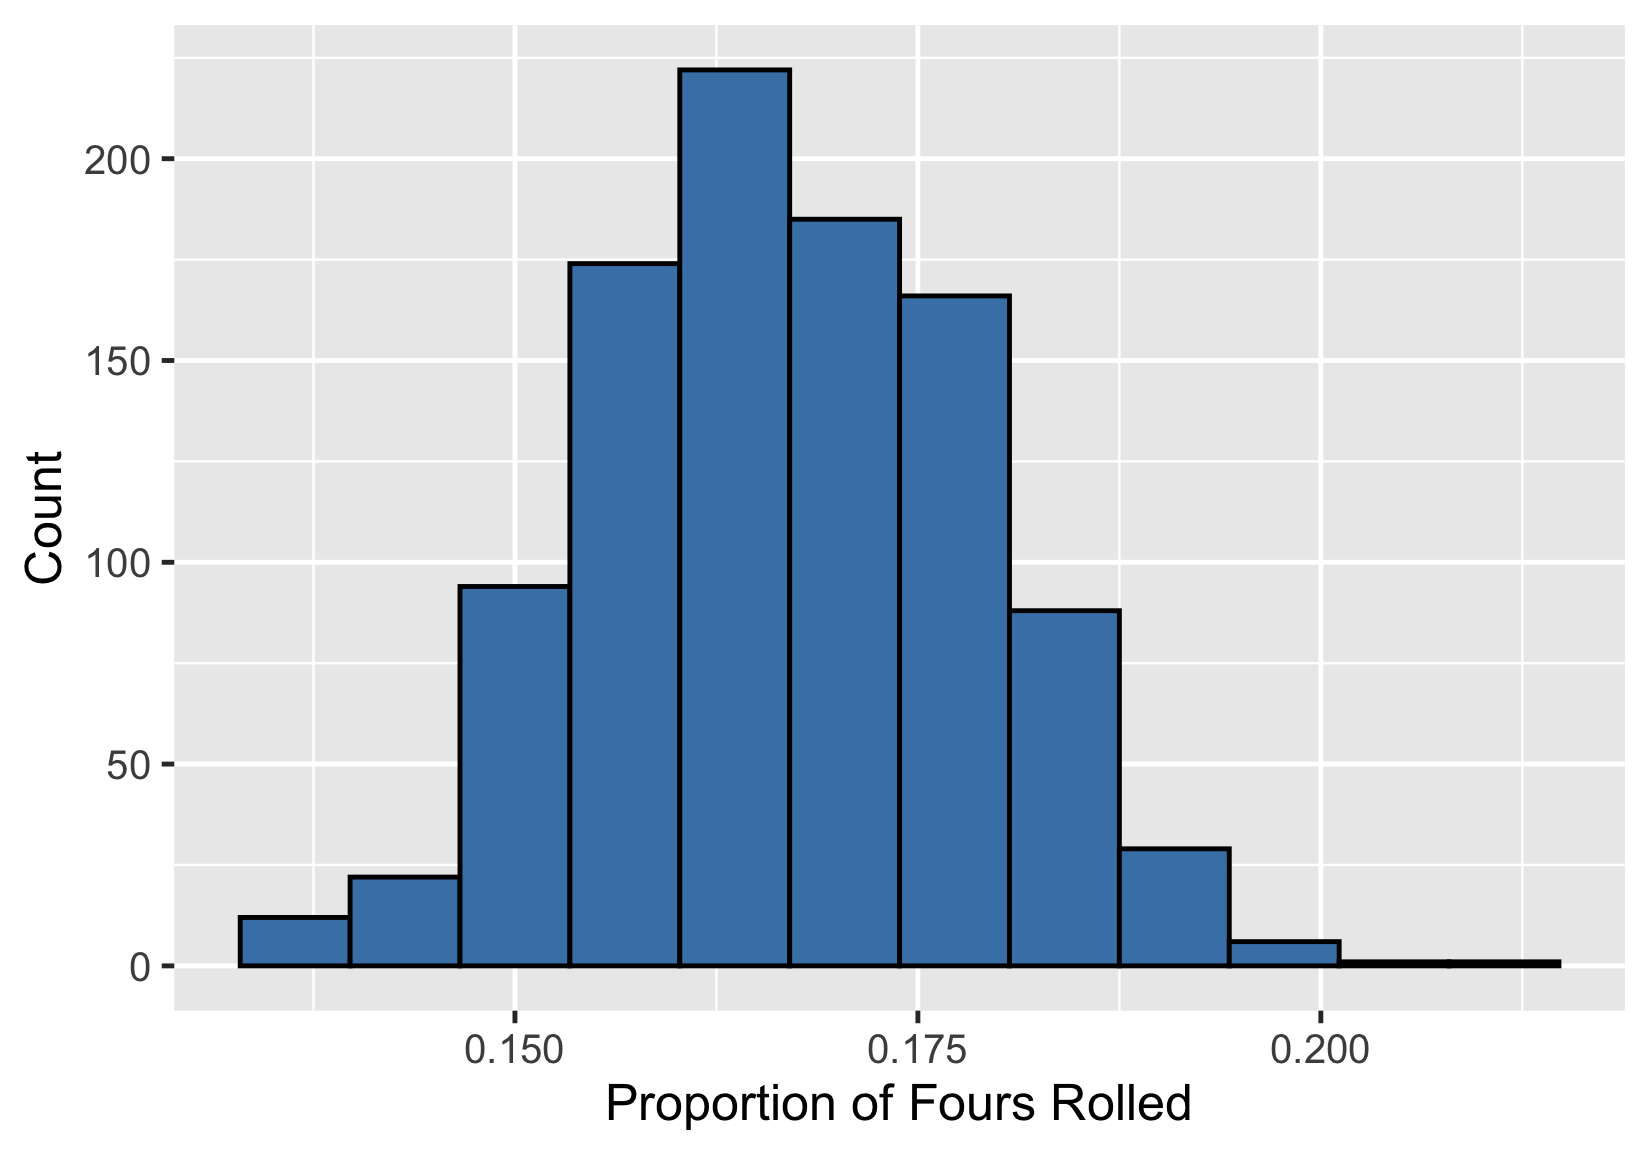
Sampling distribution of proportion
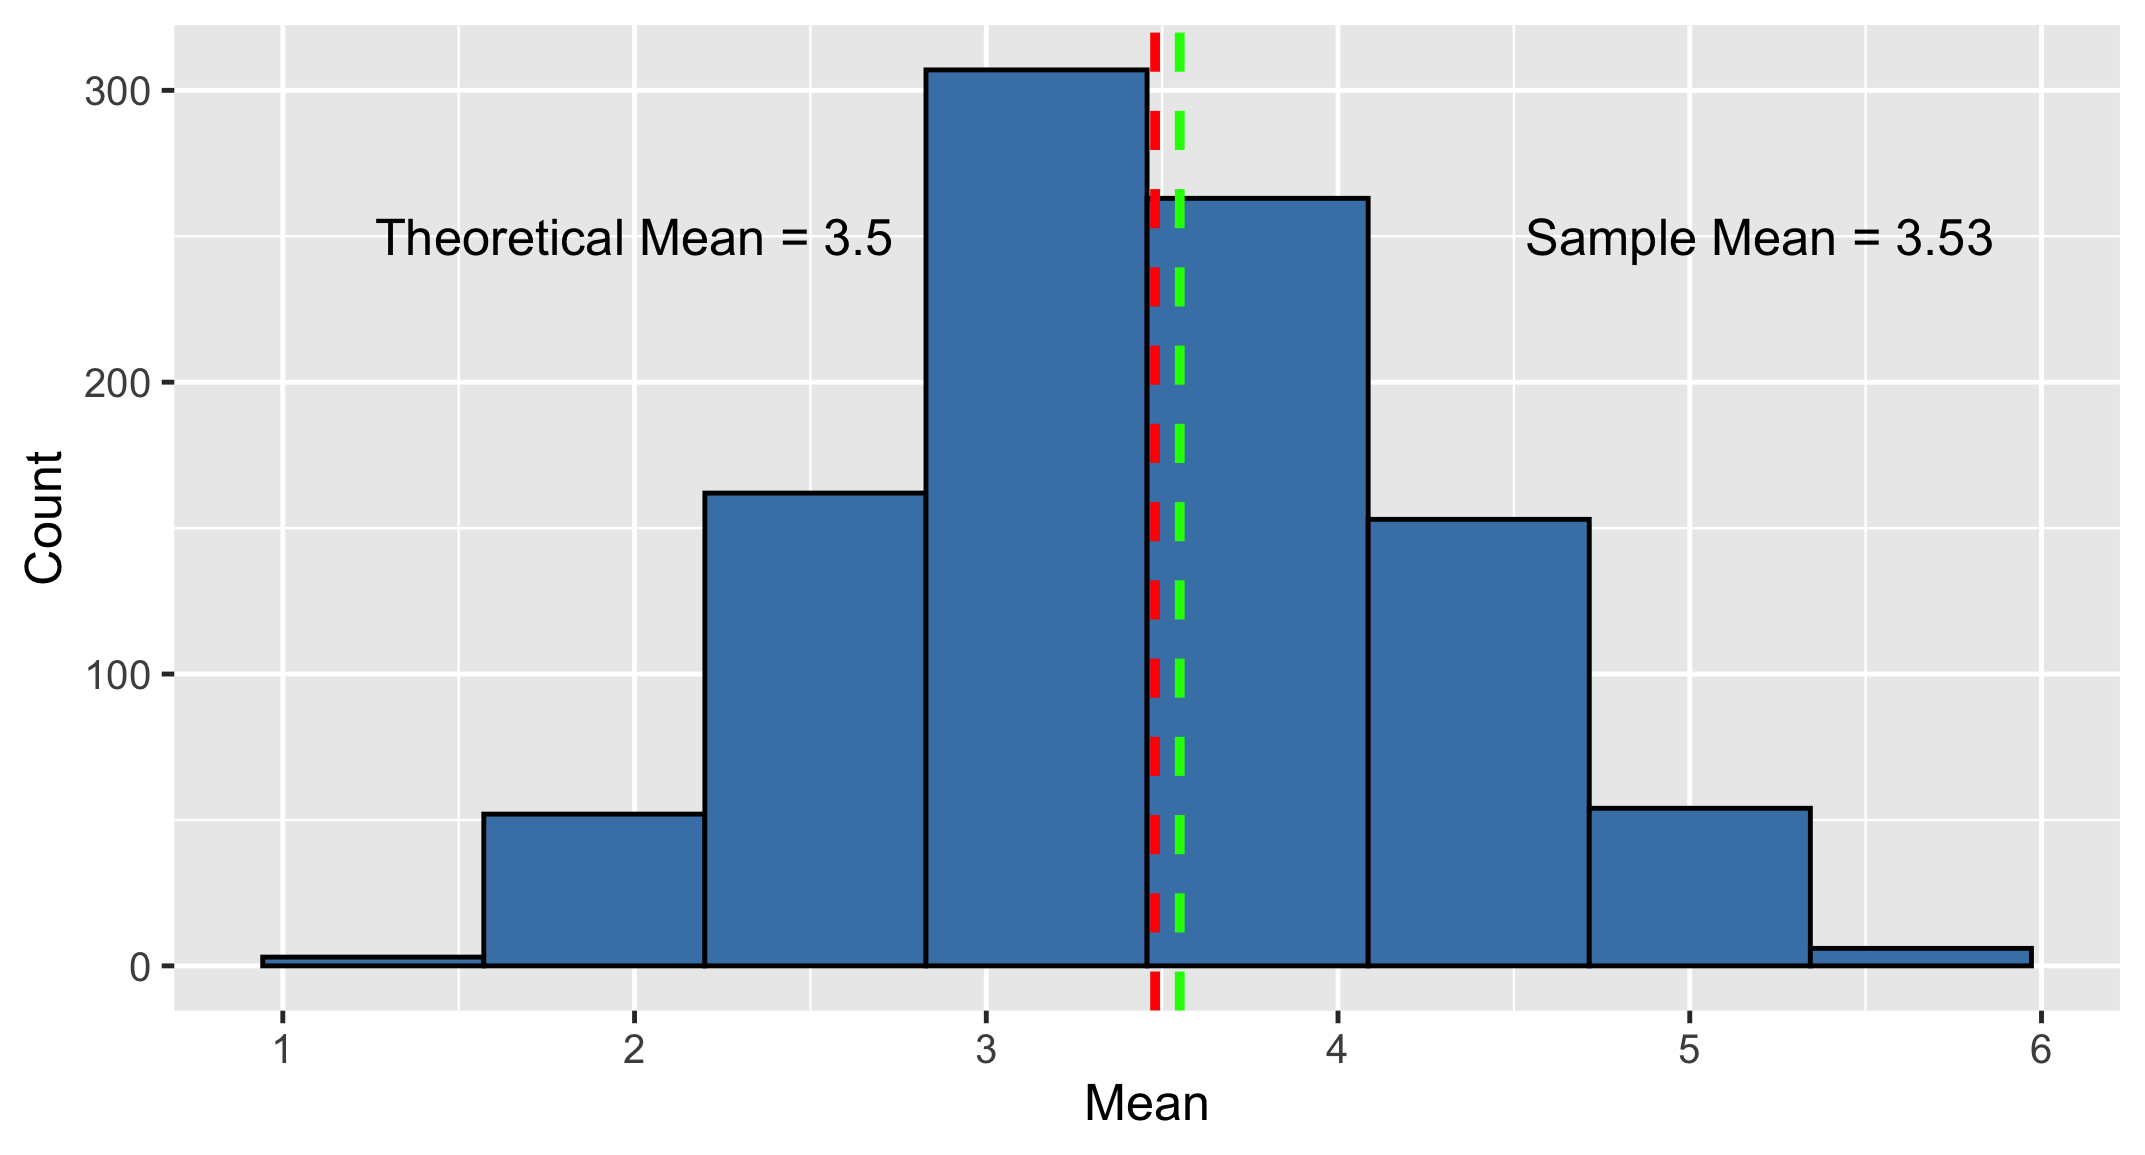
Mean of the sampling distribution
Benefits of the central limit theorem