Discrete distributions
Introduction to Statistics

George Boorman
Curriculum Manager, DataCamp
Rolling the dice
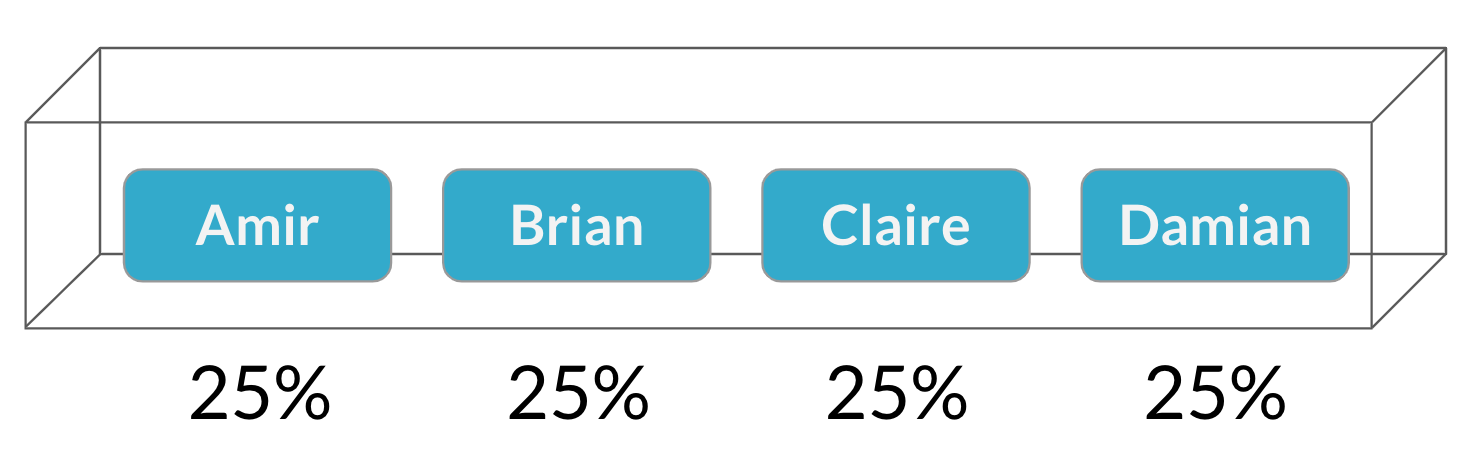
Choosing salespeople
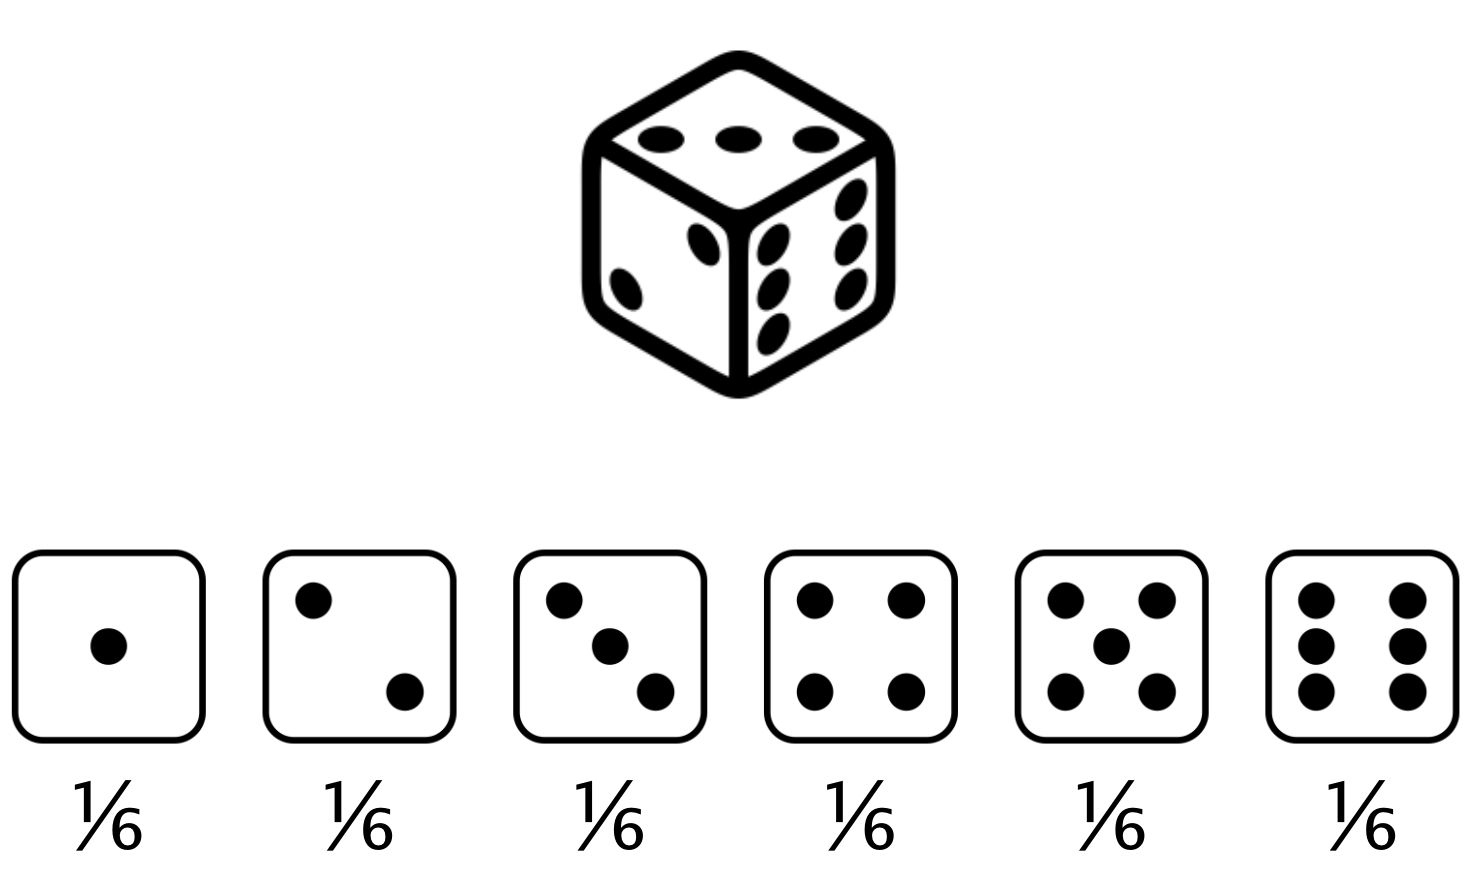
Probability distribution
Describes the probability of each possible outcome in a scenario
Expected value: The mean of a probability distribution
Expected value of a fair die roll = $(1 \times \frac{1}{6}) + (2 \times \frac{1}{6}) +(3 \times \frac{1}{6}) +(4 \times \frac{1}{6}) +(5 \times \frac{1}{6}) +(6 \times \frac{1}{6}) = 3.5$
Why are probability distributions important?

Visualizing a probability distribution
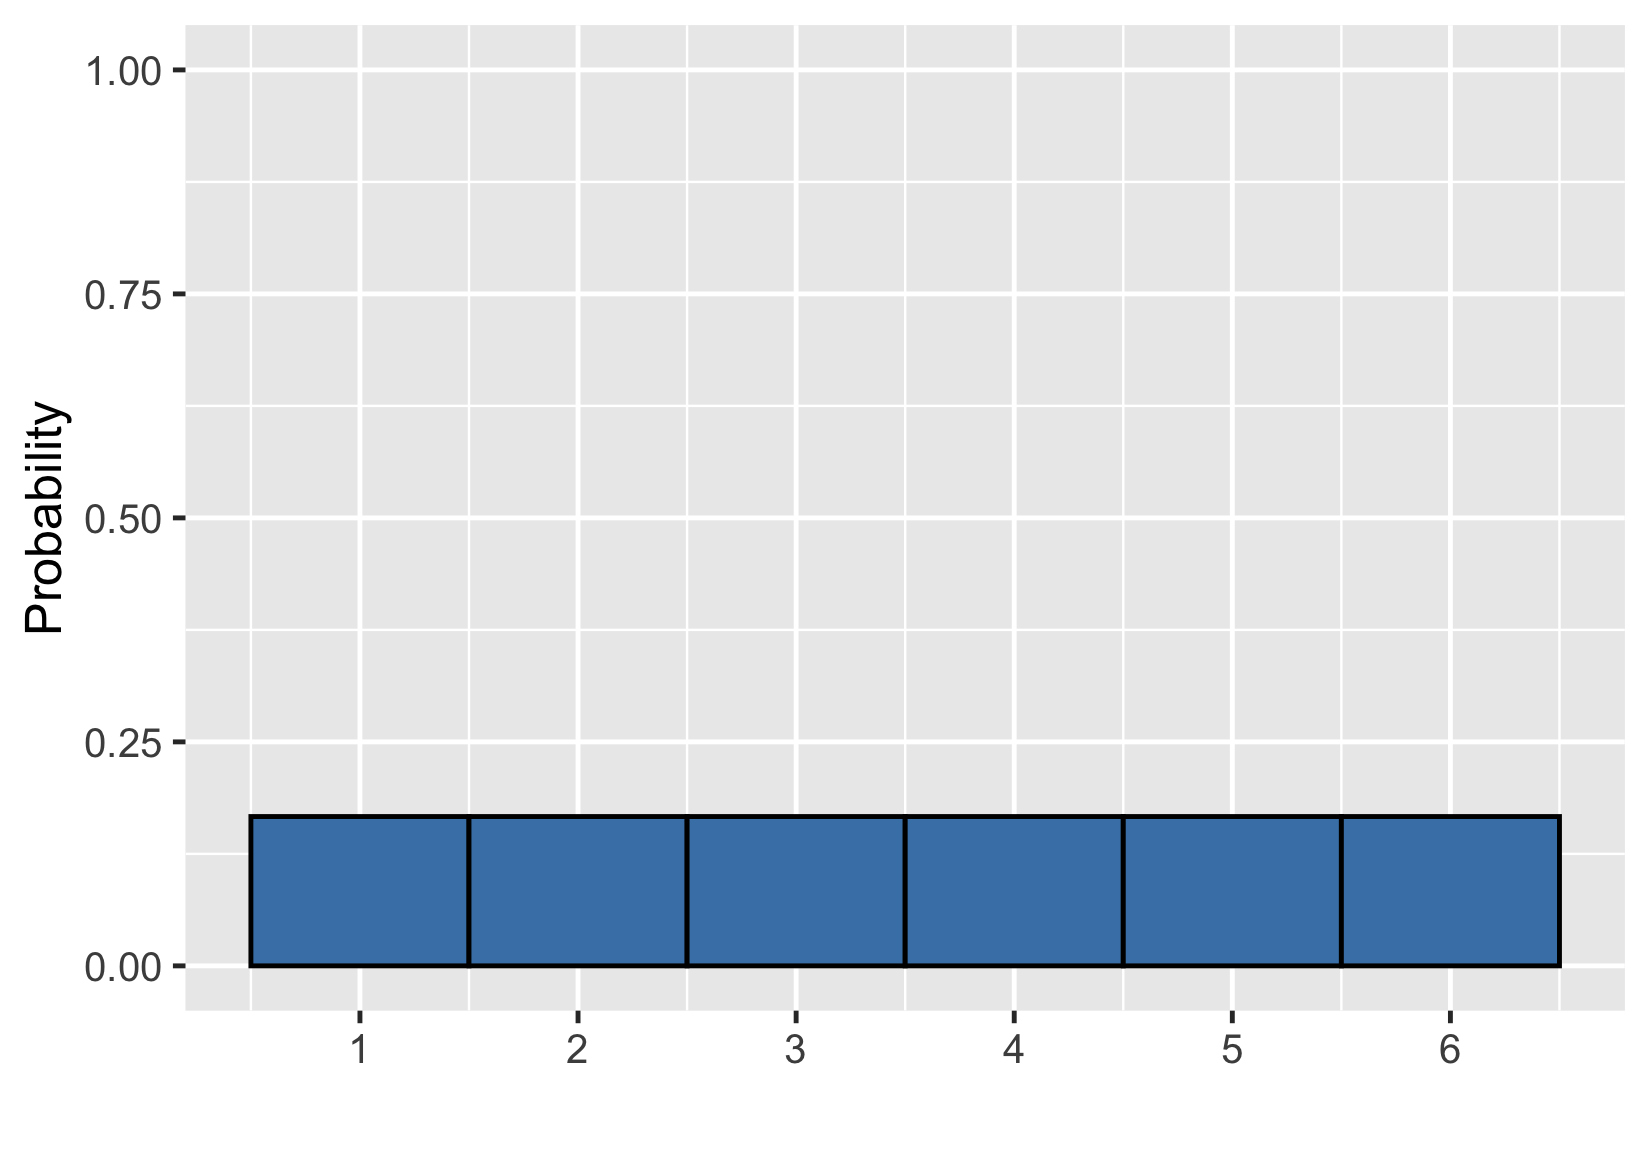
Probability = area
$$P(\text{die roll}) \le 2 = ~?$$
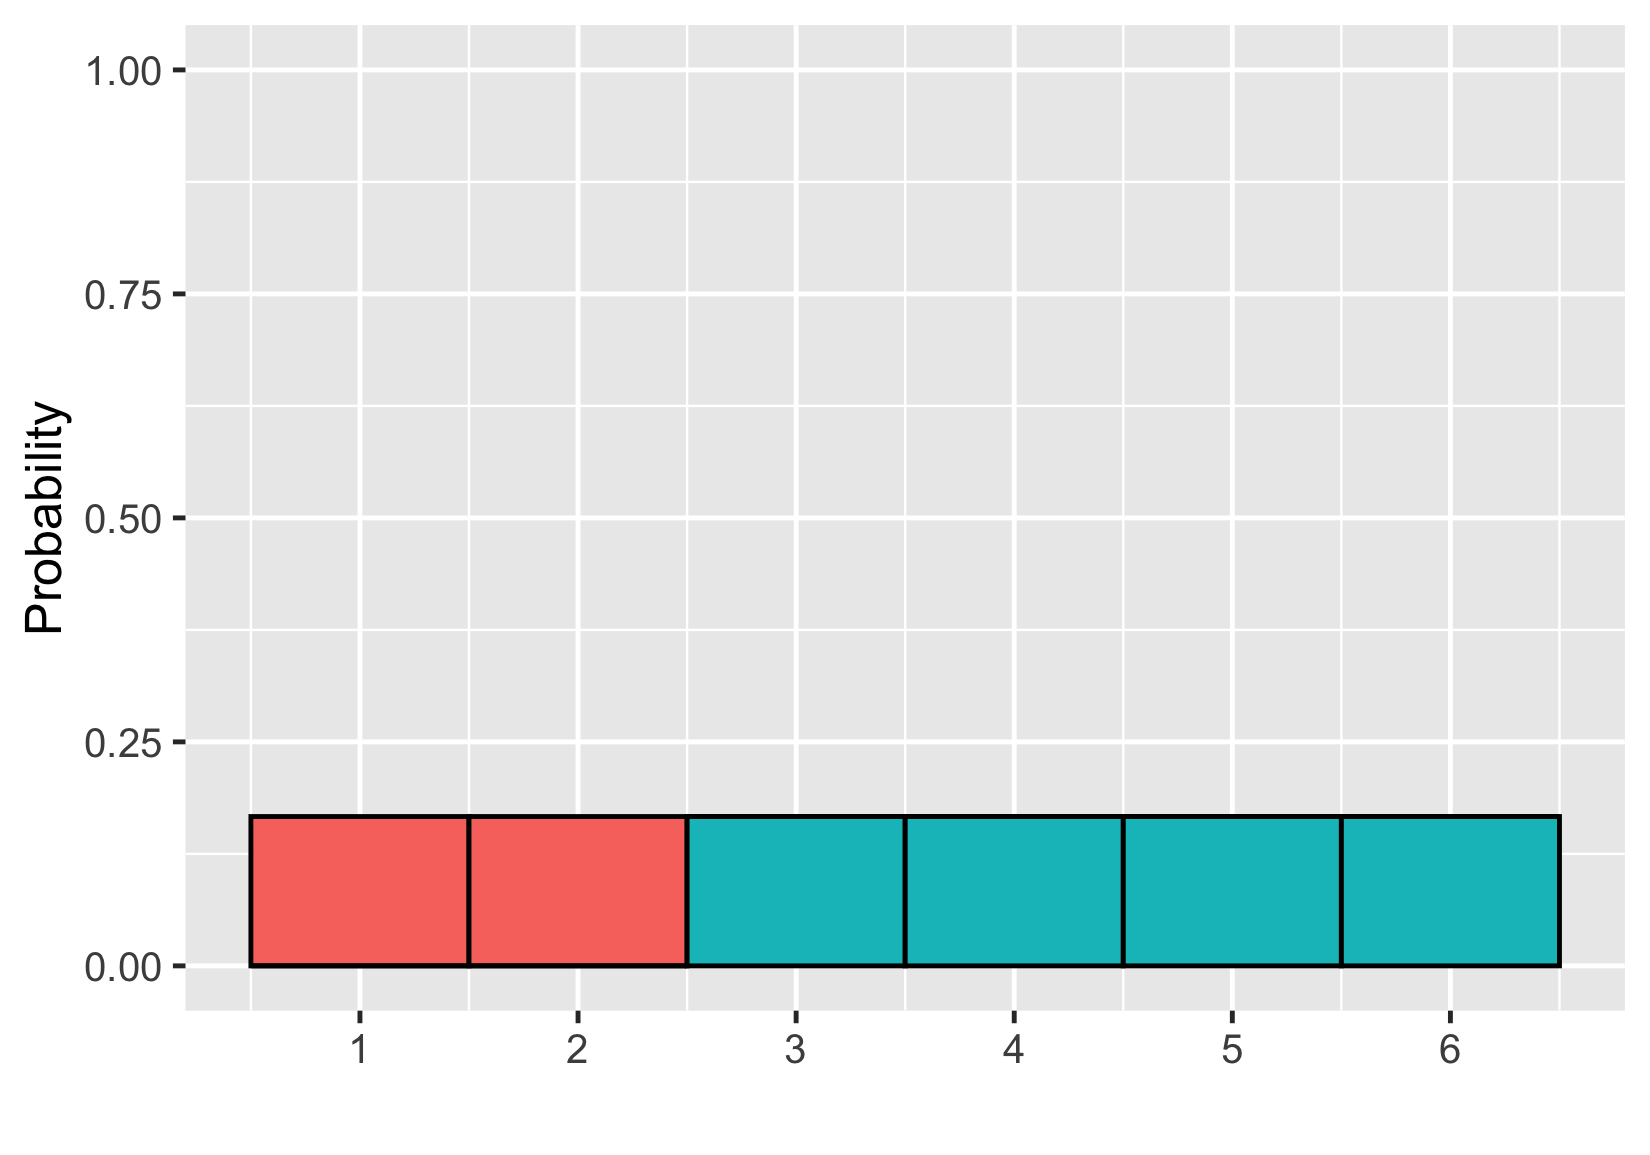
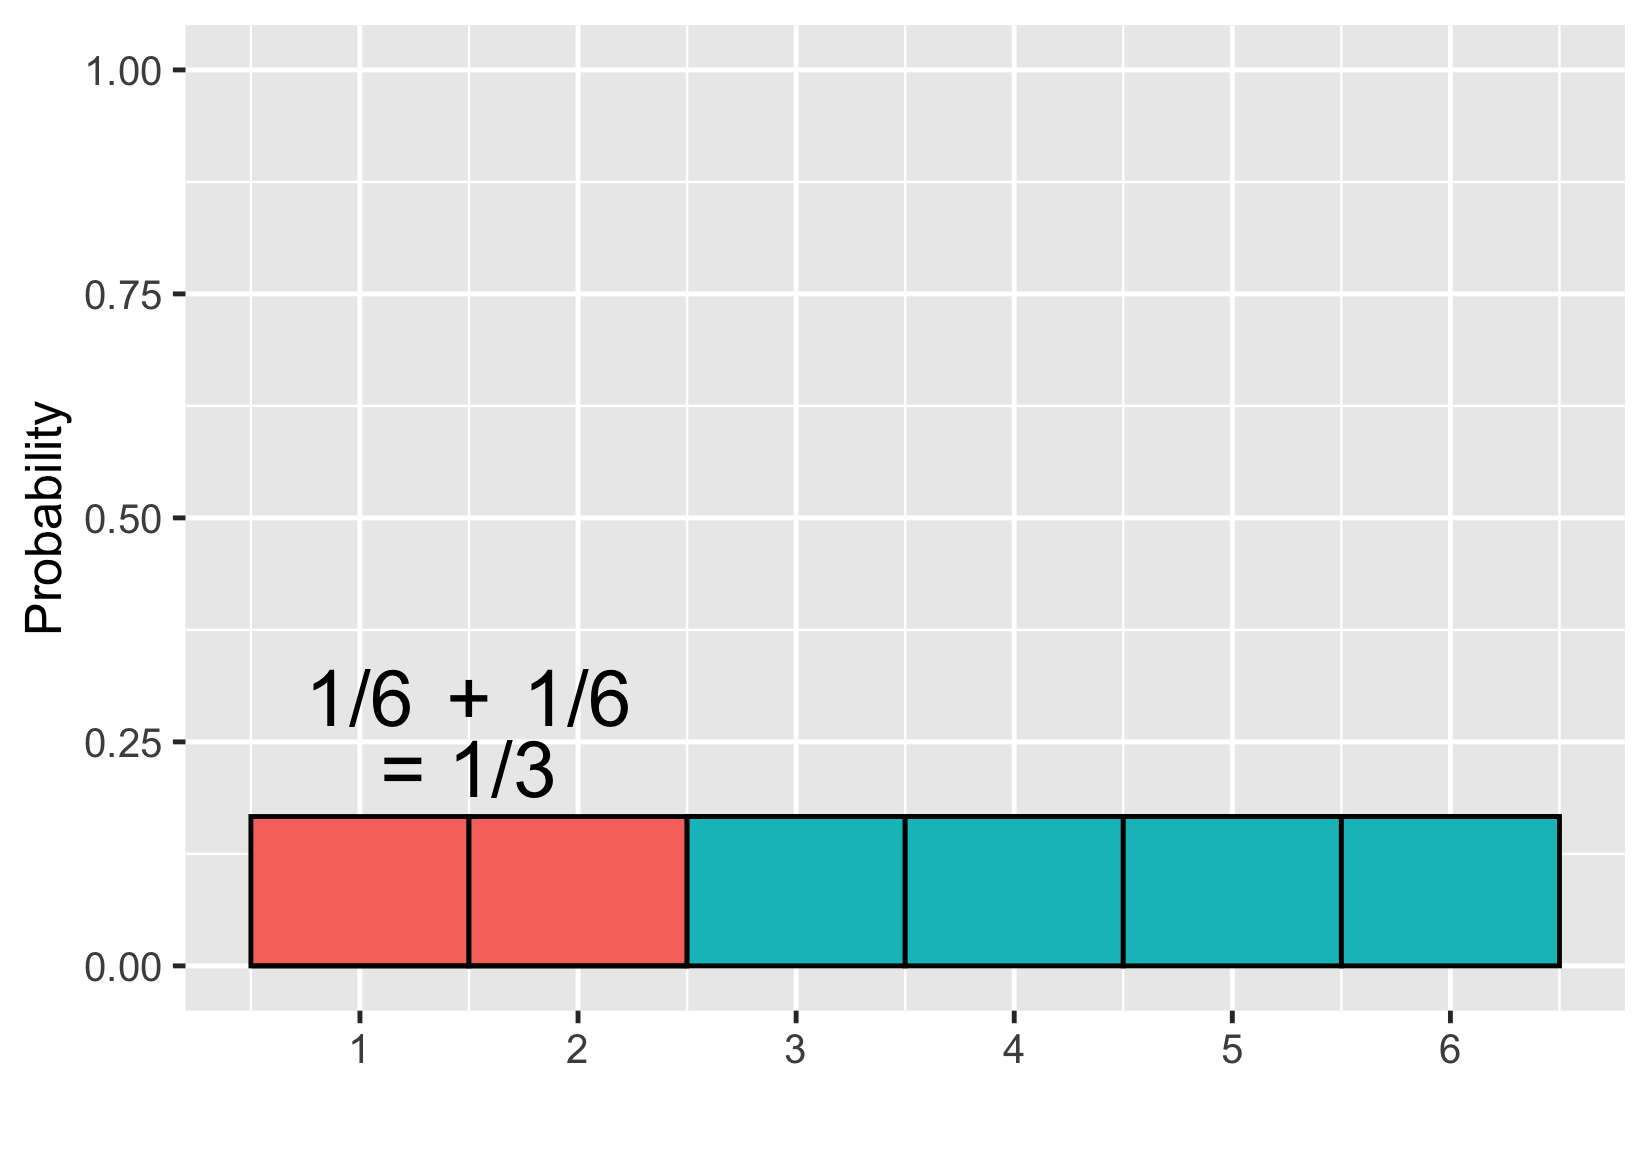
Probability = area
$$P(\text{die roll}) \le 2 = 1/3$$
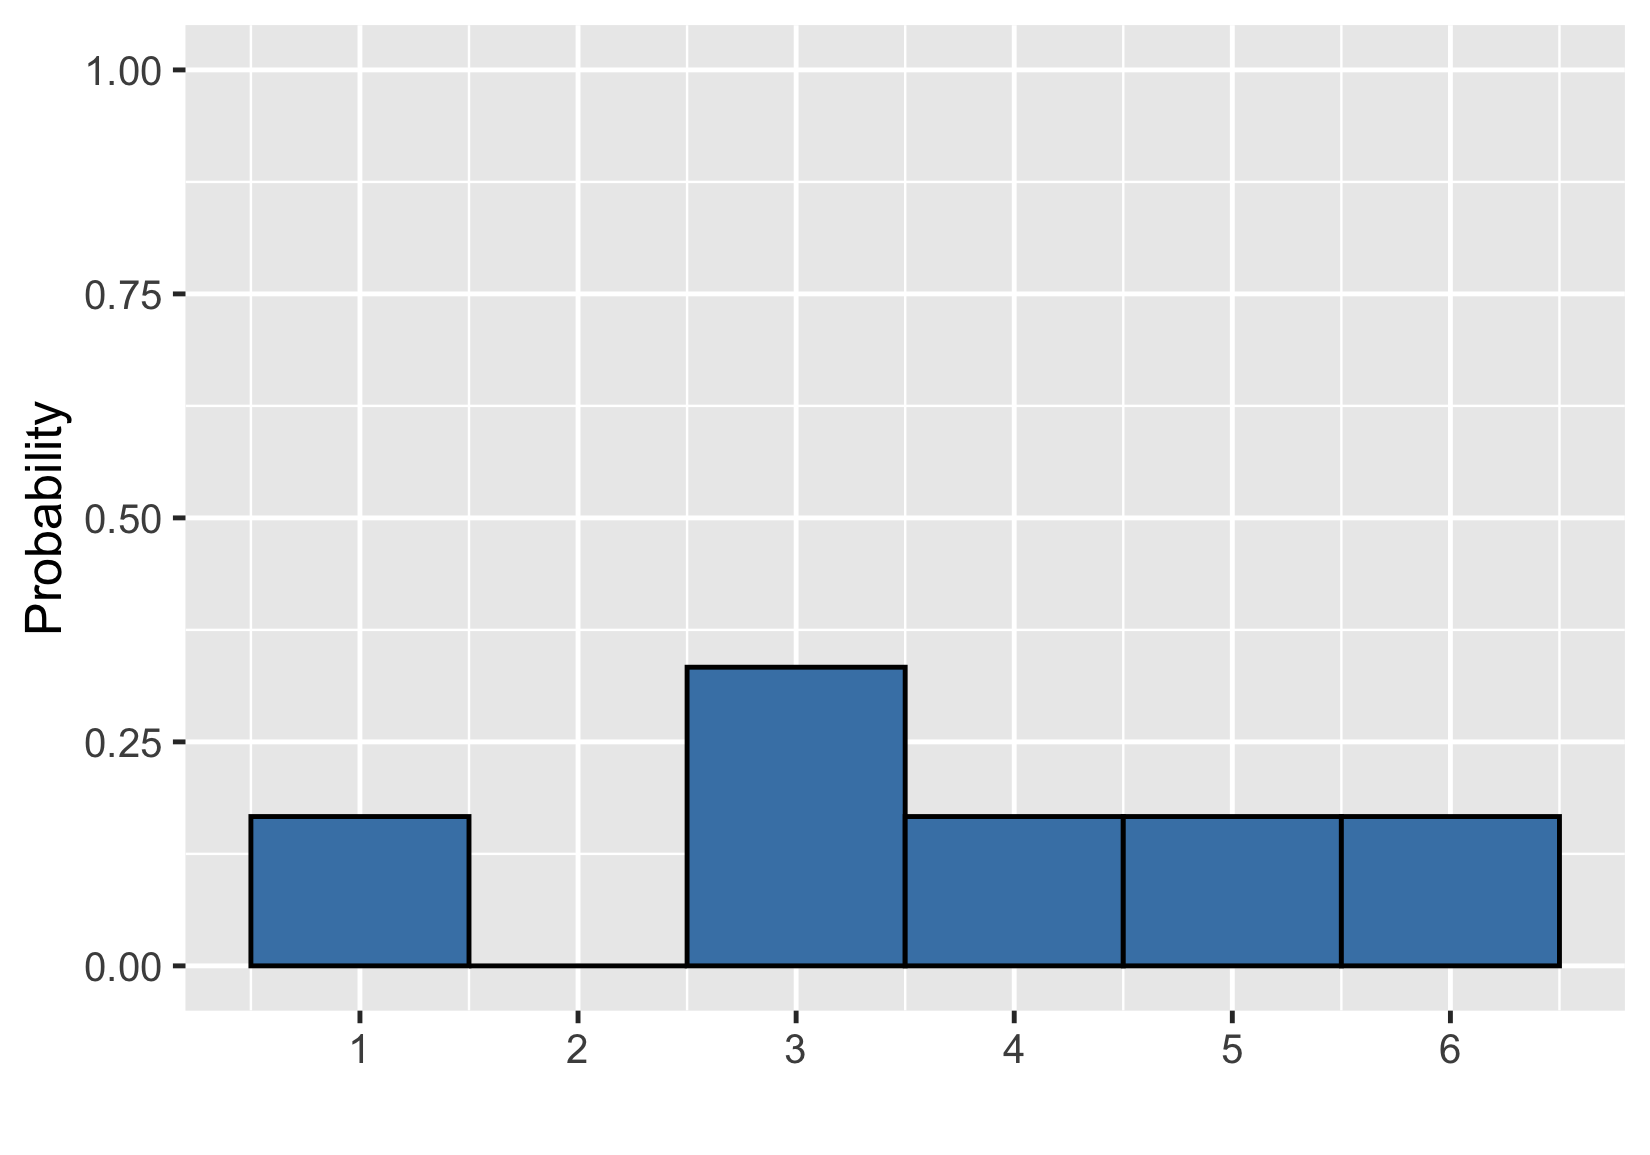
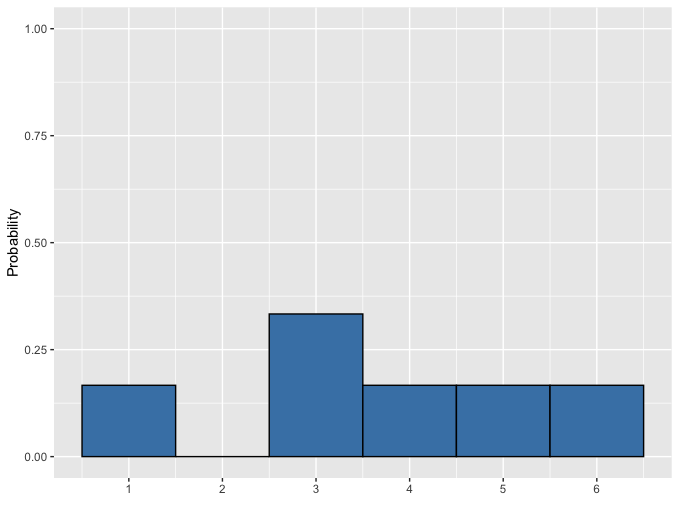
Uneven die
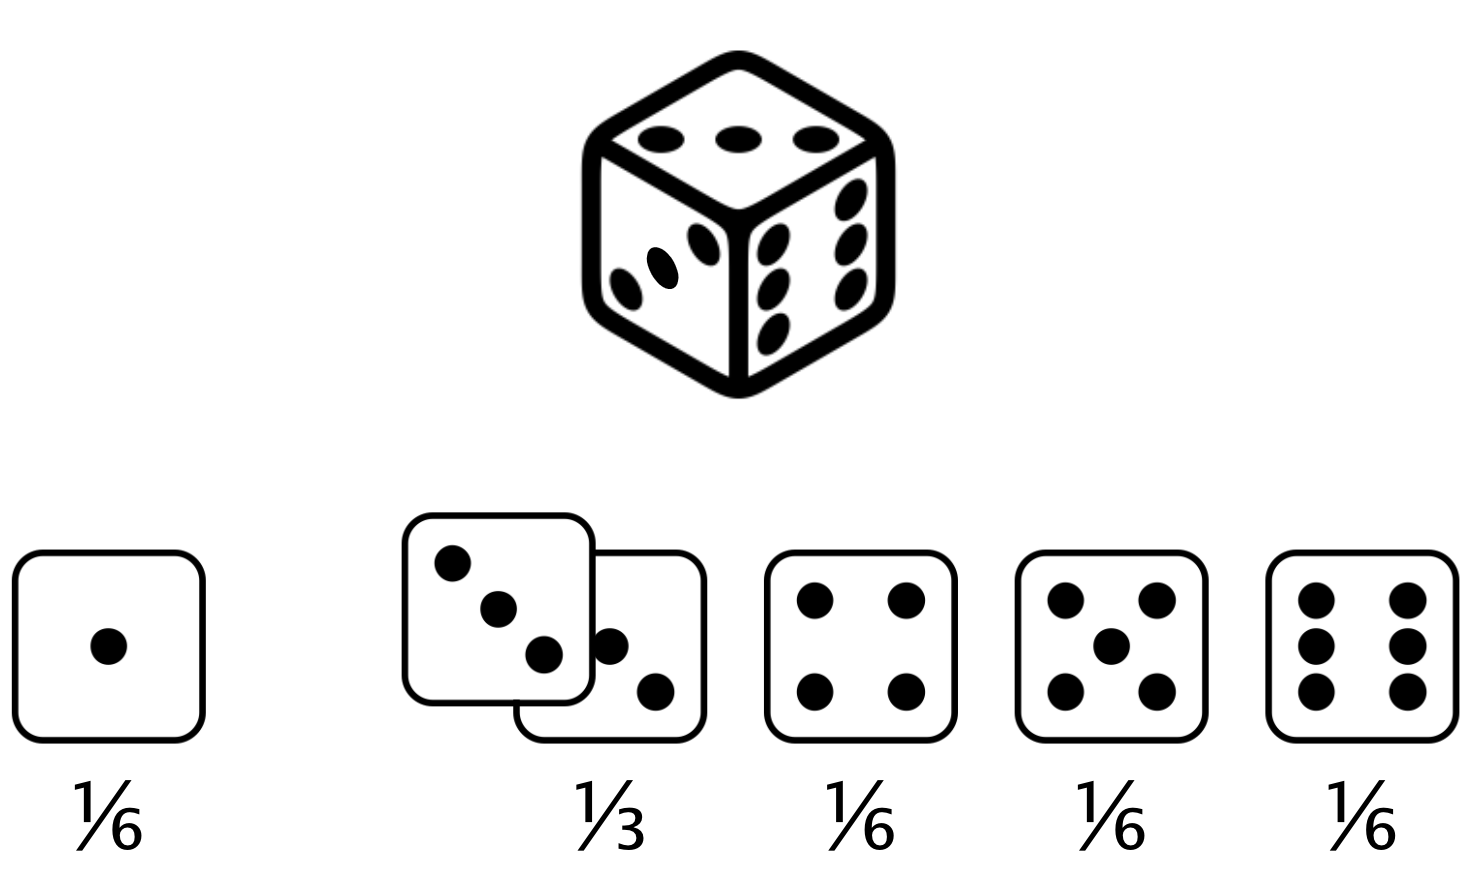
Expected value of uneven die roll = $(1 \times \frac{1}{6}) +(2 \times 0) +(3 \times \frac{1}{3}) +(4 \times \frac{1}{6}) +(5 \times \frac{1}{6}) +(6 \times \frac{1}{6}) = 3.67$
Visualizing uneven probabilities
Adding areas
$$P(\text{uneven die roll}) \le 2 = ~?$$
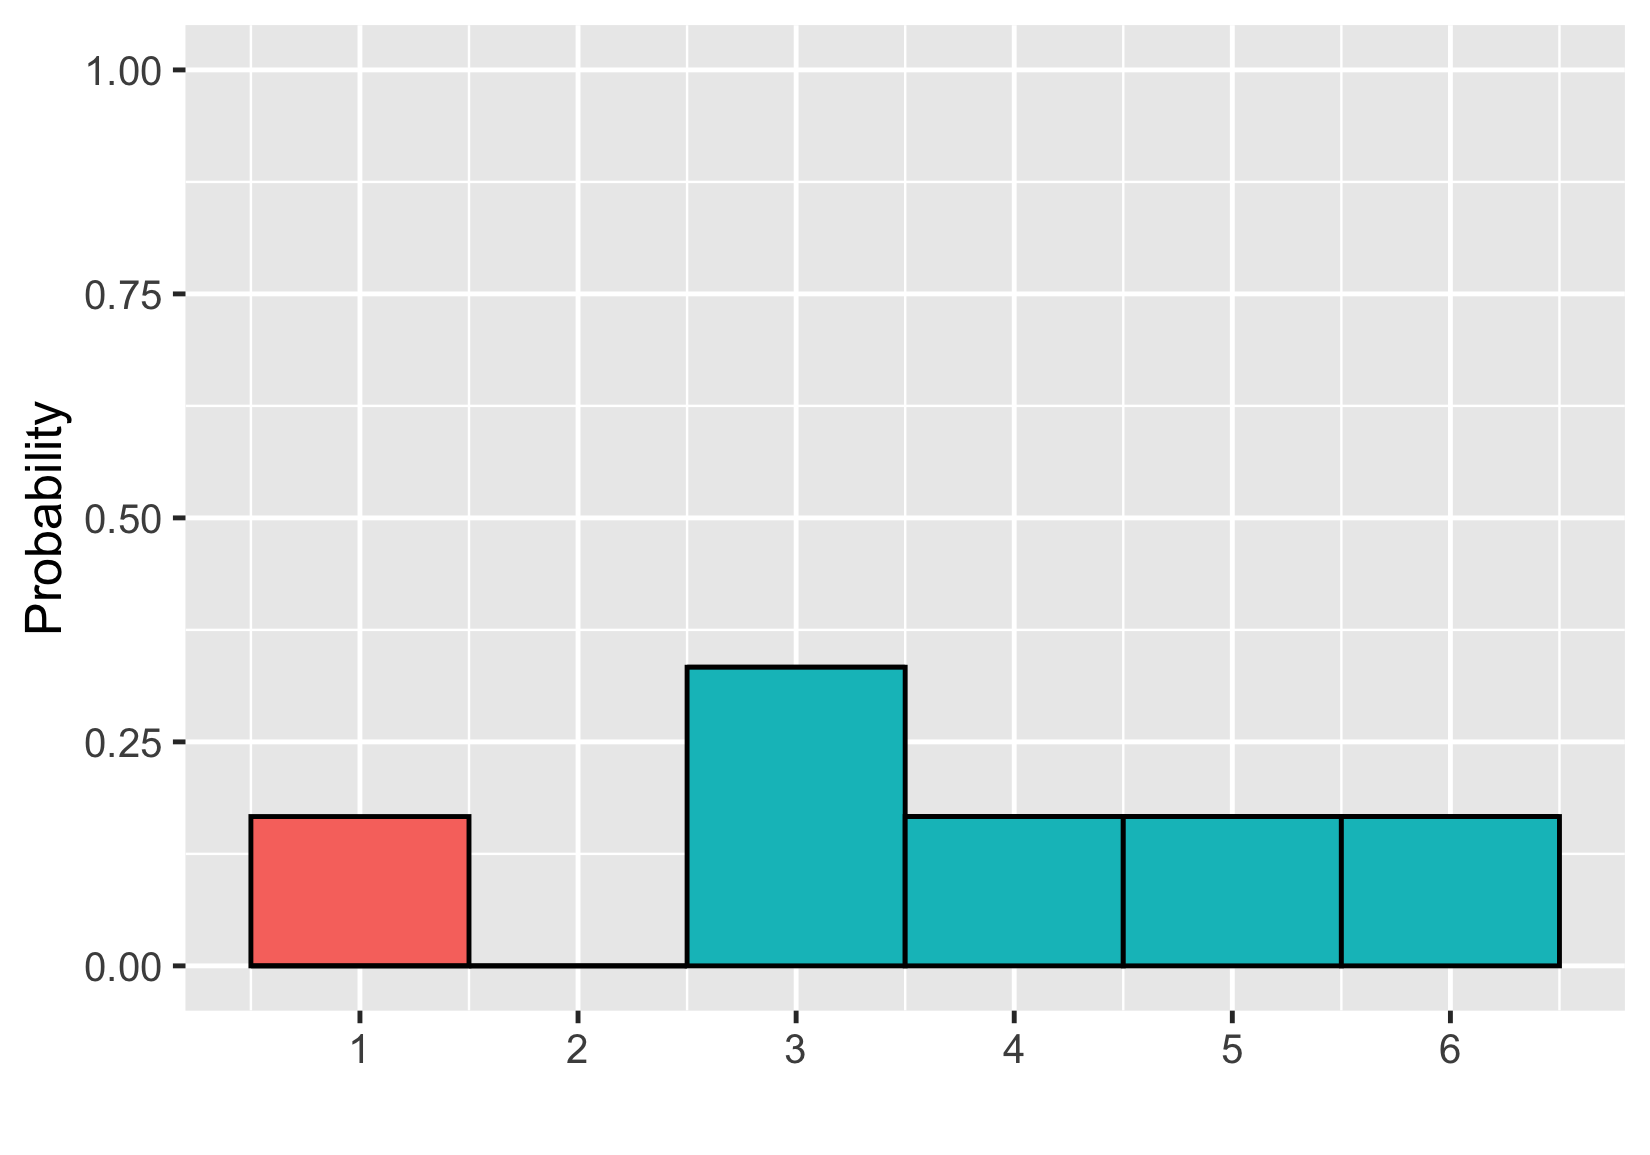
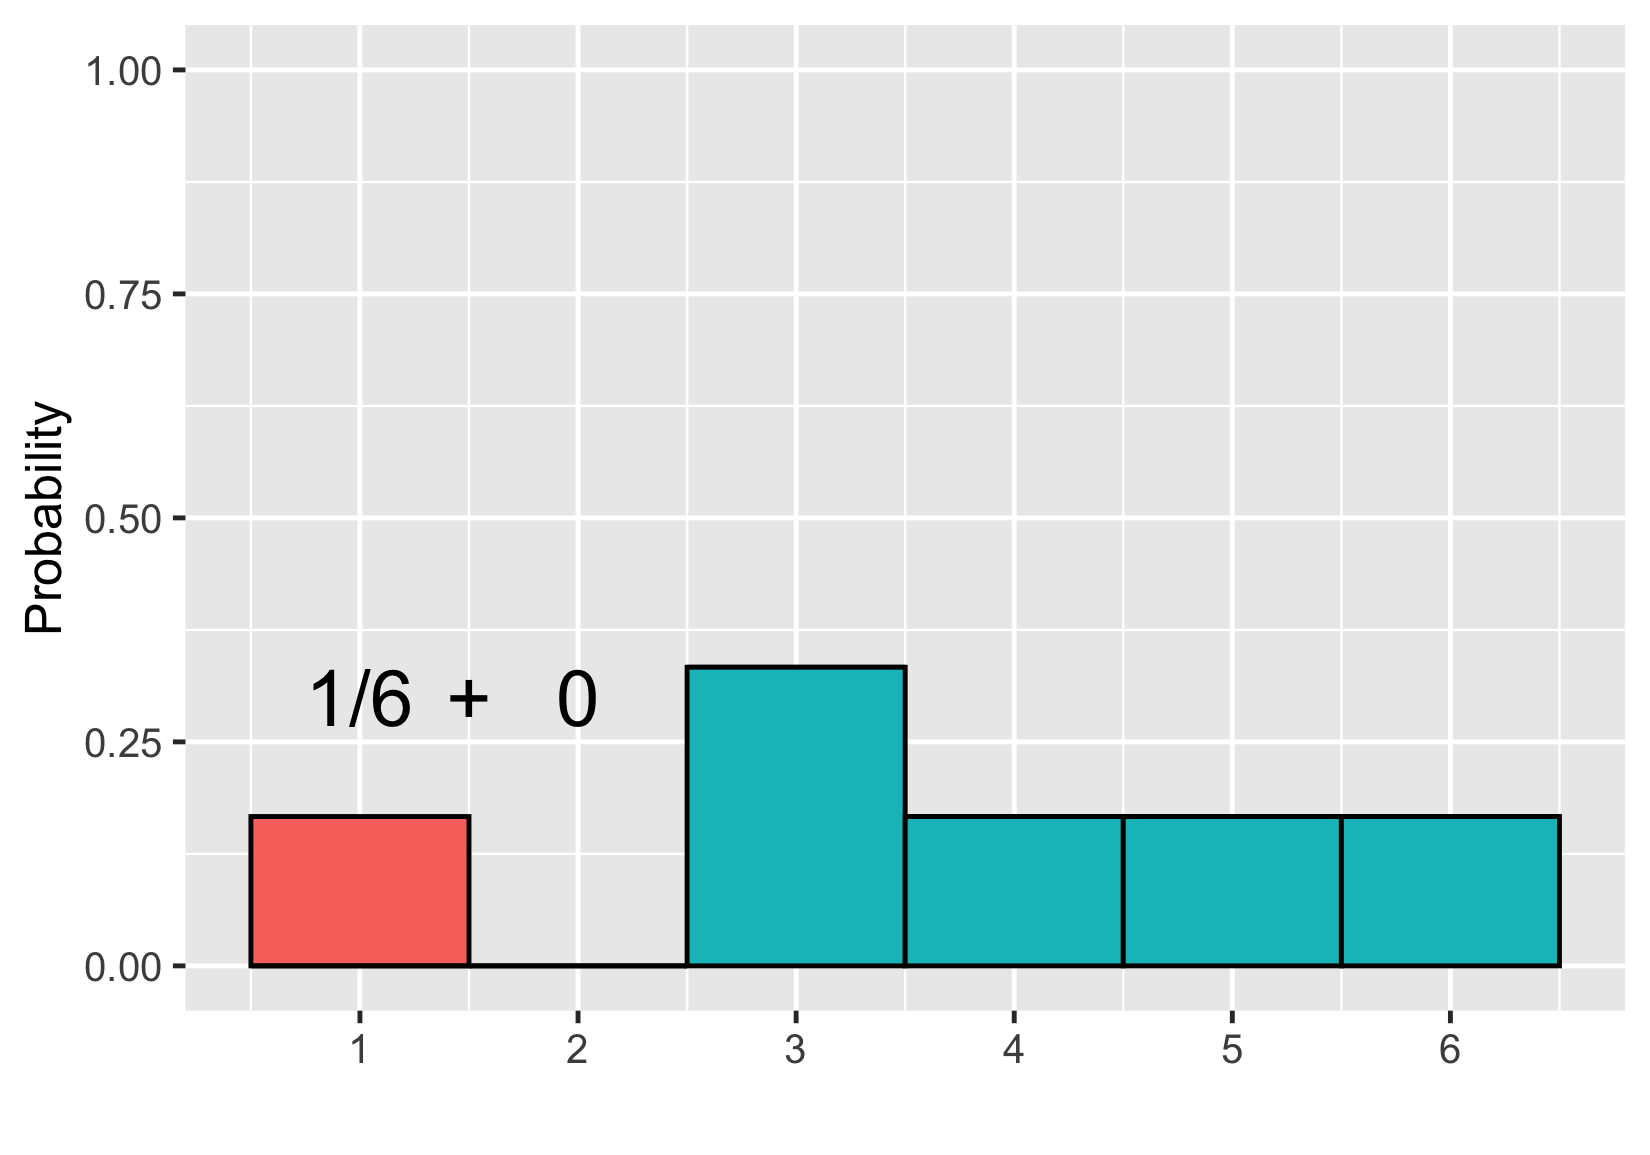
Adding areas
$$P(\text{uneven die roll}) \le 2 = 1/6$$
Discrete probability distributions
Describe probabilities for discrete outcomes
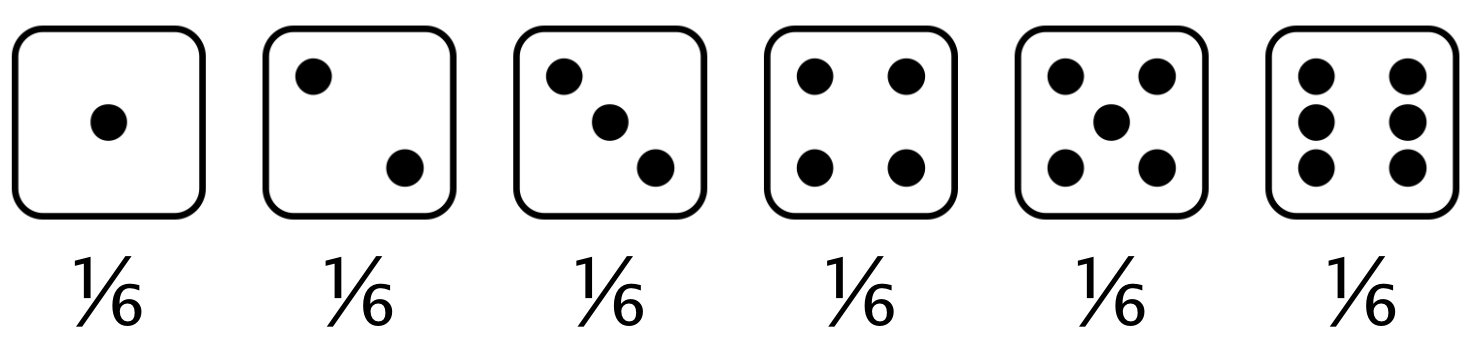
Fair die
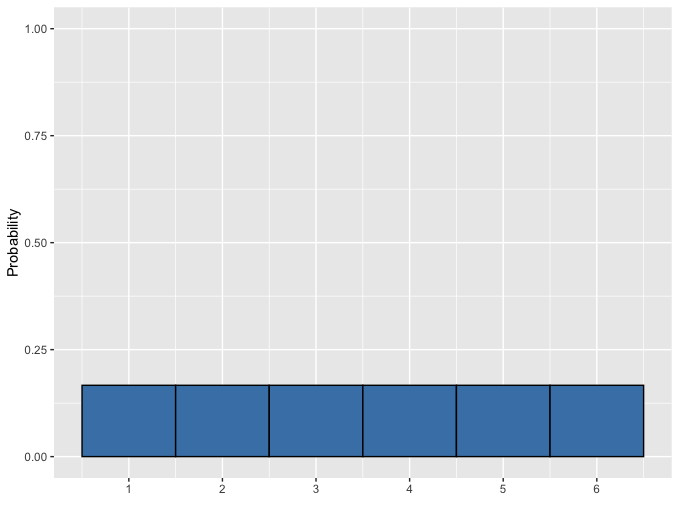
Discrete uniform distribution
Uneven die
Visualizing a sample
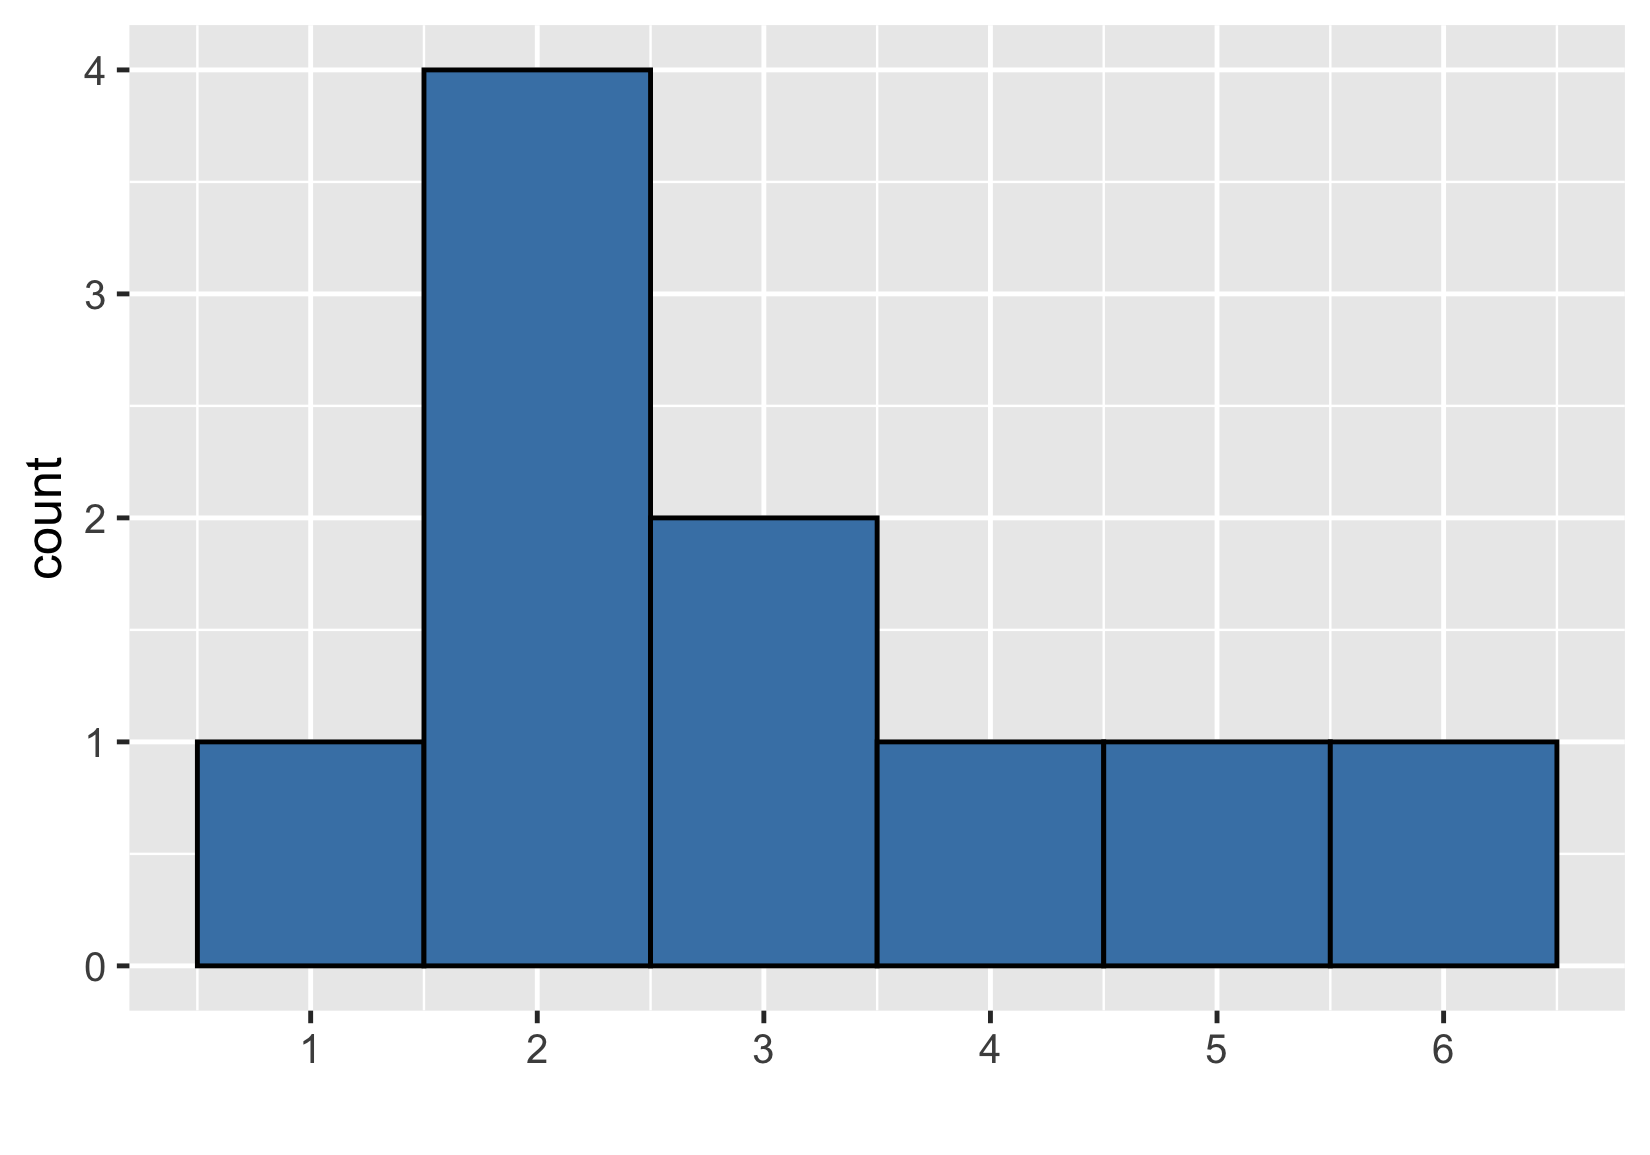
Sample distribution vs theoretical distribution
$ {Mean} = 3.0 $
$ {Mean} = 3.5 $
A bigger sample
Sample of 100 rolls
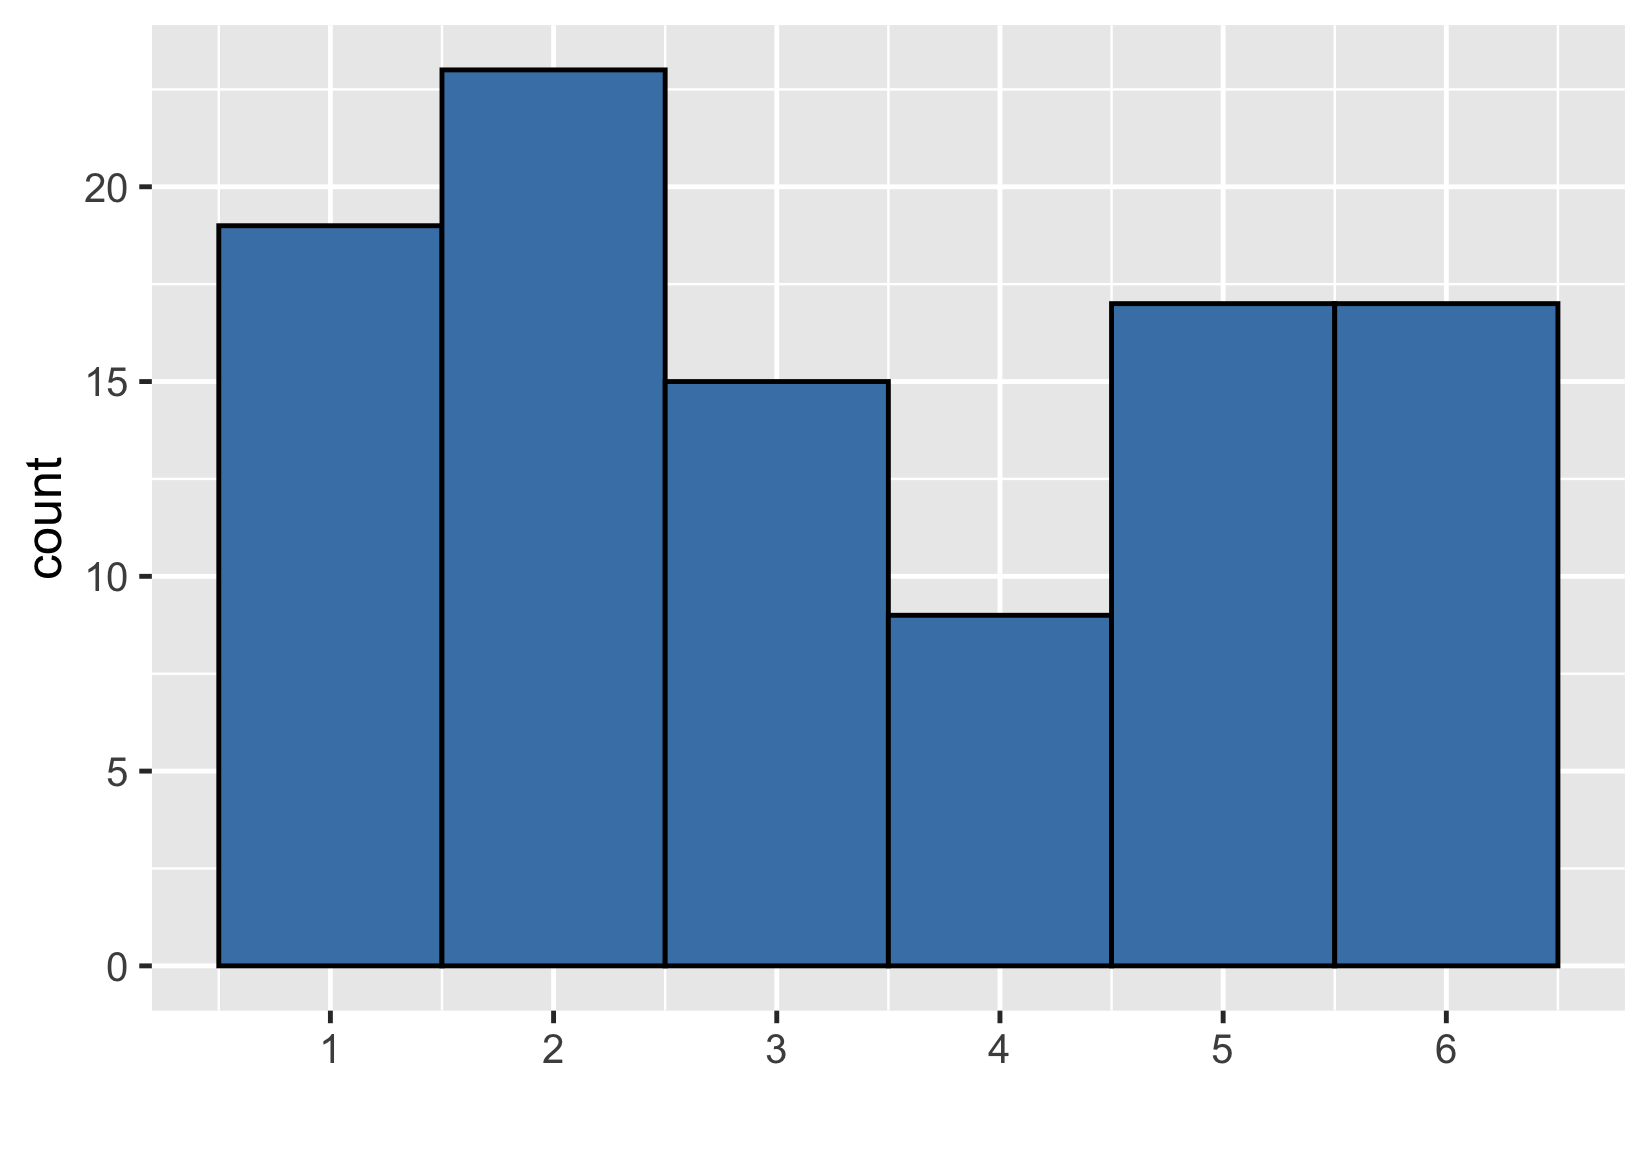
$ {Mean} = 3.33 $
An even bigger sample
Sample of 1000 rolls
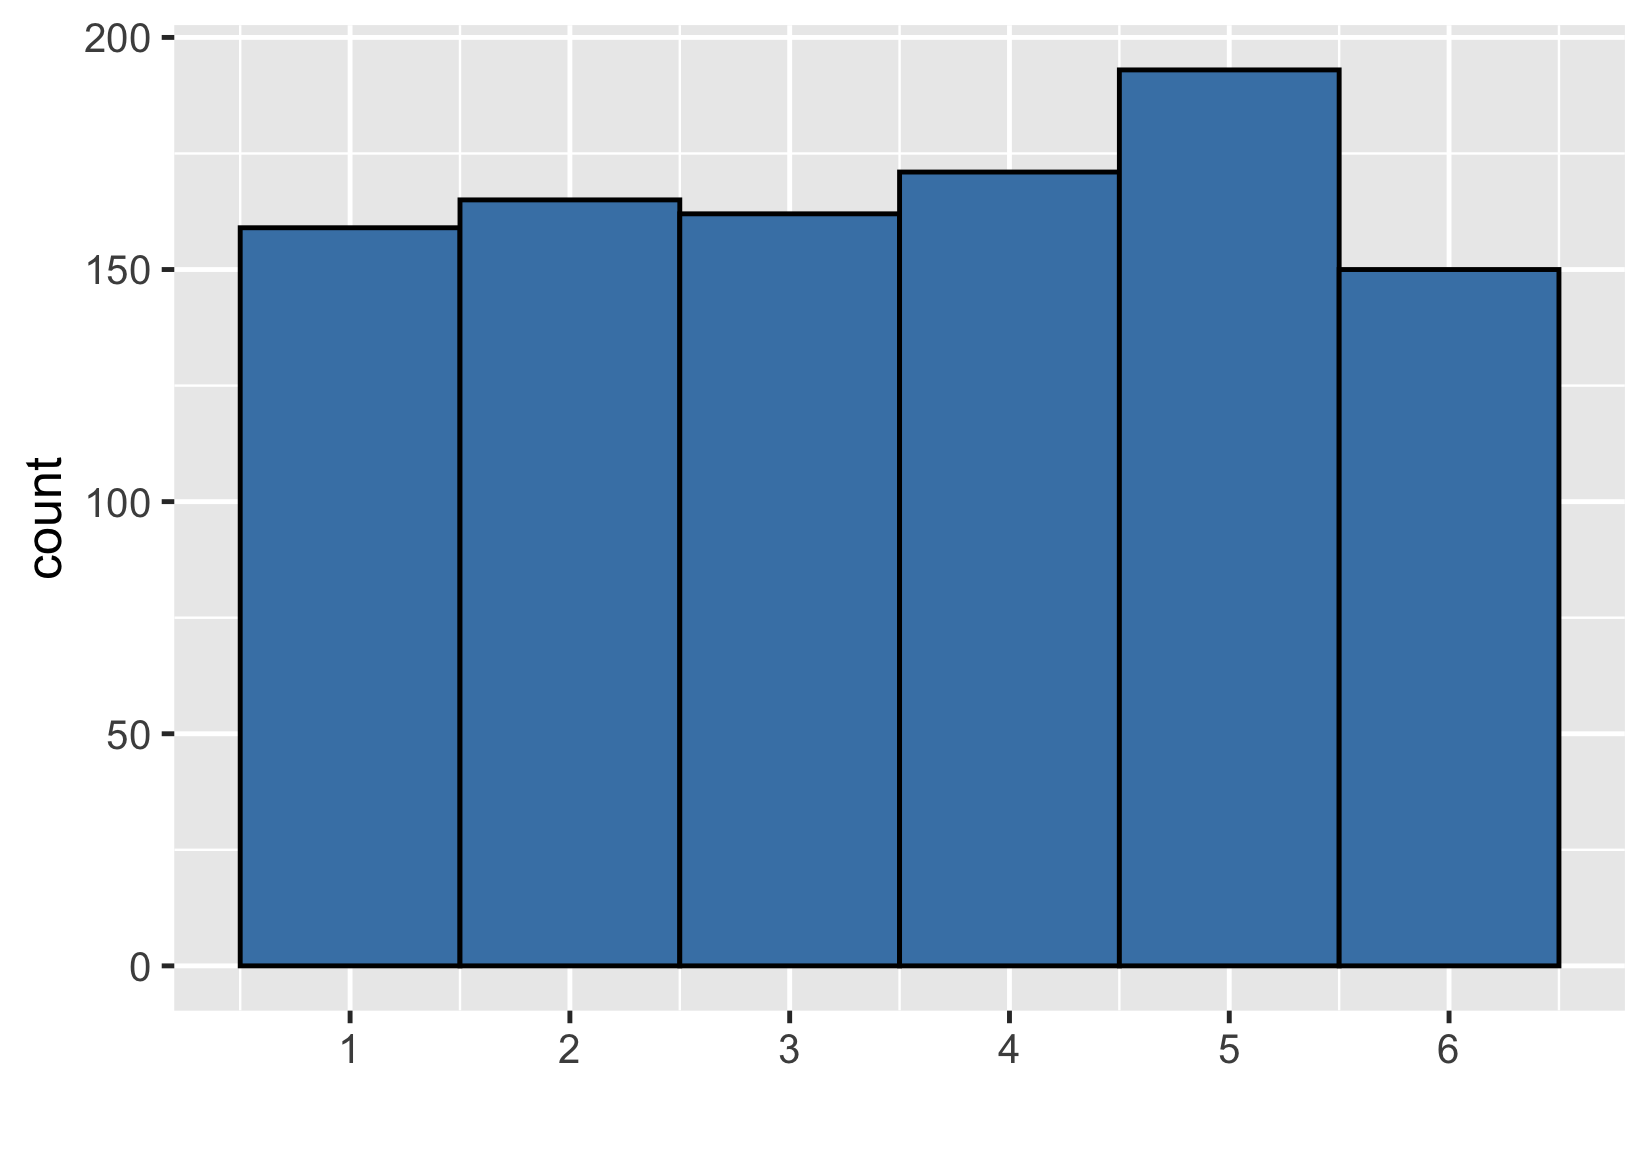
$ {Mean} = 3.52 $

