Customize look and feel

Reports in Power BI

Maarten Van den Broeck

Content Developer at DataCamp

Button states and styles
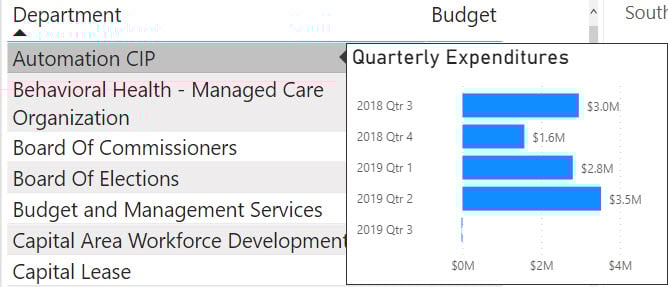
  • Four states for buttons: default, on hover, on press, disabled
  • Can style button text, icon, outline, and fill based on state
  • State does not matter for elements like visual header and action

Buttons may be in one of four states

Reports in Power BI

Custom tooltips

An example of a custom tooltip

  • Power BI page which appears on mouse-over
  • Two types: tooltip on item or help tooltip
  • NOT interactive
Reports in Power BI

Unicode symbols and emoji

Each department has budget icons associated with it

Reports in Power BI

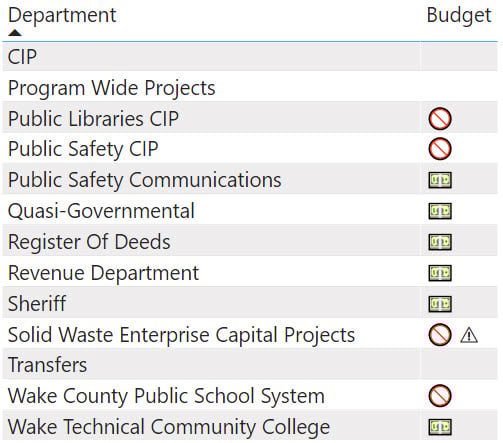
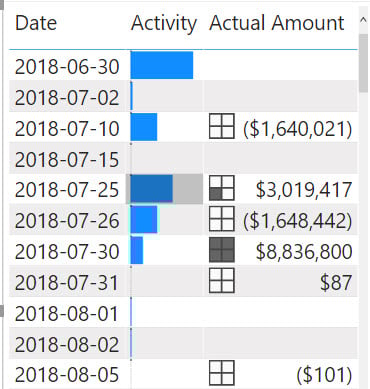
Conditional formatting on tables

Conditional formatting options:

  • Background color
  • Font color
  • Data bars
  • Icons
  • Web URL

Conditional formatting on a table

Reports in Power BI

Edit interactions

Editing interactions between visuals

  • Enable or disable cross-filtering between specific visuals
  • Filter or highlight certain visuals
Reports in Power BI

Edit interactions

Determine whether a treemap should filter other visuals

  • Allow a treemap to drill down for the entire page or just its own visual
  • Prevent "totals" cards from updating as a result of slicers or cross-filters
Reports in Power BI

Filter or highlight?

Choosing between filtering and highlighting

Reports in Power BI

Let's practice!

Reports in Power BI

Preparing Video For Download...