Customize a report with Q&A
Reports in Power BI

Maarten Van den Broeck
Content Developer at DataCamp
How it works
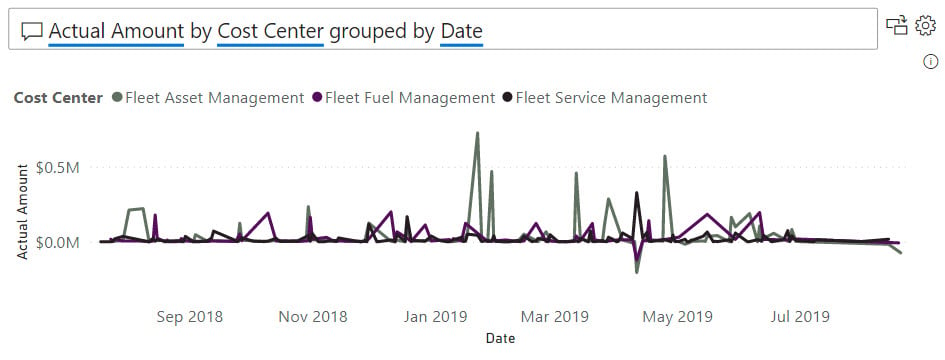
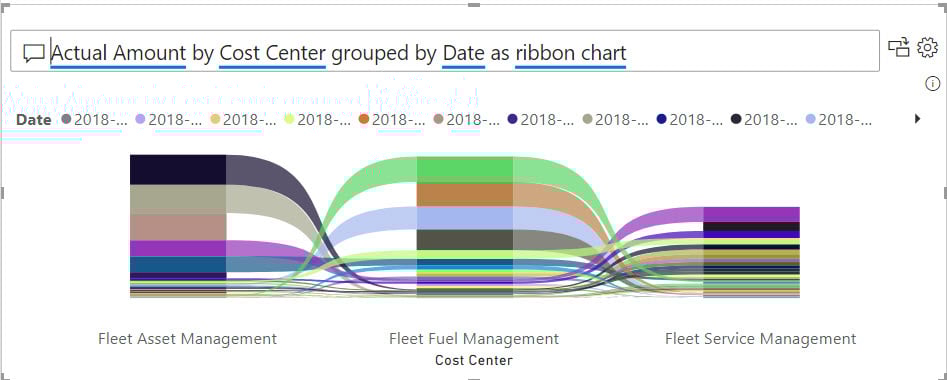
Requesting a specific visual
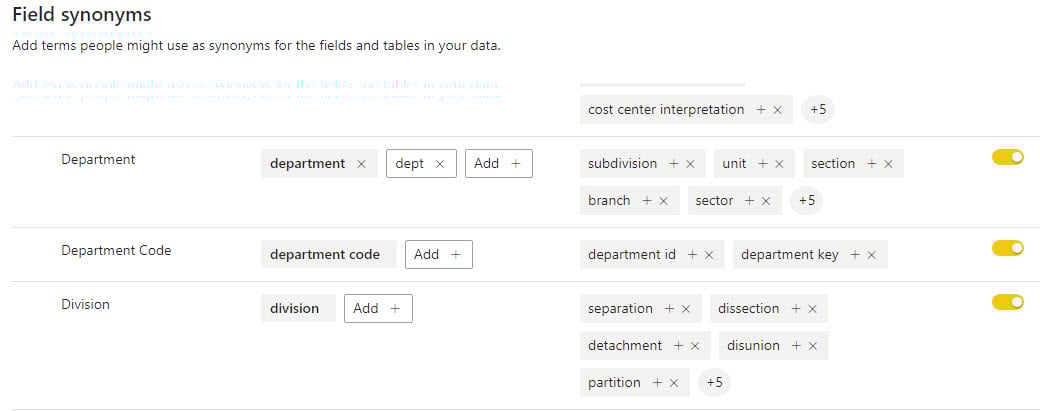
Synonyms
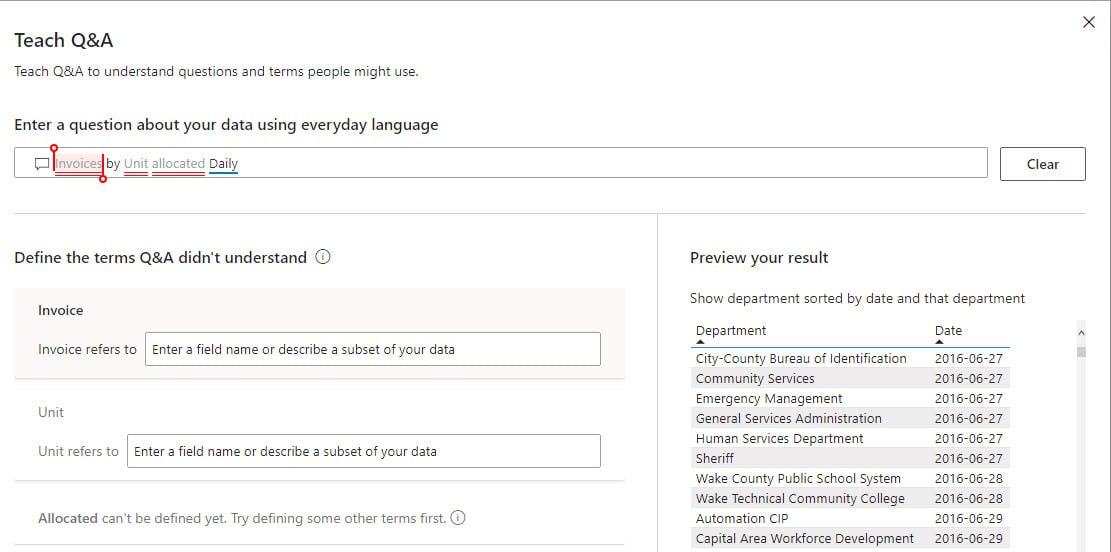
Managing terms with Teach Q&A
Reports in Power BI
Maarten Van den Broeck
Content Developer at DataCamp

