Reports vs. dashboards
Reports in Power BI

Kevin Feasel
CTO, Faregame Inc
Course pre-requisites
- Data Visualization in Power BI
- Intermediate DAX in Power BI
Dashboards versus reports
Dashboard
- Tells us about critical business or operational metrics, often in real time
- Lacks interactivity
- Single-view
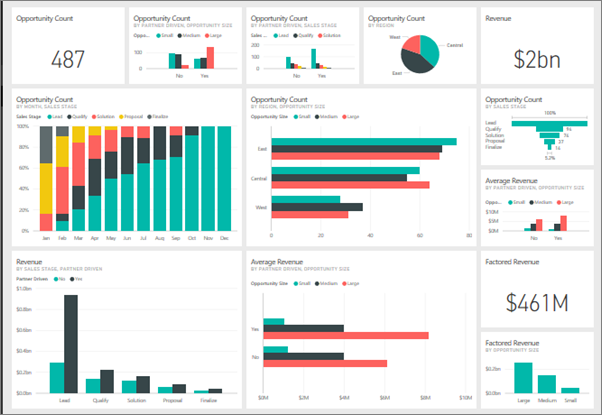
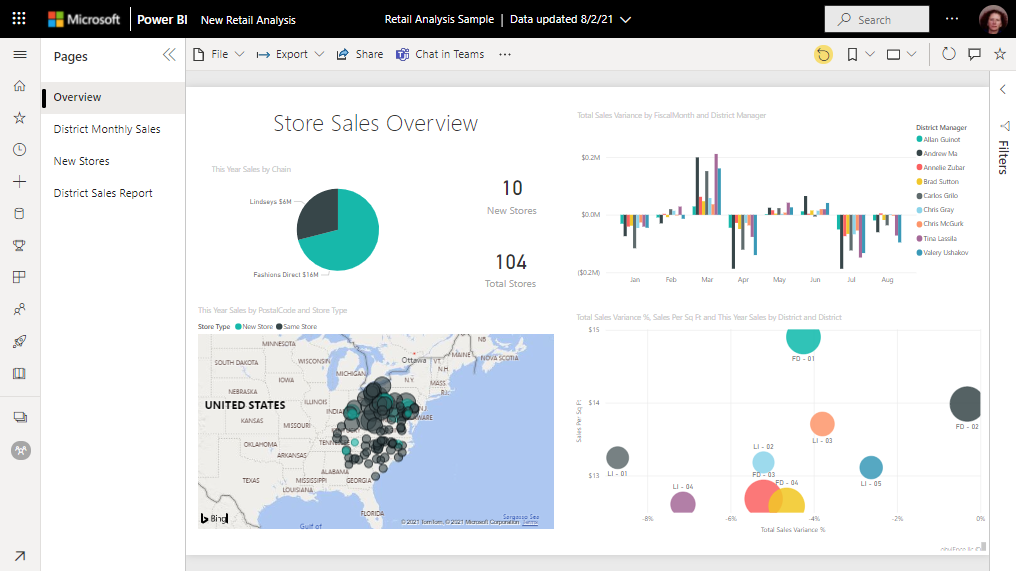
Reports
- Provides an application-like experience for users
- Multiple pages and interactive functionality
- The focus of this course
Choosing between dashboards and reports
Choose a dashboard if...
- You need rapid analysis
- Users have limited engagement opportunities
Choose a report if...
- You need detailed analysis
- Users are primarily on PC and have a keyboard, mouse, and large screen
Paginated reports
- "Pixel-perfect" report intended for the written page
- Created in the Power BI Report Builder
The end goal
- Multiple pages with drillthroughs, bookmarks, and navigation buttons
- Interactive design: animations, highlighting and states
- Question and Answer capabilities
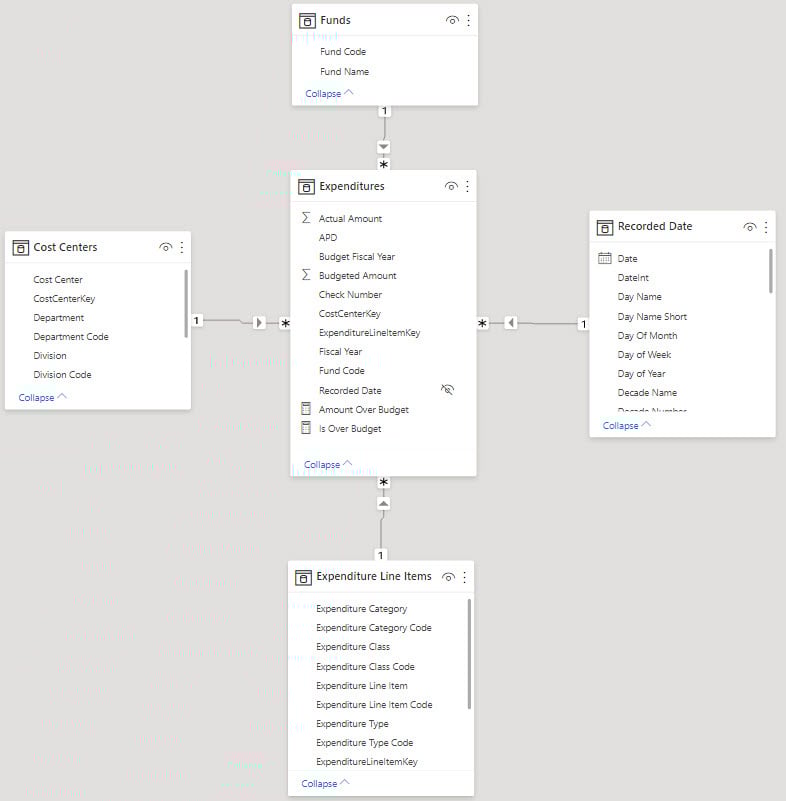
Wake County watchdog data
- Part of Wake County Open Data
- Tracks budgets and expenditures for Wake County, North Carolina
- Includes fiscal years 2017-2019
Let's practice!
Reports in Power BI
 Preparing Video For Download...