Granularity, measures, and hierarchies
Intermediate Data Modeling in Power BI

Maarten Van den Broeck
Content Developer at DataCamp
Understanding granularity
- Granularity: at what level is the data stored with respect to dimensions?
- The minimum level of detail to query on
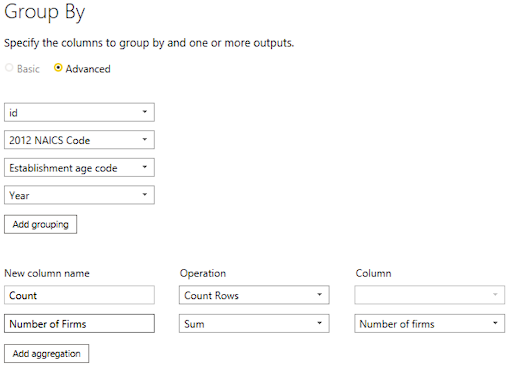
- Define granularity with "by" statements:
- E.g. by customer, by product, by day
- E.g. by id, by NAICS$^1$ code, by establishment age, by year

1 NAICS: North American Industry Classification System
Handling granularity in Power BI
- Getting to a finer grain: not advisable!
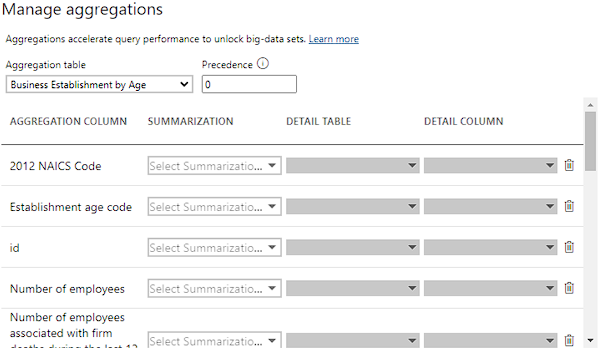
- Getting to a coarser grain: aggregations and grouping
- Better query performance with fewer rows
- Smaller cache sizes and faster refresh time


Measures
- Fields or combinations of fields which can be aggregated or calculated
- Comes directly from fact data
- New measures can be calculated as well

Creating measures
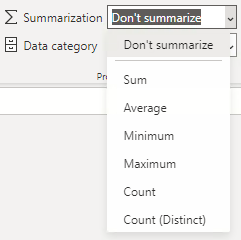
- Numeric values are automatically converted to measures and aggregated by the sum

- Create your own measures in Power BI using DAX
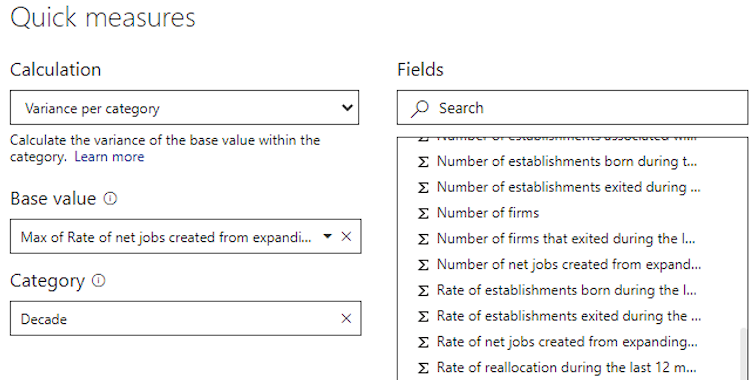
- Create specific types of calculations using a dialog: Quick measures

- Great for learning how to create moderately complex measures
Hierarchies
Allow users to drill down into data dimensions
Natural hierarchies
- Levels of the hierarchy exist "in the real world"
- Year -> Month -> Day
Artificial hierarchies
- Levels are created for querying purposes
- Intake year -> Favorite color -> Favorite sport
Let's practice!
Intermediate Data Modeling in Power BI

