Working with relationships

Intermediate Data Modeling in Power BI

Sara Billen

Curriculum Manager at DataCamp

Cross filtering

Cross-filtering: Selecting a value in one visual narrows down visible data in other visuals
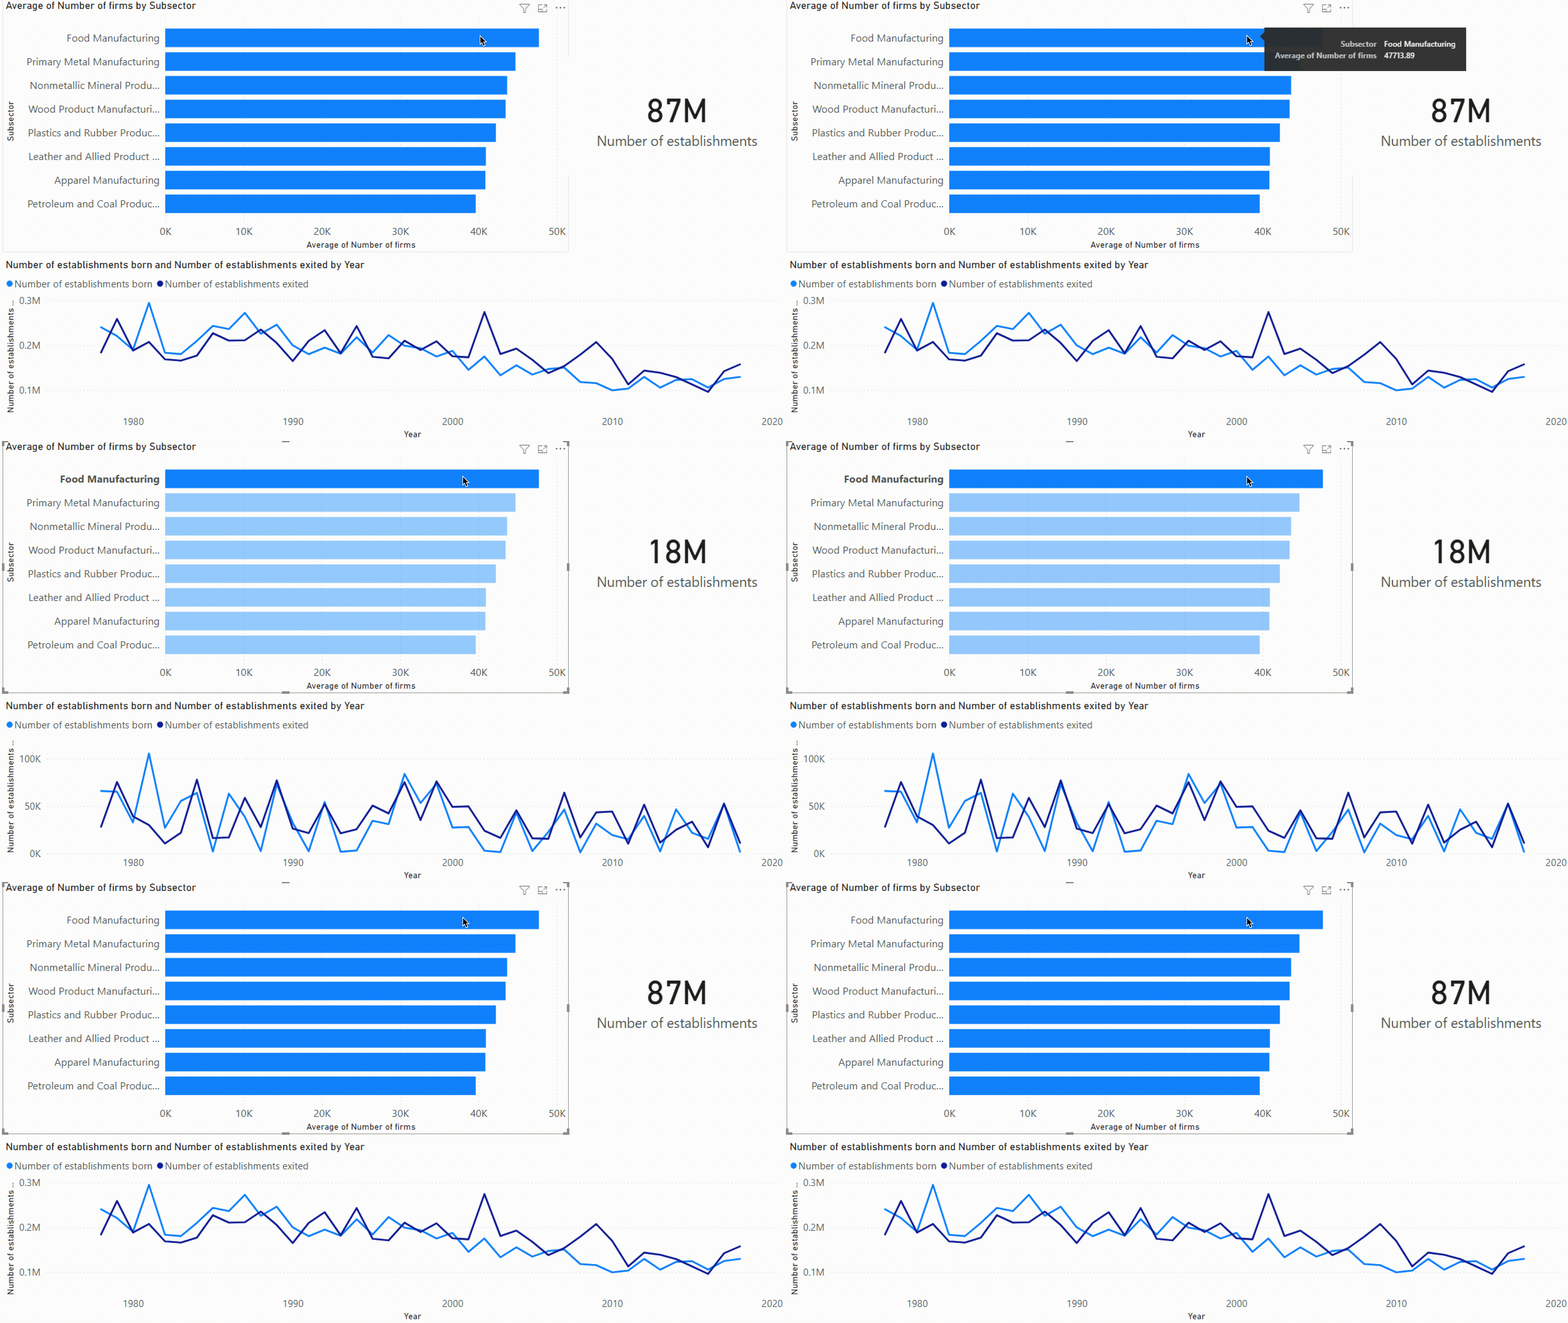
Gif showing how one visual is filtered based on a selection in the other visual.

Intermediate Data Modeling in Power BI

Filter direction

  • All relationships have a cross filter direction
  • Determines the direction that filters will propagate
  • Example:
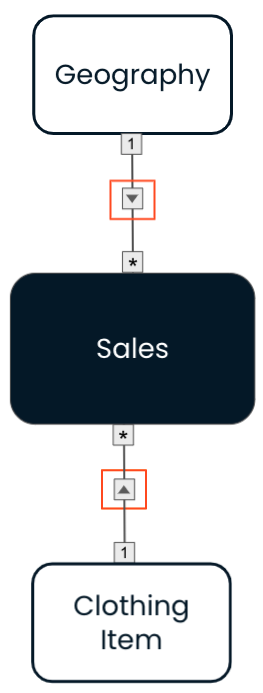
    • Geography -> Sales
    • Clothing Item -> Sales
  • From Dimension to Fact

Data model with single direction cross filters going from the two dimensions to the fact.

Intermediate Data Modeling in Power BI

Filter direction

Data model: Data model with single direction cross filters going from the two dimensions to the fact.

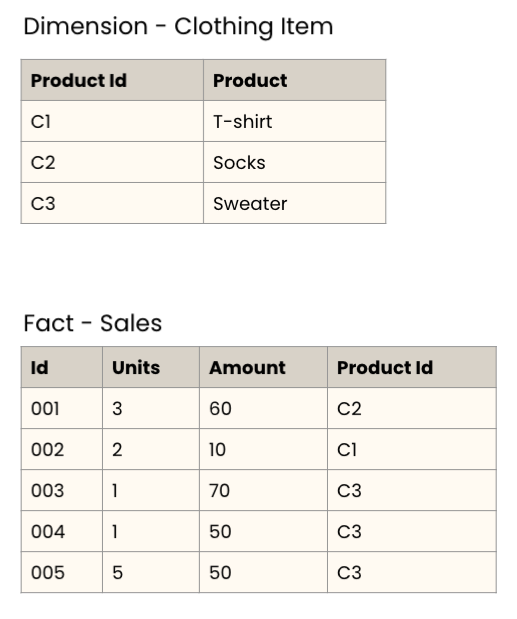
Detailed view of the fact and Clothing Item Dimension tables.

Intermediate Data Modeling in Power BI

Filter direction

Data model: Data model with single direction cross filters going from the two dimensions to the fact.

Detailed view of the fact and Clothing Item Dimension tables.

Intermediate Data Modeling in Power BI

Filter direction options

Single direction

Filter in one direction

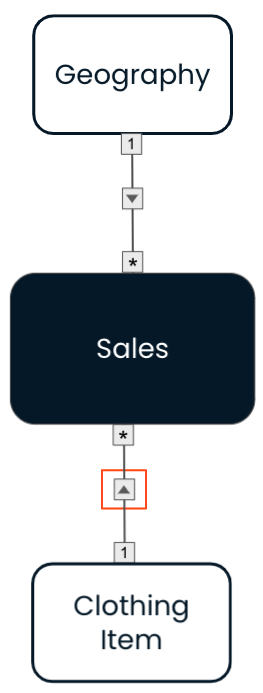
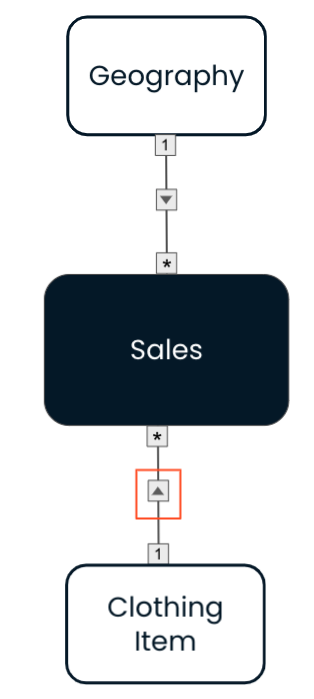
Screenshot of the single direction cross filter symbol.

Bi-directional

Filter in both directions

Screenshot of the bi-directional cross filter symbol.

Intermediate Data Modeling in Power BI

Bi-directional filtering: use case

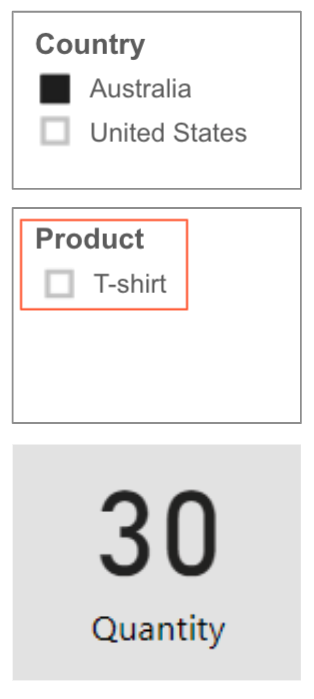
Show only relevant slicer entries

Data model: Data model with single direction cross filters going from the two dimensions to the fact.
$$

Report view:

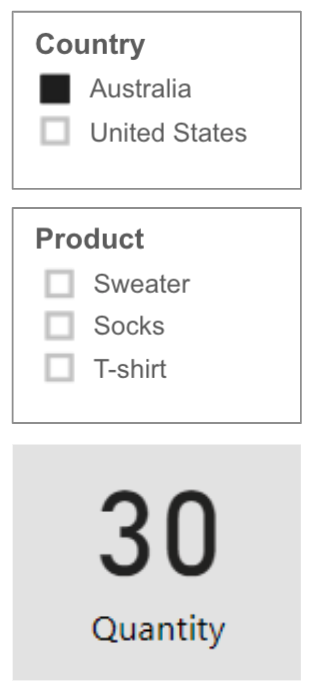
Report view showing a Country slicer, a Product slicer, and a card showing the quantity. The Product slicer shows all possible products.

Intermediate Data Modeling in Power BI

Bi-directional filtering: use case

Only sweaters were sold in Australia
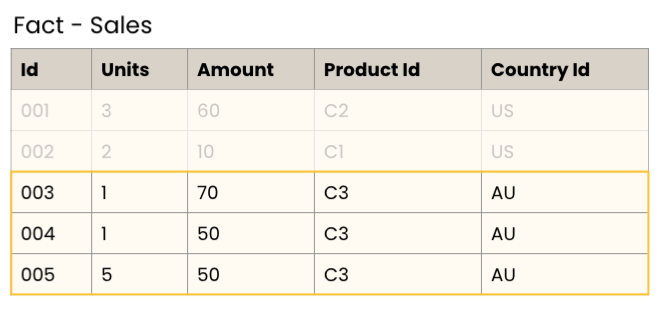
Detailed table view of fact sales.

*Product Id: C3 = Sweater, Country Id: AU = Australia

Intermediate Data Modeling in Power BI

Bi-directional filtering: use case

Show only relevant slicer entries

Data model: Data model with a single direction cross filter going from the Geography dimension to the fact and a bi-directional filter between the Clothing Item dimension and the fact.
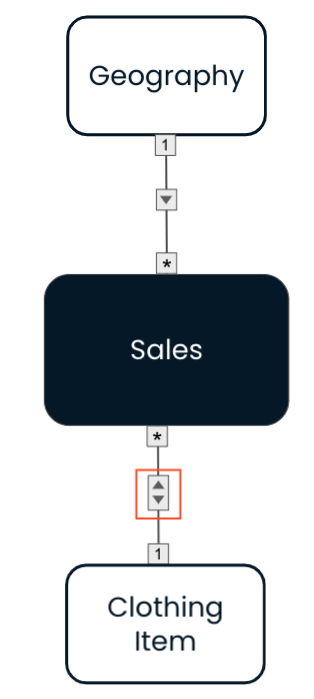
$$

Report view: Report view showing a Country slicer, a Product slicer, and a card showing the quantity. The Product slicer only show the relevant product options (for Australia).

Intermediate Data Modeling in Power BI

Bi-directional filtering and paths

Bi-directional filters cannot allow for two separate paths between two tables
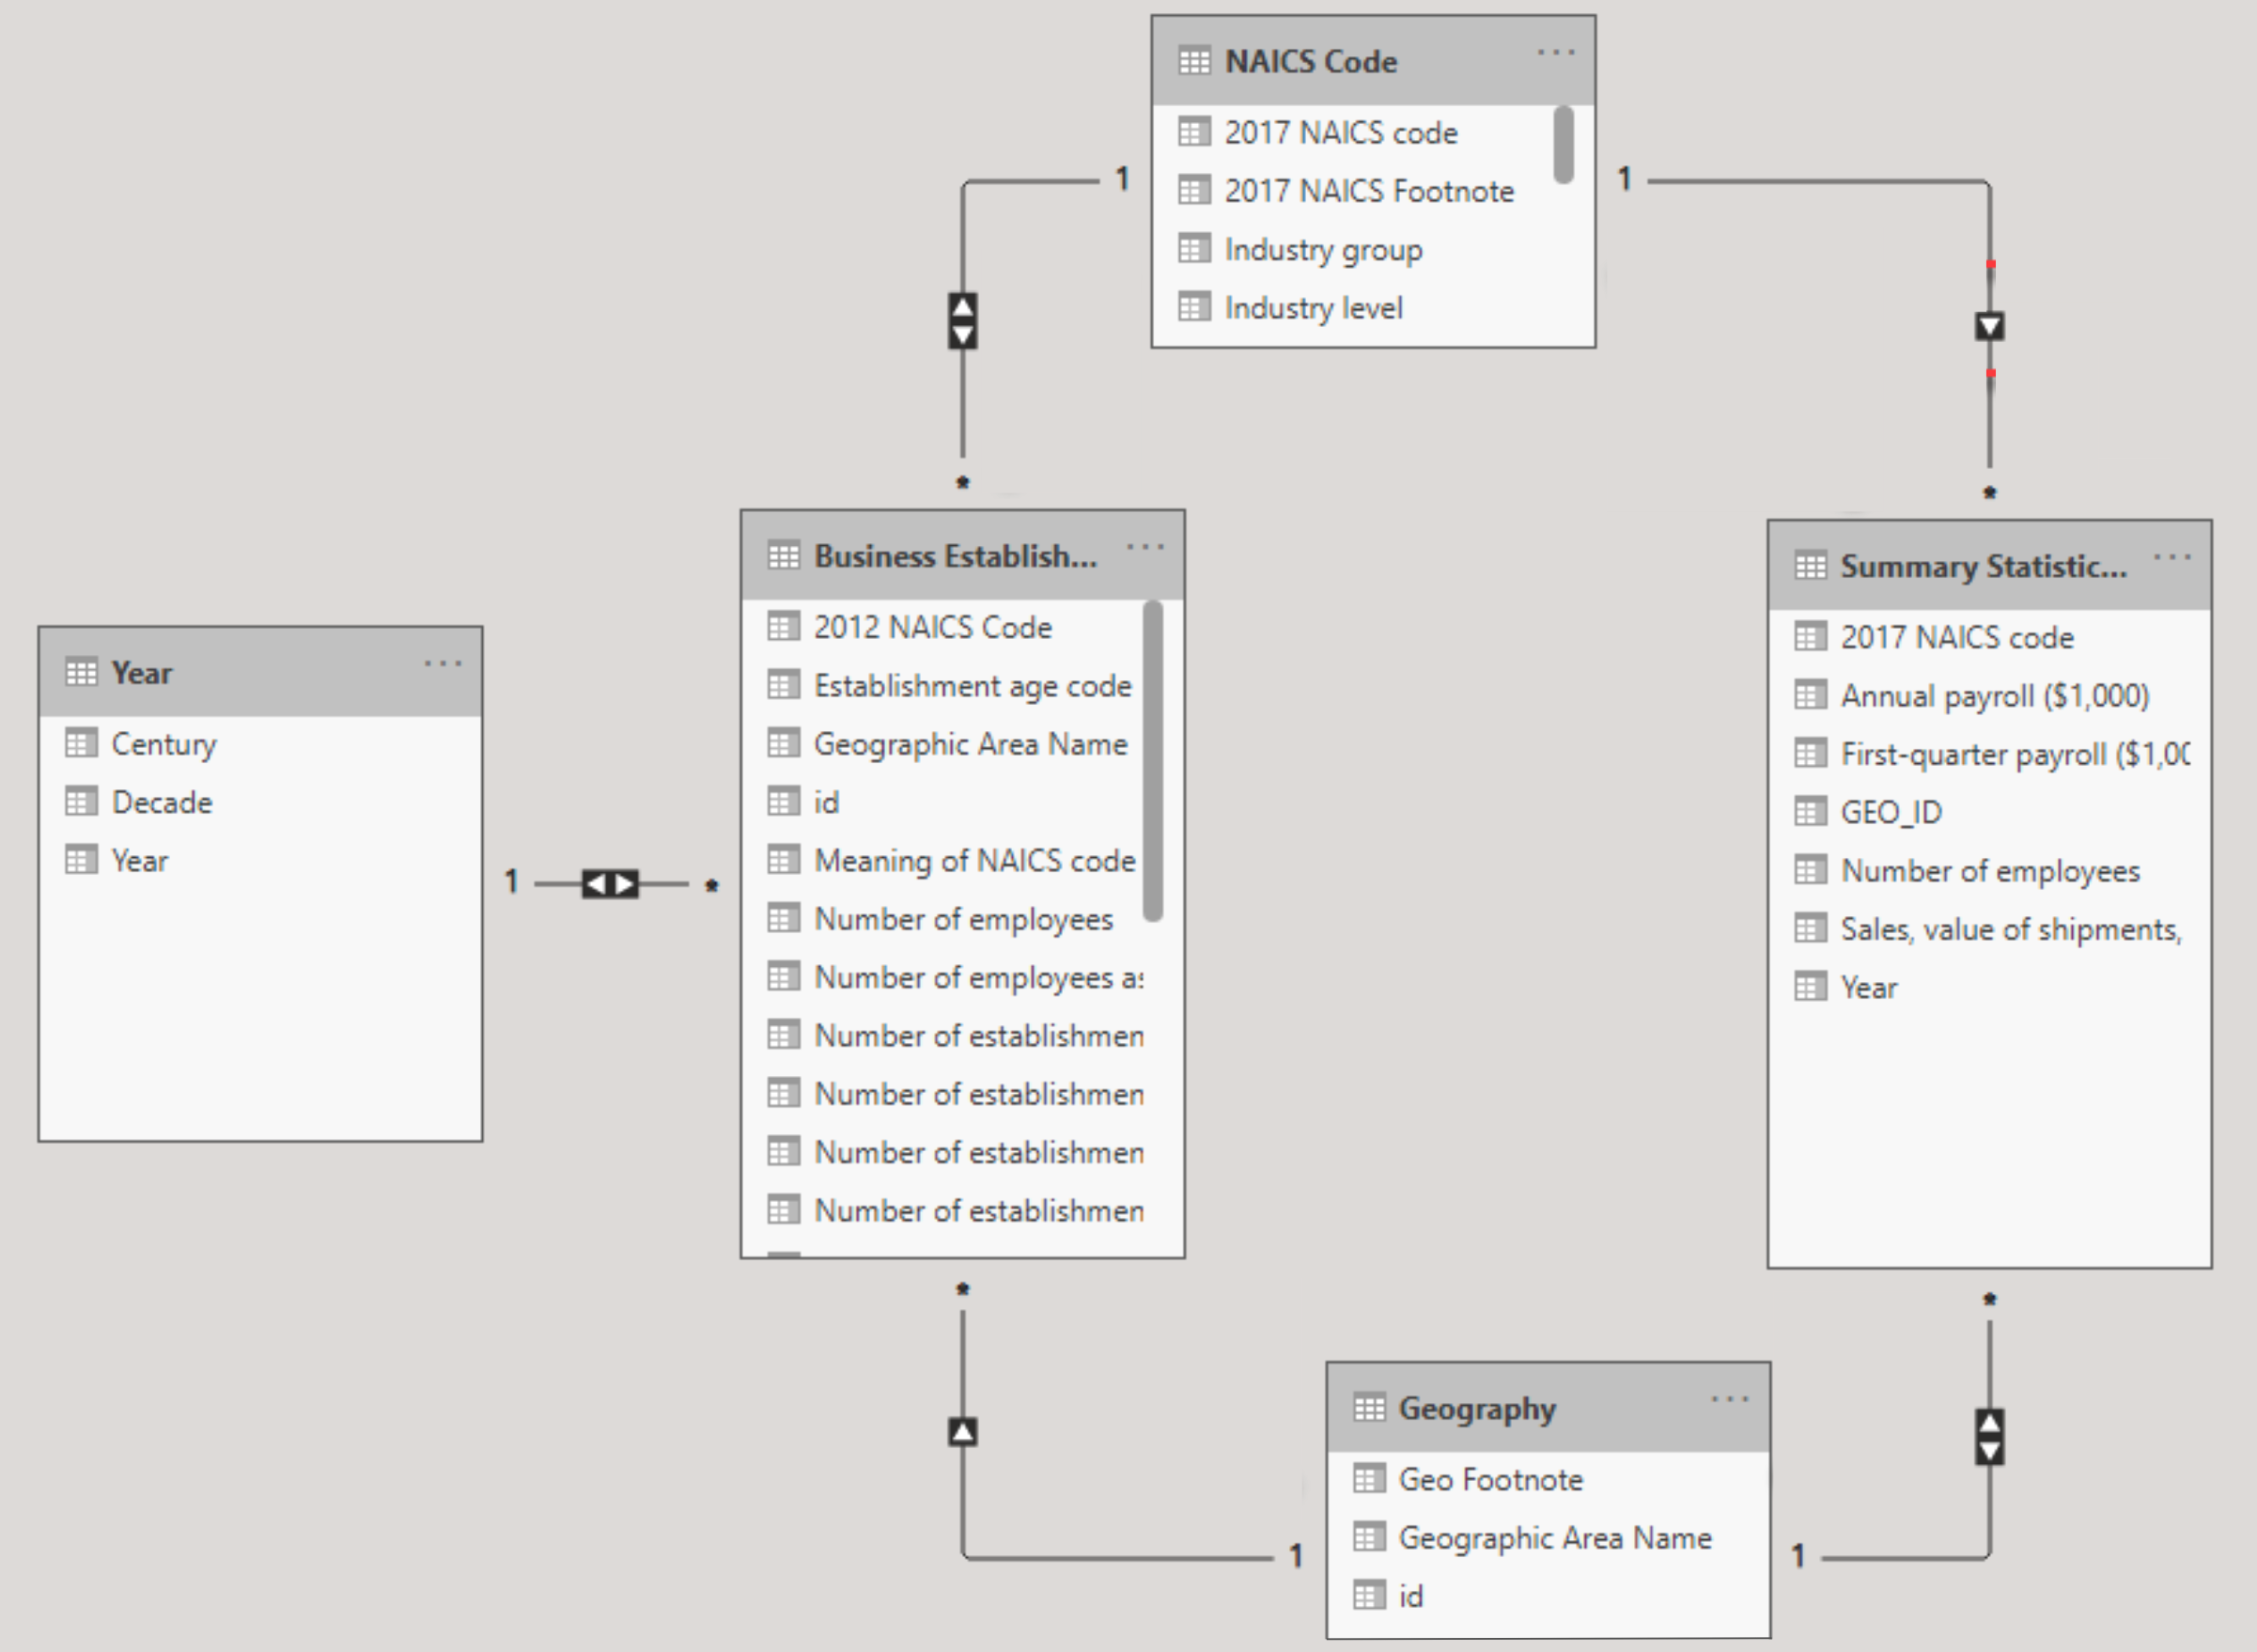
Data model in Power BI.

Intermediate Data Modeling in Power BI

Bi-directional filtering and paths

Bi-directional filters cannot allow for two separate paths between two tables
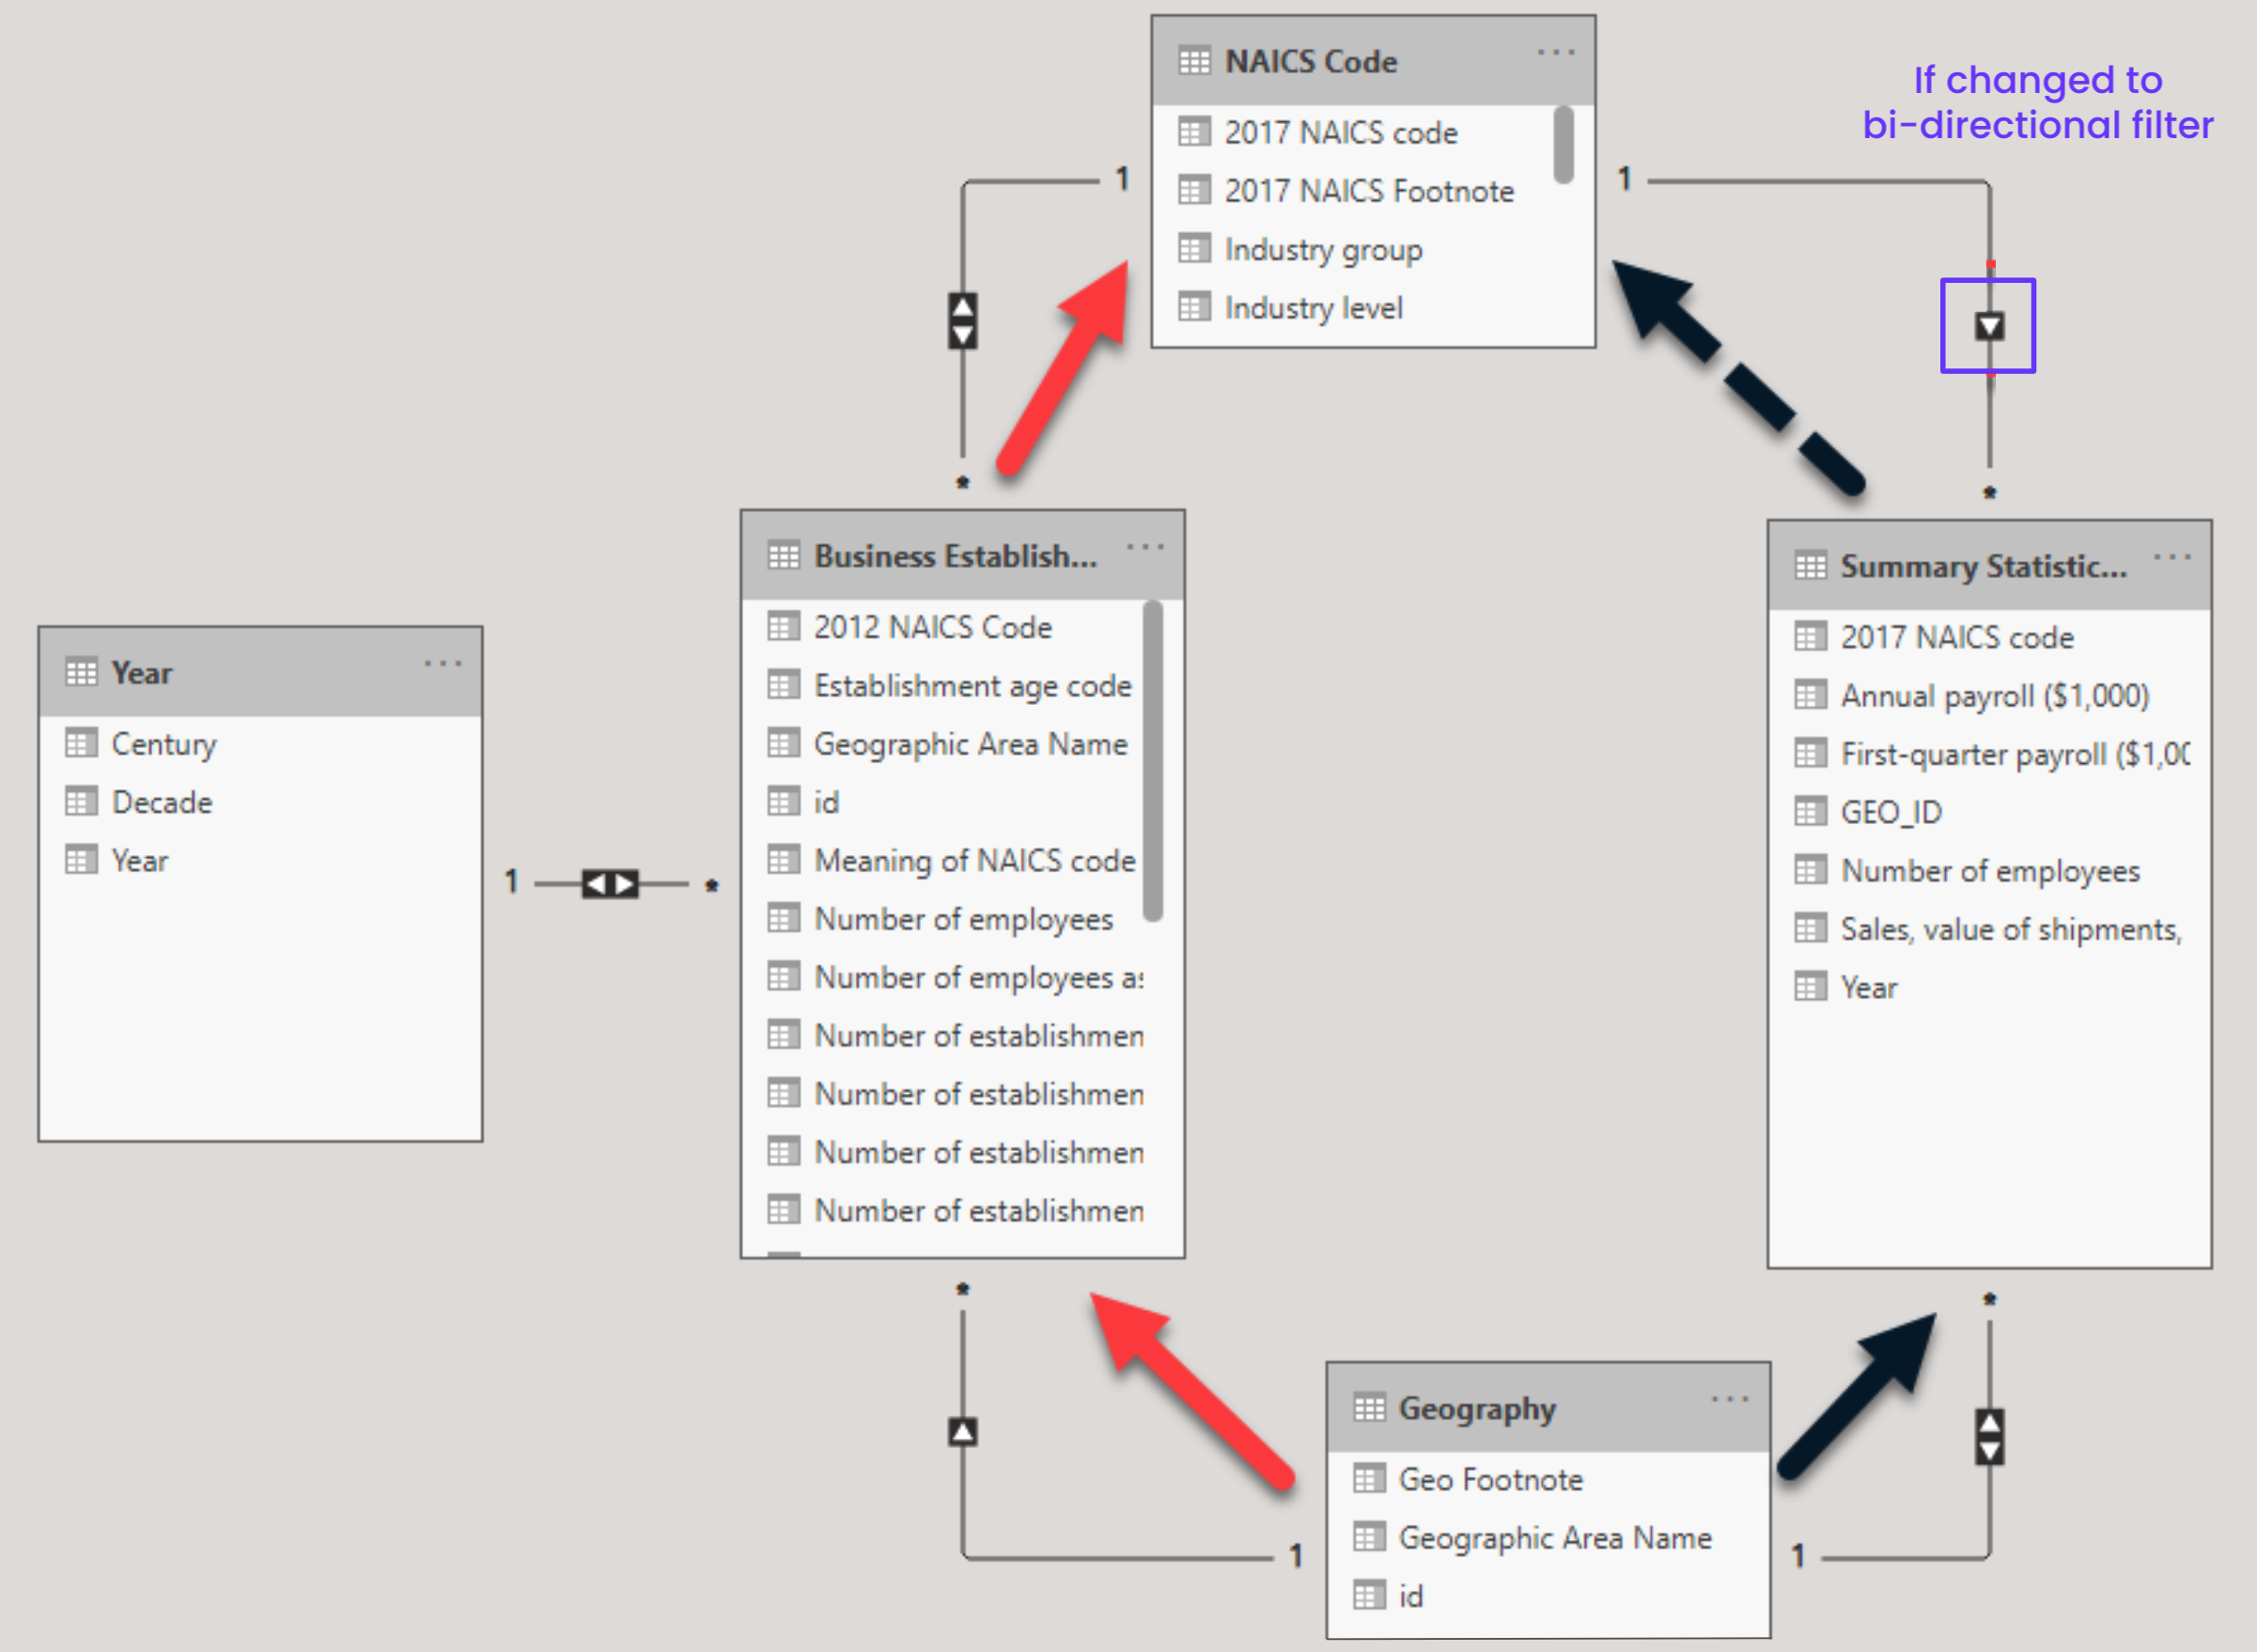
Data model in Power BI showing two seperate paths between two tables.

Intermediate Data Modeling in Power BI

Role-playing dimensions

  • Sometimes we need to create multiple relationships between tables

Two tables with the date fields highlighted.

Intermediate Data Modeling in Power BI

Role-playing dimensions

  • Kimball model
  • Role-playing dimension:
    • Dimension that can filter related facts differently
  • Typically implemented as views of the Date dimension
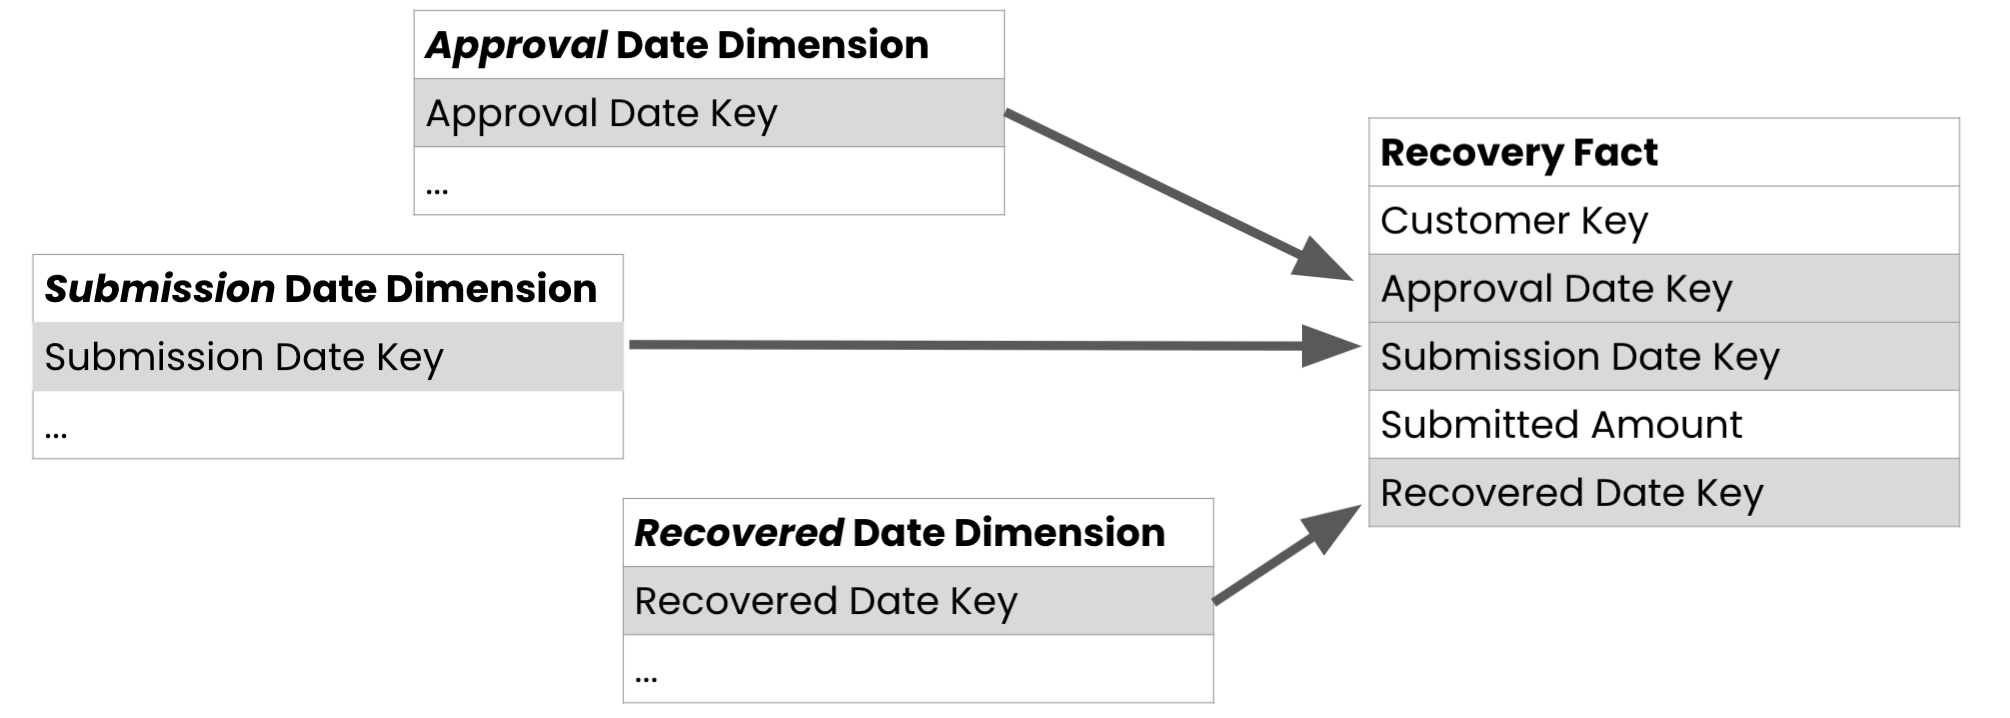
Three dimension tables with their respective date keys, all connected to one fact table.

Intermediate Data Modeling in Power BI

Role-playing dimensions in Power BI

  • Create multiple relationships on a dimension, but only one is active

A date dimension with one active and two inactive relationships to the fact table.

  • Use USERELATIONSHIP() in DAX to specify which relationship to use:
Measure Name = CALCULATE(<Measurement function>,
                         USERELATIONSHIP(<Dimension Key Column>, <Fact Key Column>)
Intermediate Data Modeling in Power BI

Let's practice!

Intermediate Data Modeling in Power BI

Preparing Video For Download...