EDA with categorical variables
Exploratory Data Analysis in Power BI

Maarten Van den Broeck
Content Developer at DataCamp
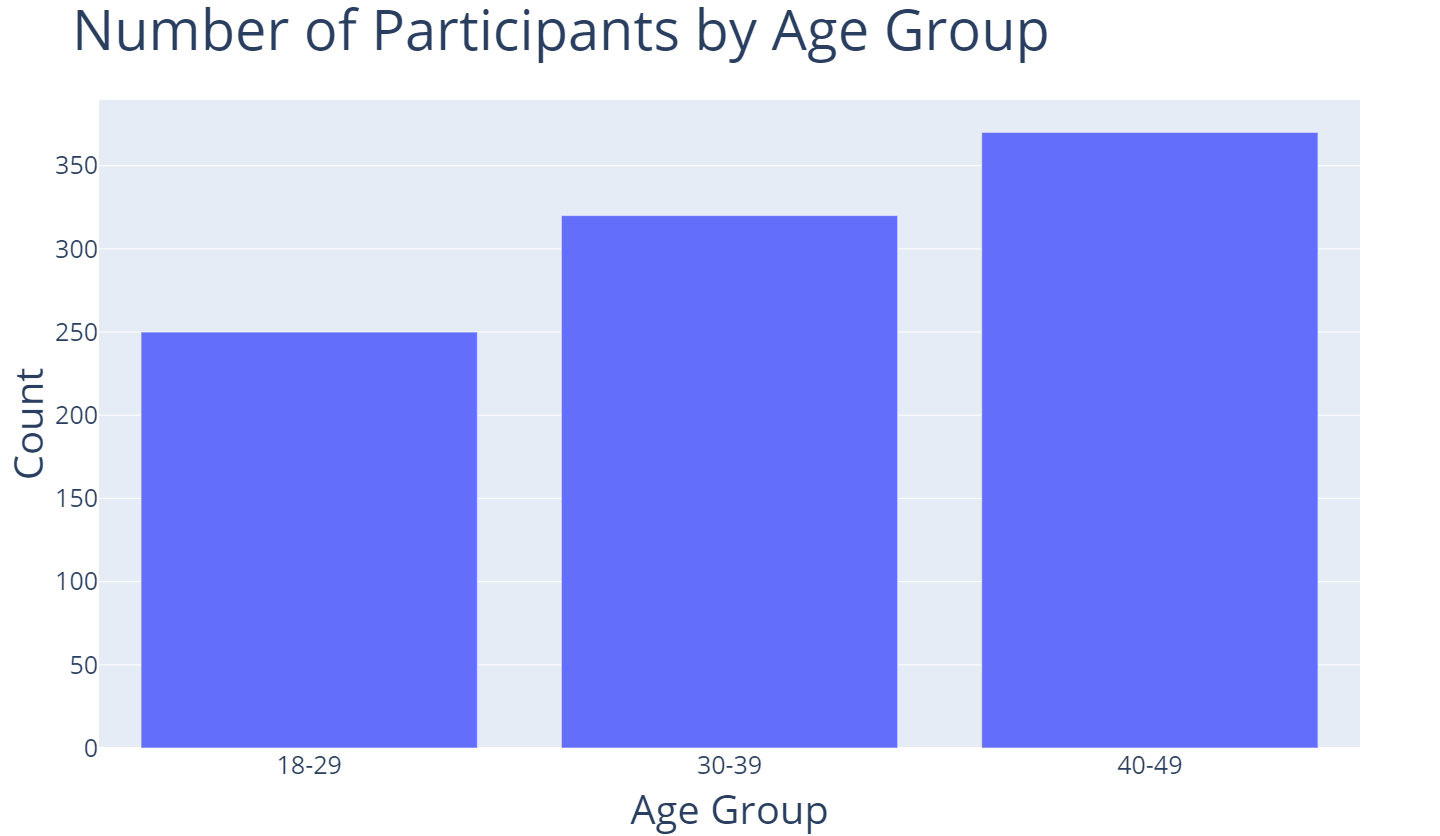
Categorical variables and frequency
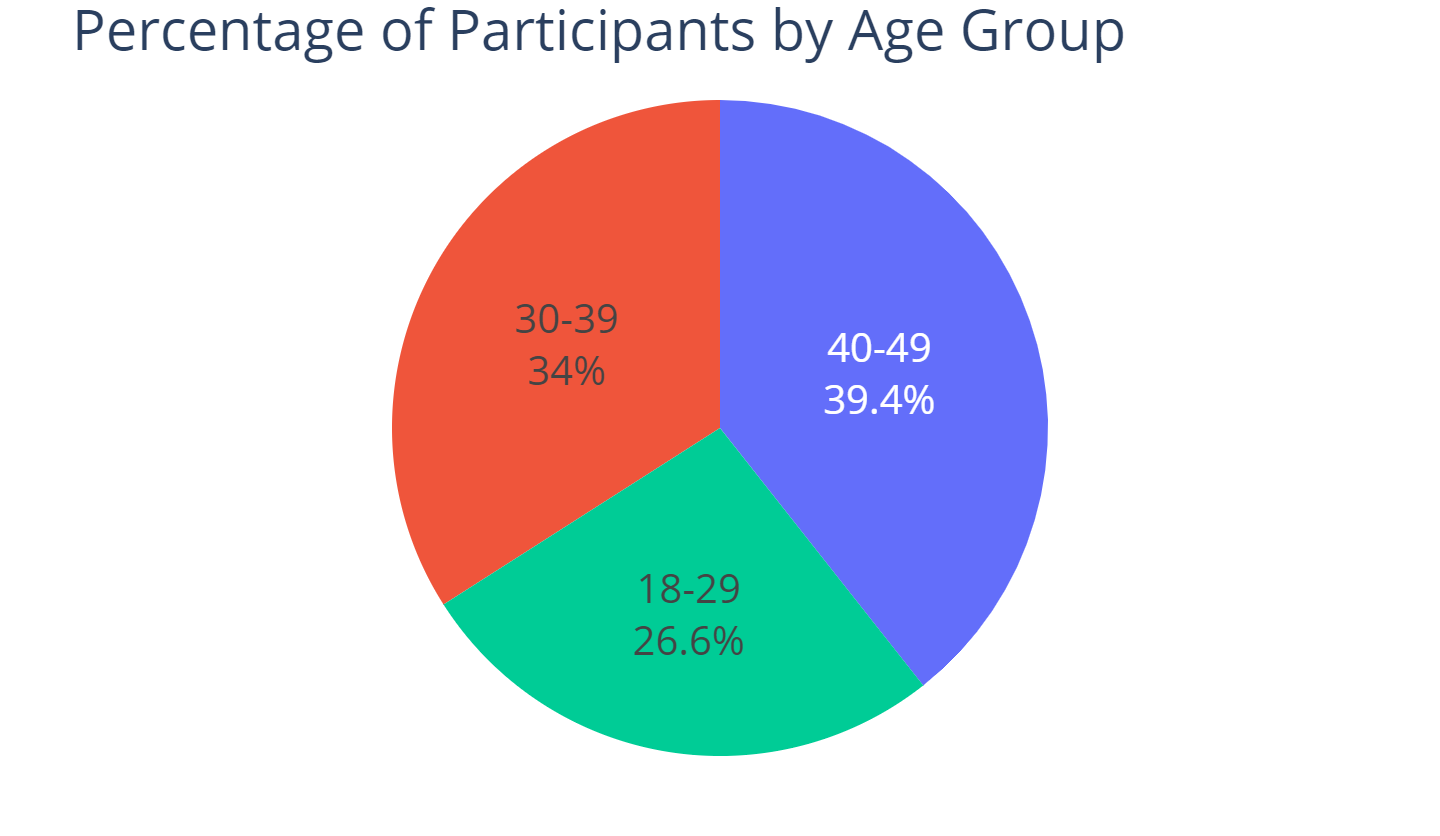
Categorical variables and percentages
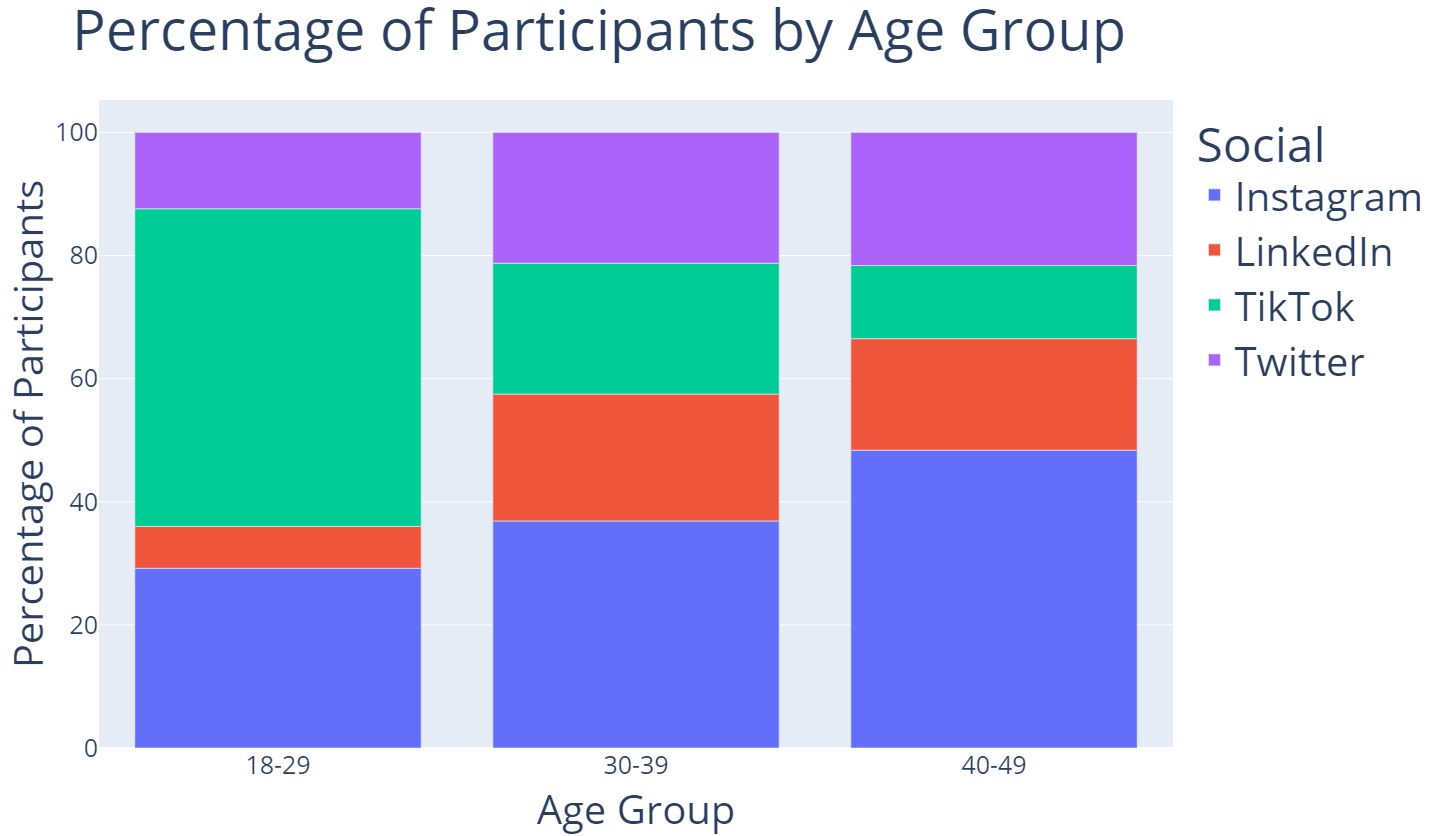
Proportions across multiple categorical variables
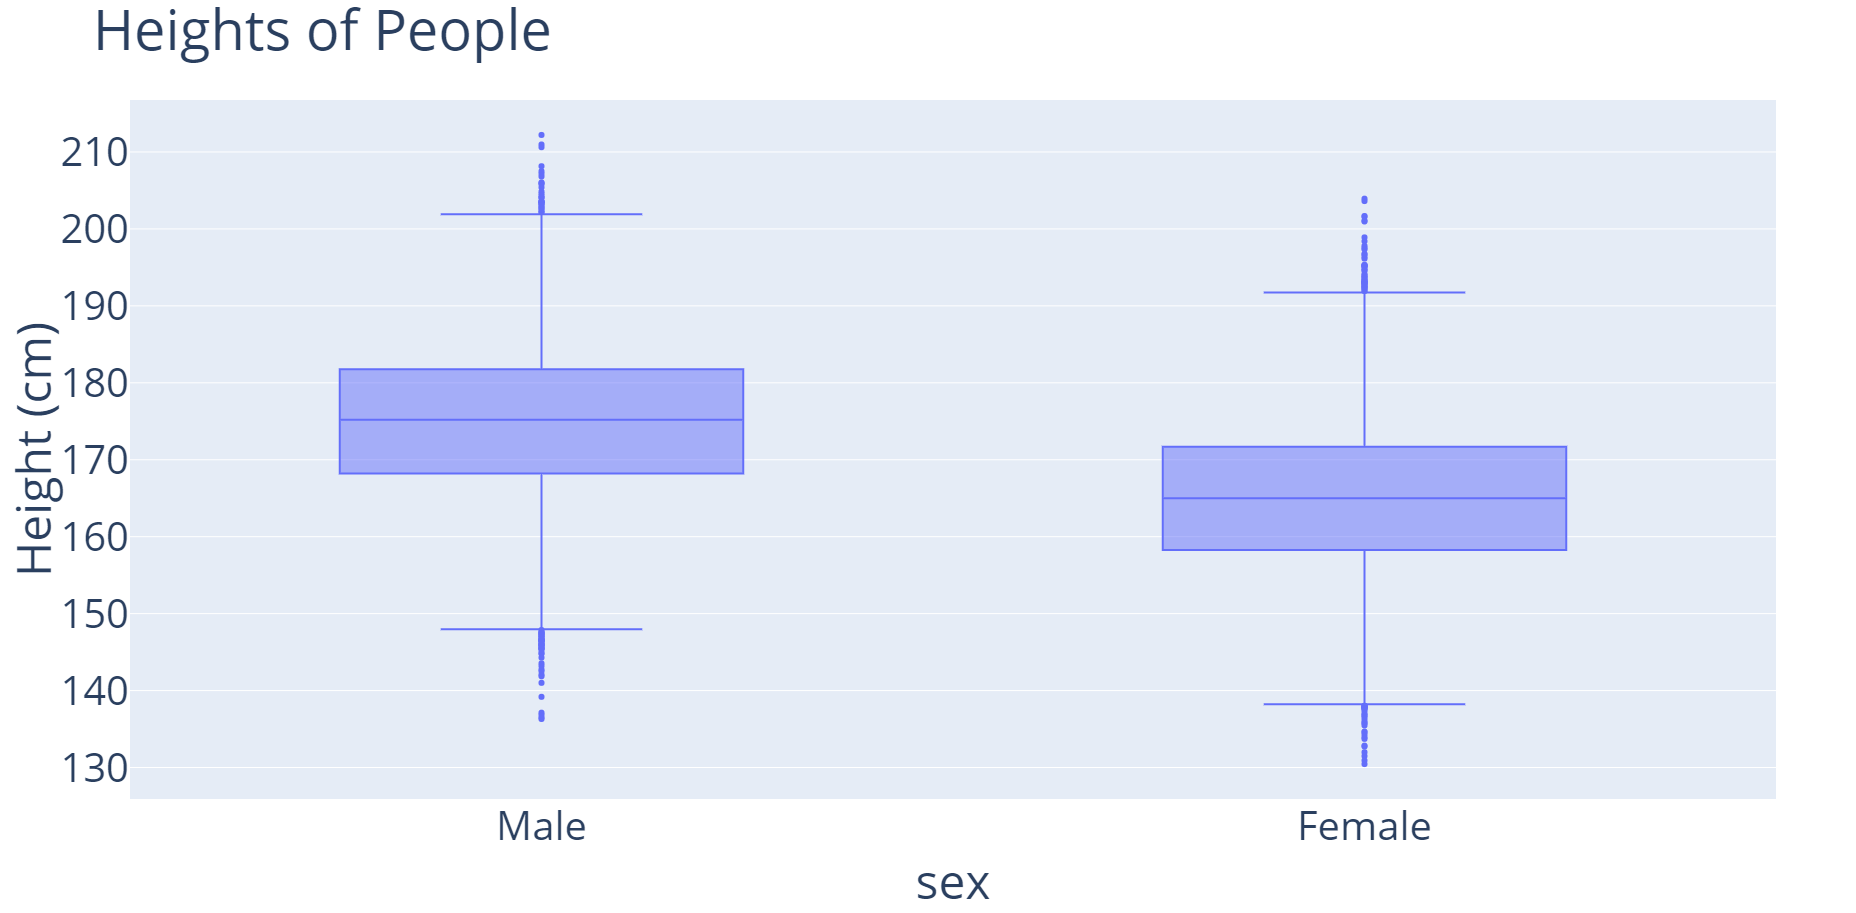
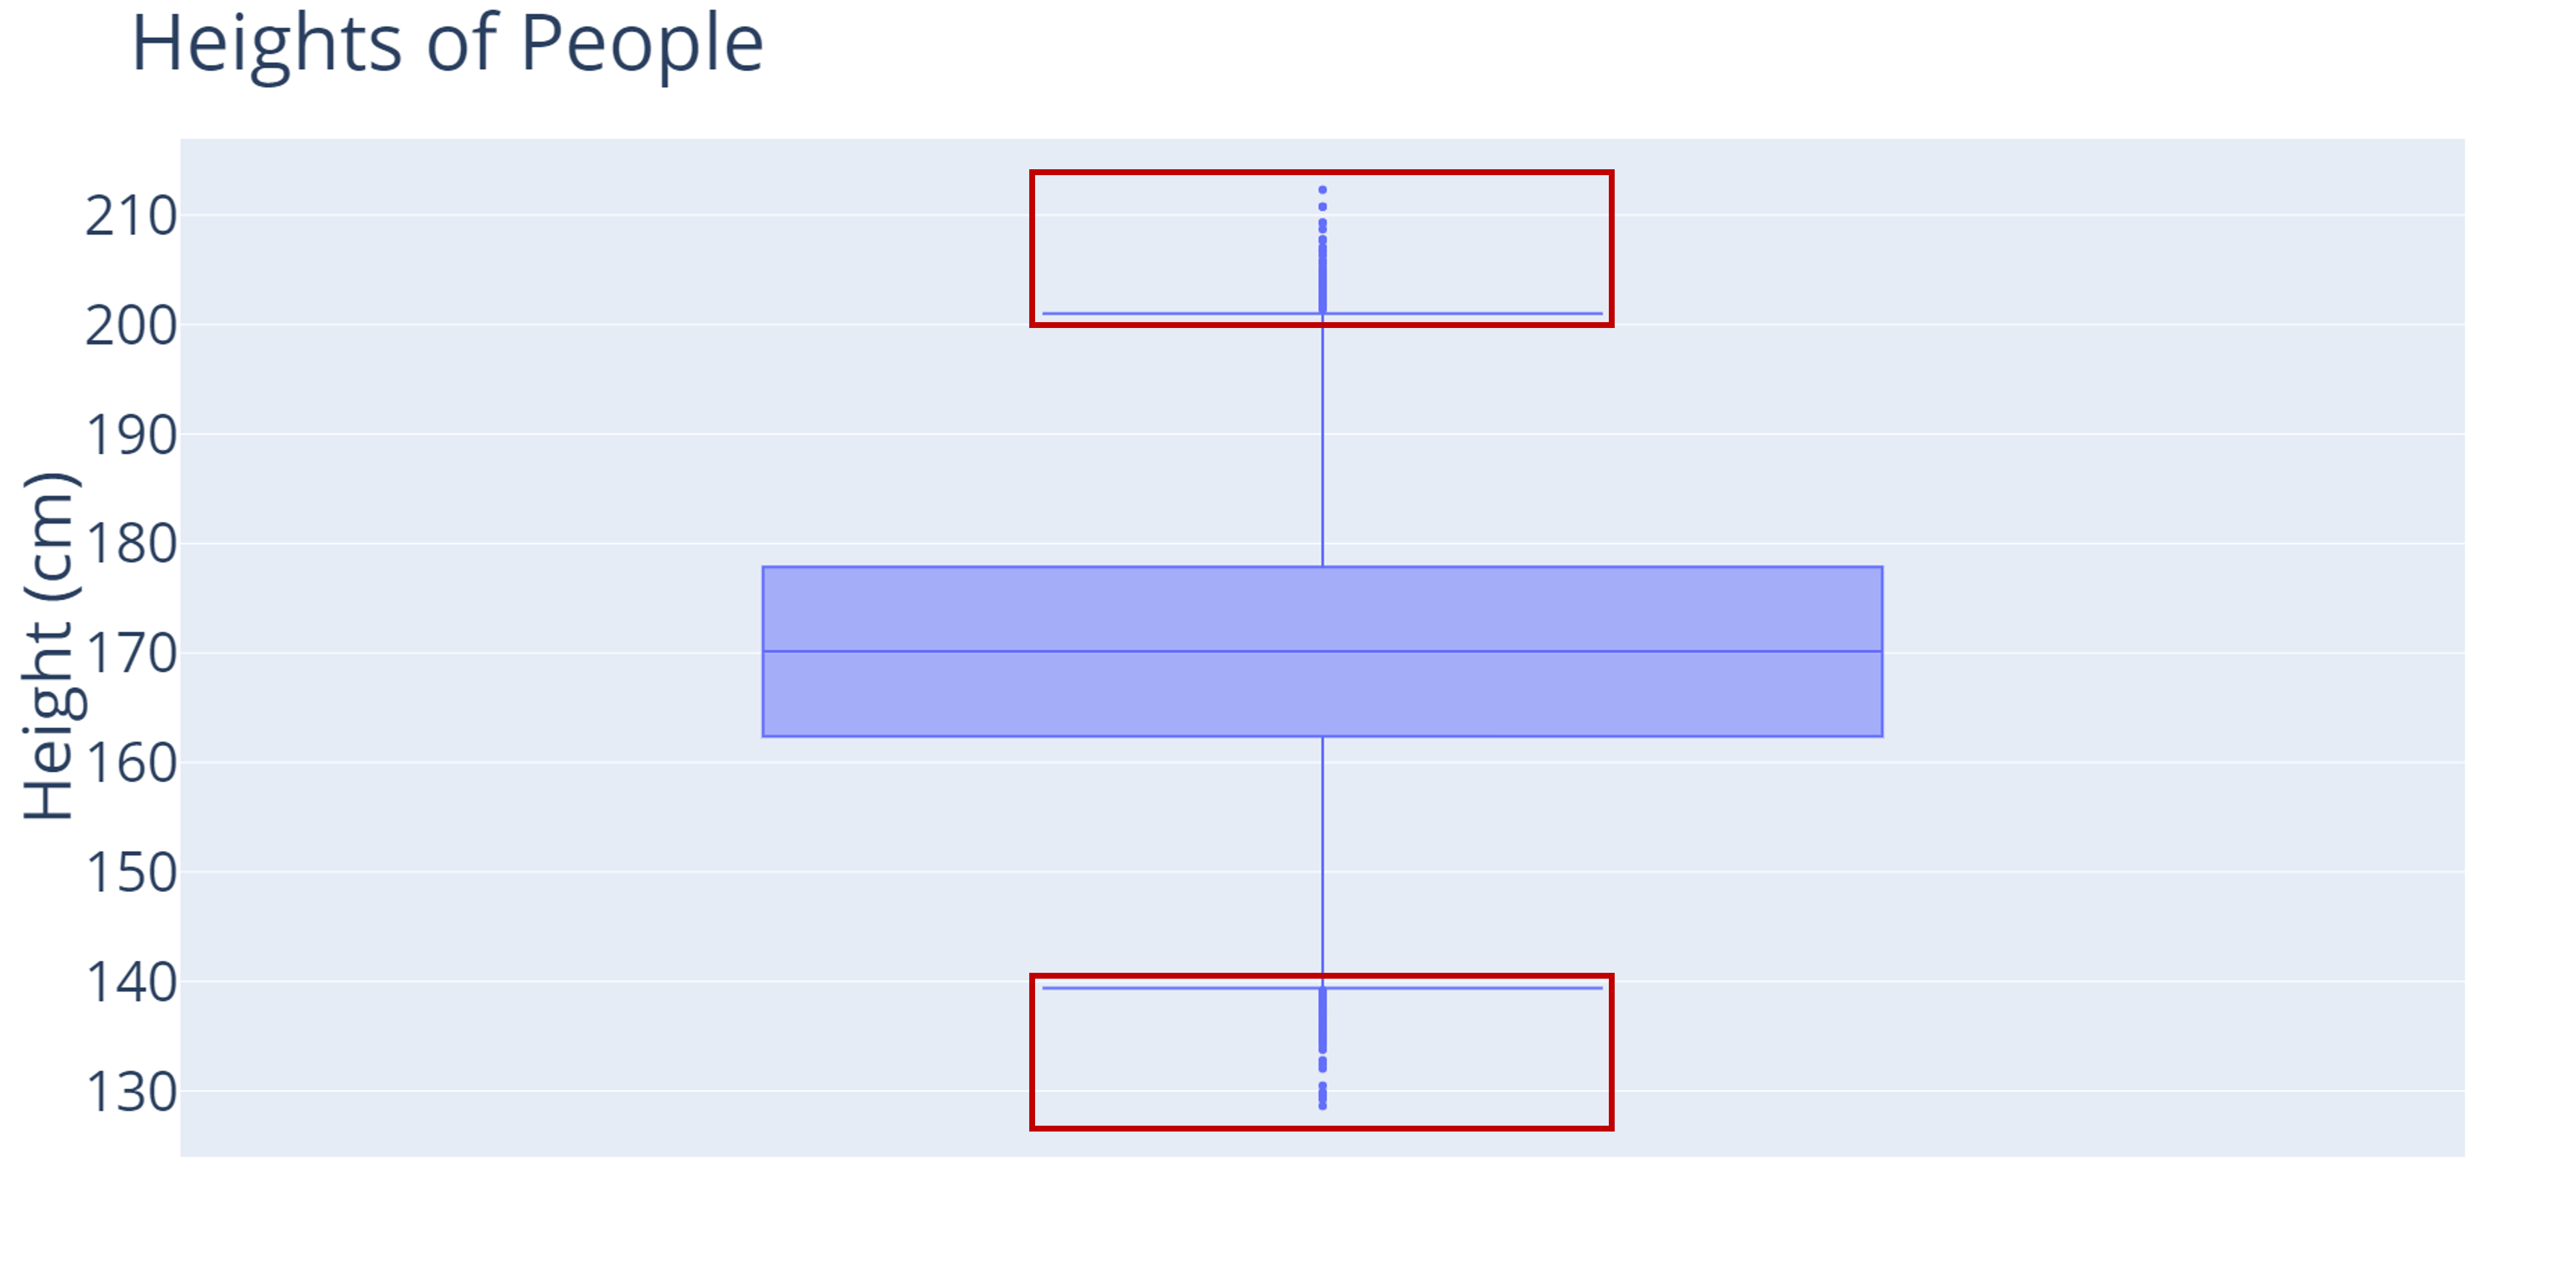
What are boxplots?
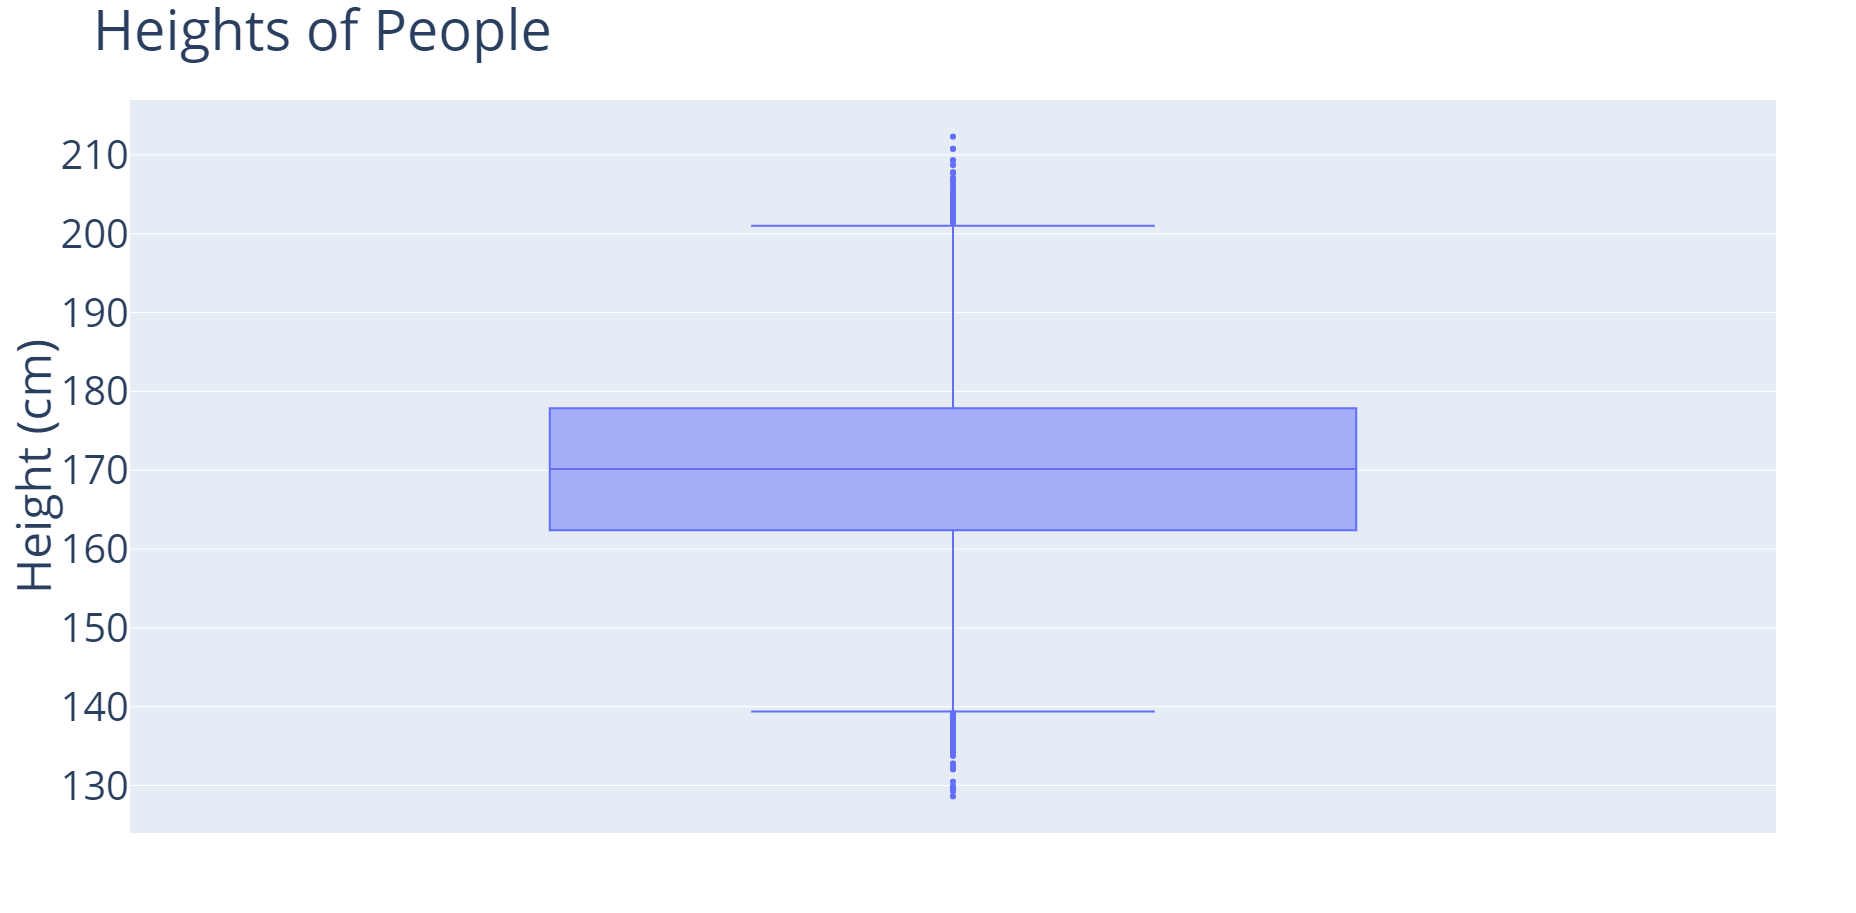
What are boxplots?
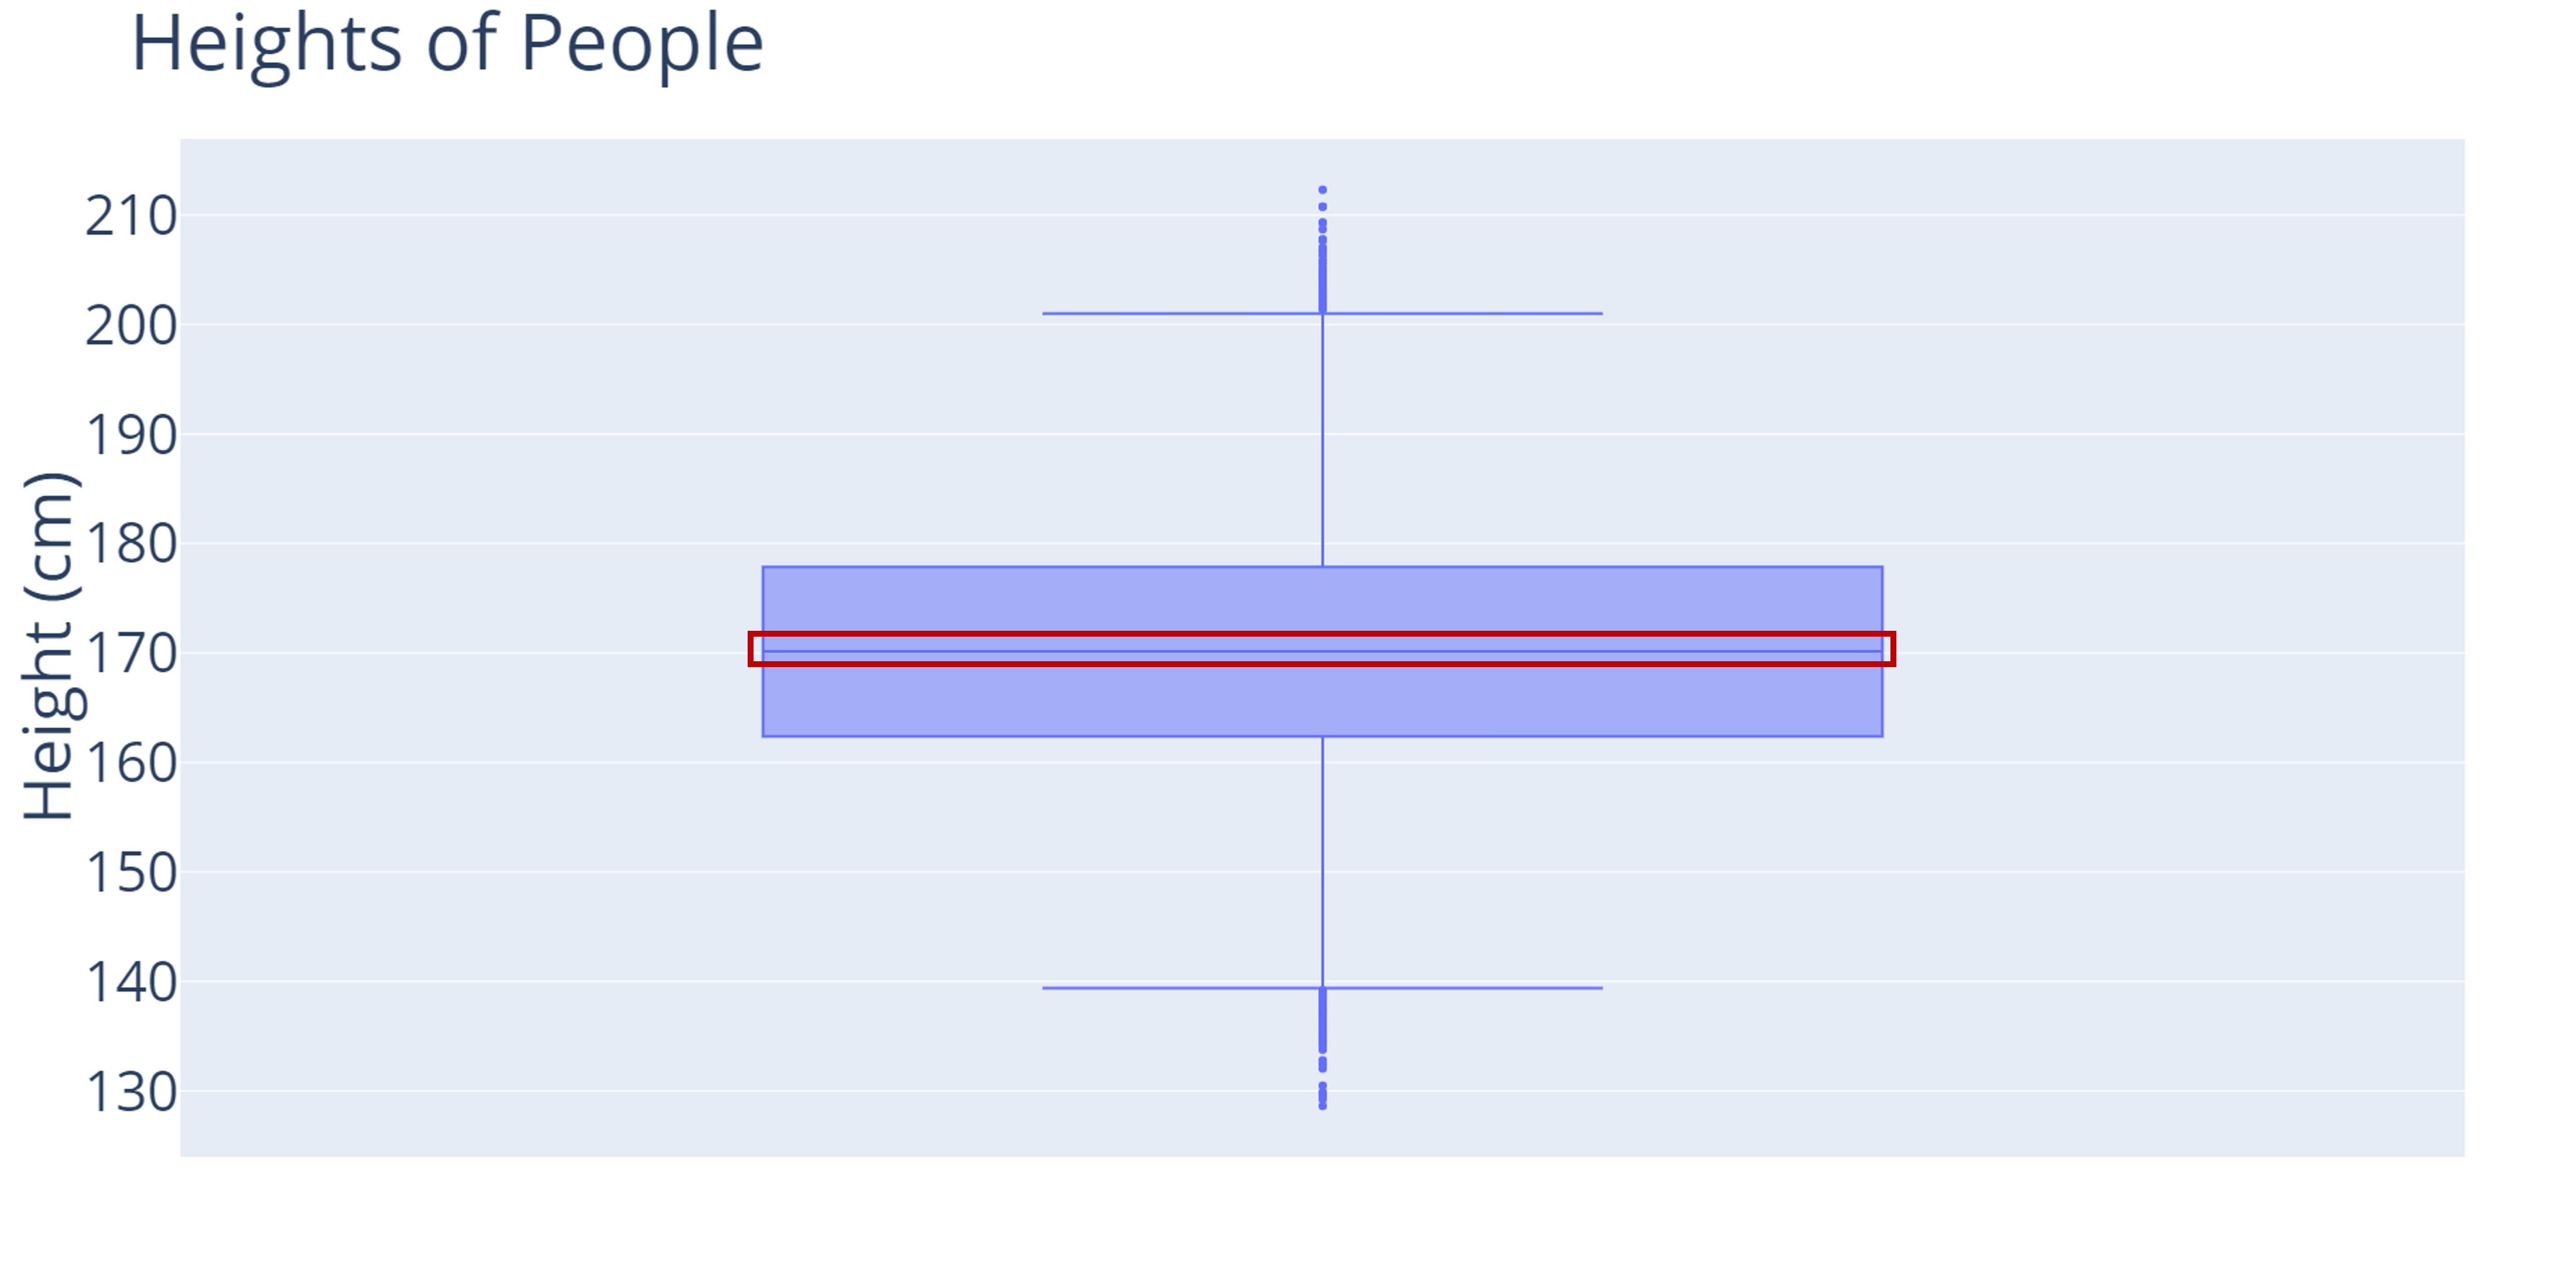
What are boxplots?
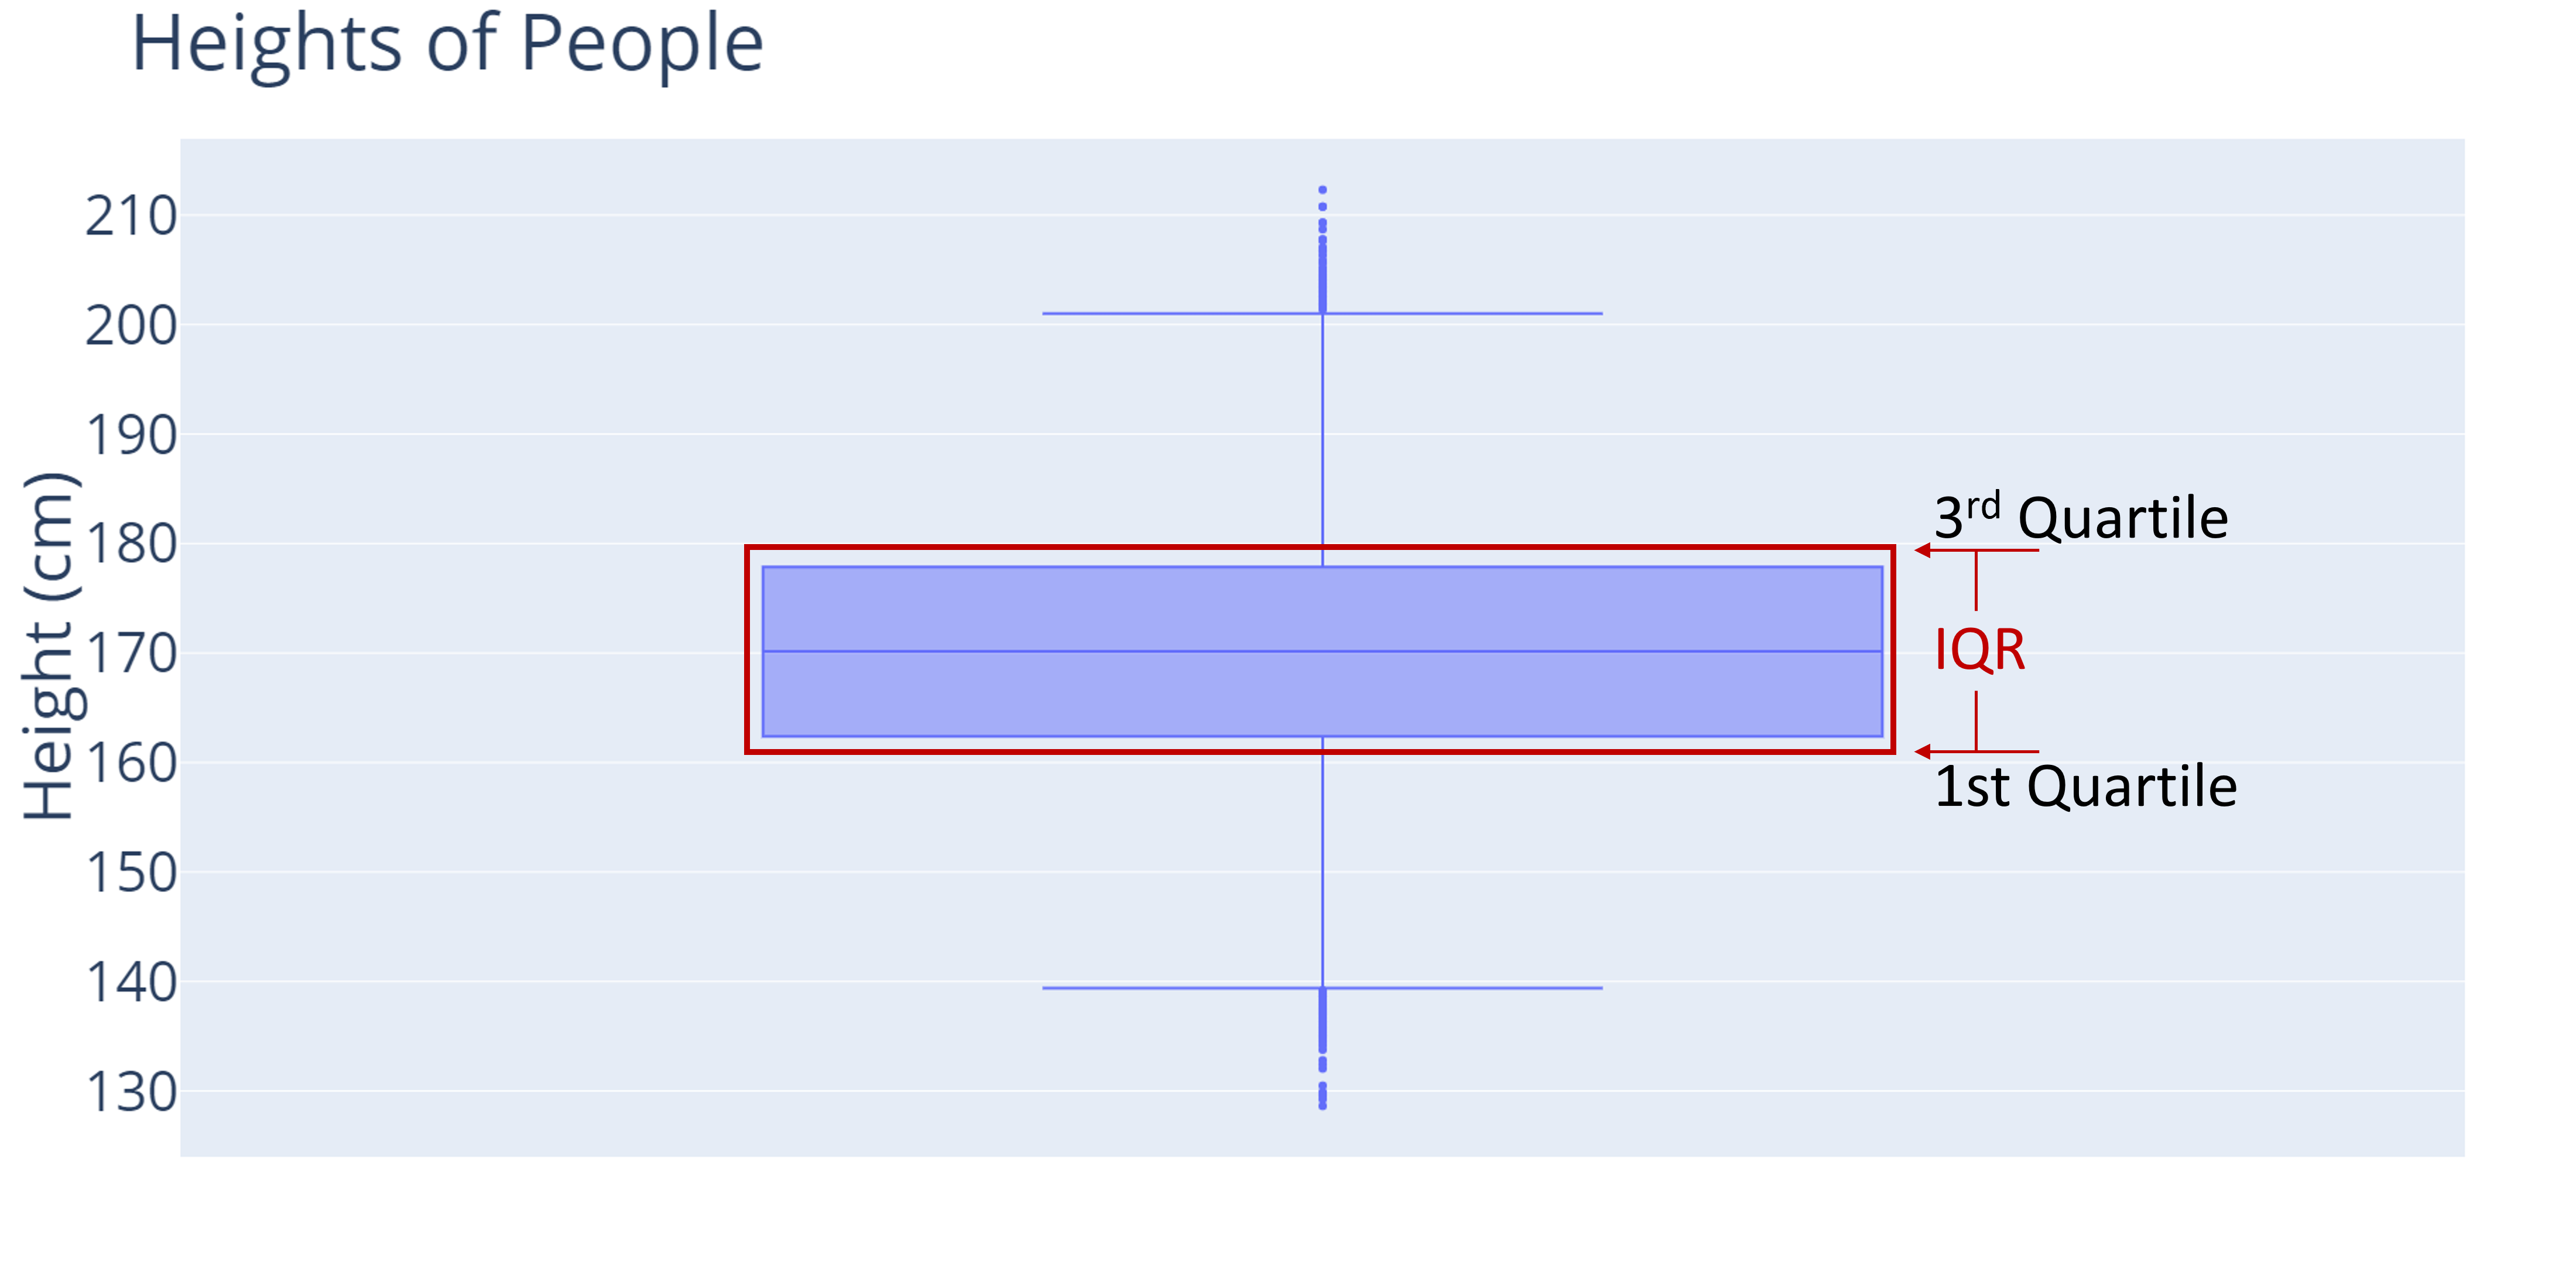
What are boxplots?
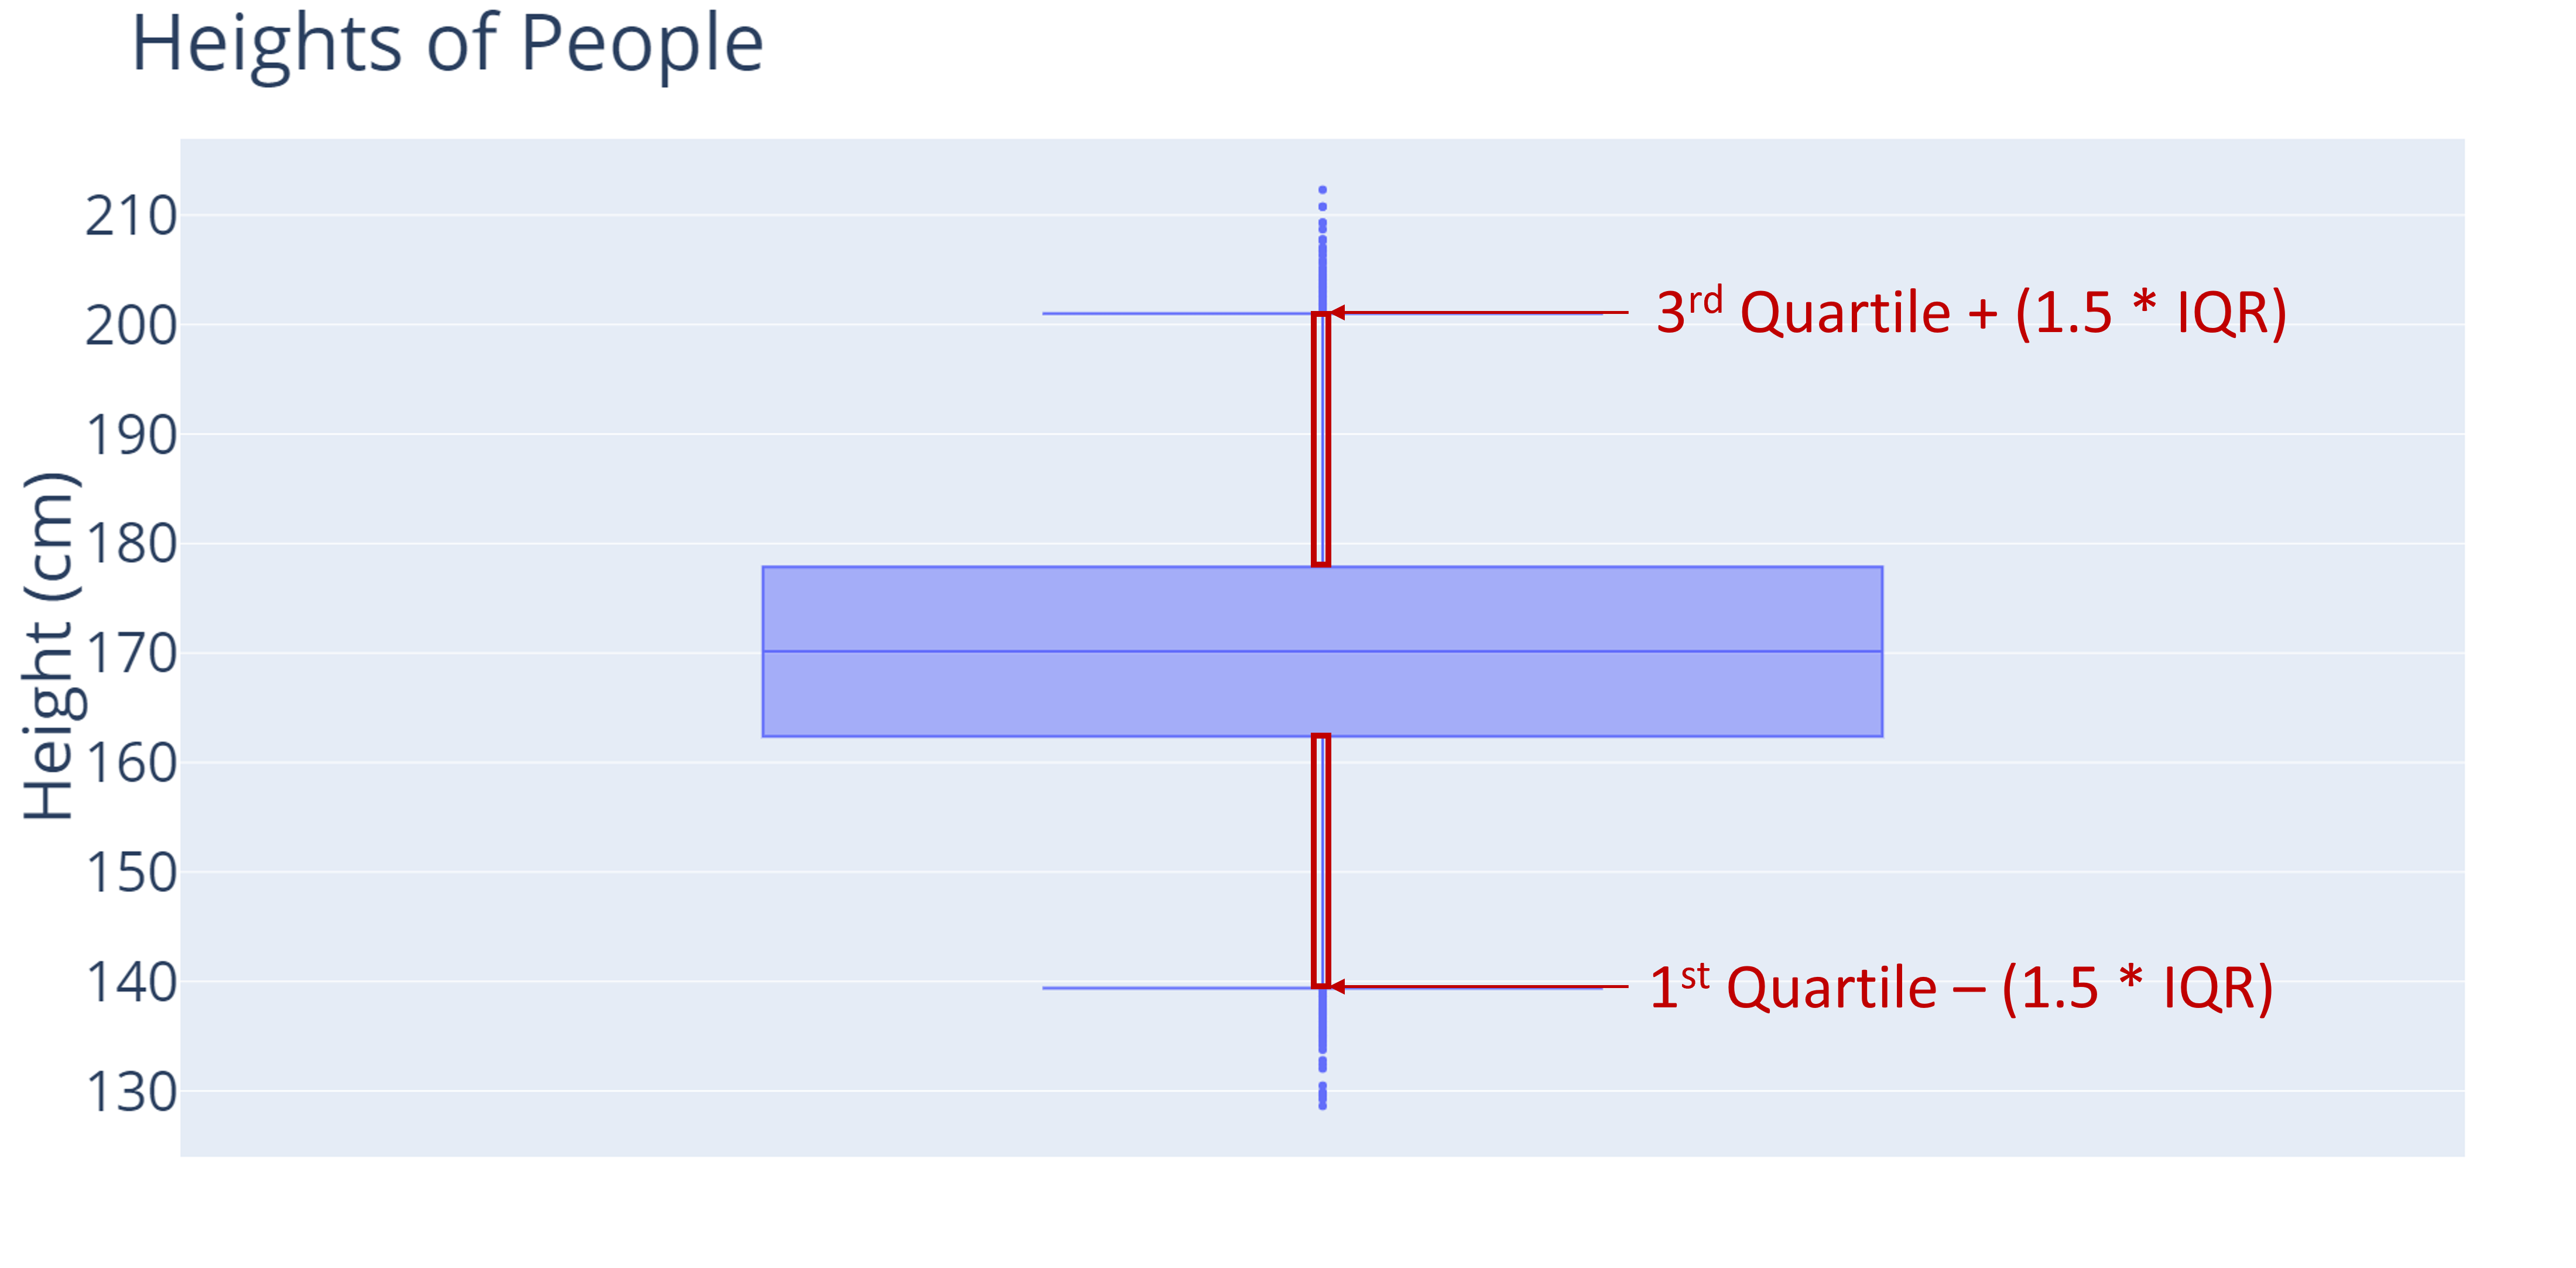
What are boxplots?
Comparing distributions with categorical variables